The U.S. competitive local exchange carrier (CLEC) business has not worked out as many had expected. Initially, the stand-alone long distance carriers thought the way had been cleared for a re-emergence in the local access business from which they had been barred in 1984, with the divestiture by AT&T of its local facilities, leading to the creation of the Baby Bells.
For a time, that seemed to be happening. At one time, the two contestants with a majority of market share were AT&T and MCI Communications.
A 2004 report by Frost and Sullivan noted that a "majority of ILECs' retail access line loss is attributable to two consumer-focused CLECs, AT&T and MCI." You might argue that a subsequent change in wholesale pricing rules then destroyed that business strategy.
Neither firm exists in its former form, as MCI assets now are part of Verizon and AT&T was bought by the former SBC.
Hundreds of billions of investment capital then flowed to lots of independent competitive firms run by telecom industry executives were seen as the logical beneficiaries. Nearly all of that capital ultimately was lost.
Cable companies were not widely thought to be the logical winners in the business.
These days, one might reasonably note that most consumer "CLEC" customers are served by U.S. cable companies, while a number of entities in a fragmented market serve most of the CLEC small business customers, with cable now turning its attention to the small business segment.
Similar sorts of trends have developed in the broadband access area, where 23 percent of all broadband connections were supplied by cable operators. DSL supplied about 15 percent of total connections. Fiber to the home represented about three percent of lines, while mobile wireless supplied 58 percent of connections, according to the Federal Communications Commission.
Basically, that means cable operators supply about a quarter of broadband connections and mobile service providers almost 60 percent. In other words, broadband access competition comes largely from wireless and cable.
Of the 146 million U.S. wireline retail local telephone service connections in service in June 2011, about 38 percent were provided by incumbent local exchange carriers, about 26 percent were ILEC business customers, while 20 percent of lines were supplied by non-ILEC residential service providers, while 16 percent were supplied by non-ILEC business service providers.
In addition to the cable companies, local telcos also have emerged as significant suppliers in the CLEC business, especially in business customer segments.
Revenues for U.S. CLECs were forecast to grow at a compound annual growth rate of 26.9 percent to reach $61.1 billion by 2006, Atlantic-ACM forecast in 2001.
In 2003, The Brattle Group estimated that U.S. CLECs held more than seven percent of the U.S. business market, and nearly 10 percent of the U.S. consumer market.
Neither of those figures has proven incorrect. A substantial amount of market share and revenue has indeed shifted to new providers. The Federal Communications Commission reported there were more than 206 million broadband access connections in service in mid-2011.
Assume an average revenue for each of those connections of $40 each (a blended rate assuming $35 for a mobile connection and $50 for a fixed connection, and including both higher-priced business connections and consumer connections). About 81 percent of those connections were supplied by cable or wireless providers. For the sake of argument, assume that every wireless line is functionally a competitor to an incumbent broadband line.
So 81 percent of 206 million connections would be 166.86 million accounts. At $40 a month, each of those lines might represent $480 a year worth of revenue. That would represent about $80 billion in annual revenue.
To be more strict, assume only cable modem and a quarter of "ILEC" broadband accounts are counted as "CLEC" revenue, for purposes of estimating CLEC broadband access revenue, eliminating all wireless lines.
That implies 27 percent of all fixed network broadband lines were supplied by "CLECs."
Of the 206 million broadband connections, 23 percent are supplied by cable operators and 18 percent are supplied using DSL or fiber to home technologies. That implies 37 million CLEC lines using telco platforms and 47.4 million cable high speed lines.
Assume 100 percent of the cable modem lines properly are counted as "CLEC" revenue, at an average of $50 a month. Assume that 20 percent of the DSL or FTTH lines are sold by CLECs at $80 a month.
That in turn suggests cable CLEC revenue of $28.4 billion and telco platform CLEC revenues of about $35.5 billion annually, for a total of about $35.5 billion in "CLEC" broadband access revenues.
Assume that the 36 percent of fixed voice lines represent $45 a month in revenue (a conservative estimate including both consumer and business lines). That implies $540 a year in revenue for each line in service.
The FCC says there were 146 million fixed voice lines in service in mid-2011. That would imply 52.6 million "CLEC" lines in service, or $28.4 billion in end user revenues, not including access or other carrier revenues.
So the "CLEC" revenue stream might be as little as $64 billion a year, or as much as $108.4 billion a year.
The point is that the overall "CLEC" business is reasonably estimated as being as large as it was earlier seen as becoming. The big difference is the role played by cable operators.
Tuesday, September 18, 2012
U.S. CLEC Business Hasn't Turned Out as Expected
 Gary Kim has been a digital infra analyst and journalist for more than 30 years, covering the business impact of technology, pre- and post-internet. He sees a similar evolution coming with AI. General-purpose technologies do not come along very often, but when they do, they change life, economies and industries.
Subscribe to:
Post Comments (Atom)
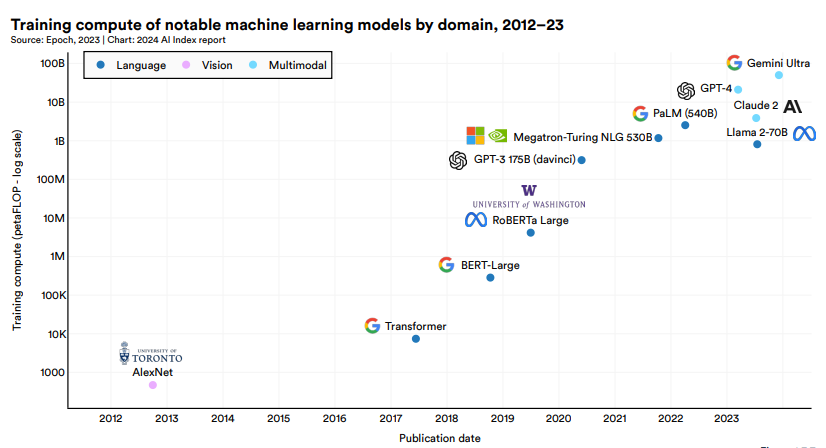
Costs of Creating Machine Learning Models is Up Sharply
With the caveat that we must be careful about making linear extrapolations into the future, training costs of state-of-the-art AI models hav...
-
We have all repeatedly seen comparisons of equity value of hyperscale app providers compared to the value of connectivity providers, which s...
-
It really is surprising how often a Pareto distribution--the “80/20 rule--appears in business life, or in life, generally. Basically, the...
-
Who gets to use spectrum, and concerns about interference from other users, now appears to be an issue for Google’s Project Loon in India. ...


1 comment:
Interesting article, thanks for sharing. Bicom Systems offers a CLEC solution - feel free to see our blog post about it: http://blog.bicomsystems.com/clec
Post a Comment