Sunday, July 26, 2020

Covid-19 Has Not Been Good for Communications Service Providers, Despite Conventional Wisdom

There is an unfounded belief that widespread lockdowns and stay-at-home orders in many countries “must be good” for communications service providers. 


That is not the case. In some cases service providers have experienced subscriber losses. A revenue contraction has widely been expected, is expected and earnings reports are starting to show that has happened. 


source: Analysys Mason


Recent times of economic contraction or business failure (2008 Great Recession the former case; Dot-com bubble burst the latter case) have lead to contractions in spending on communications services, if brief (rebound in one to three years). 


Consumer spending arguably changes less than business spending in times of stress, in part because consumer and small business spending is more often based on “what we must have” than “what we’d like to have.”


So consumers operate closer to minimum viable spending (need to have), where enterprises tend to operate with more spending headroom (nice to have).


Saturday, July 25, 2020

Why UCaaS and Cloud Have Not Displaced Older Alternatives

“Build versus buy” or “own versus rent” remains a key framework for sourcing any capability a firm requires. That basic analysis of total cost of ownership arguably explains why smaller firms often rent rather than own, or why very-large firms often own rather than rent. 


Some 20 years ago, some of us would have argued that hosted voice (now we call it unified communications) sold “as a service” would displace most use of business phone systems. Adoption has been far slower than some of us expected back in 2000. 


To be sure, a shift in demand has happened, but not as rapidly or completely as once expected. Total cost of ownership explains some of the “resistance.” Since feature parity for premises systems and hosted services has generally come to exist (that was not generally the case 20 years ago), total cost of ownership comes into play. 


The other variable is that the value of related services once separate from basic business phone service (conferencing, unified communications) now are all considered part of a single unified communications market. 


source: Grand View Research


Keep in mind that hosted voice  services have been commercially available since the early years of the 21st century, though arguably not commercially viable for business use until perhaps 2005 or 2006. 
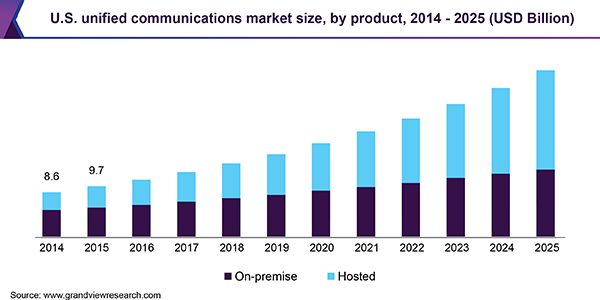
source: Grand View Rsearch


And that is where cost of ownership becomes a key argument for continuing to own business voice systems, rather than buying it “as a service.”


In a 100-user situation, the total cost of ownership over a five-year period favors a premises deployment over either private cloud or public cloud, according to TTx varies:

  • On-premise UC: $220-$240 per user per year

  • Public cloud UCaaS: $360-$480 per user per year

  • Private cloud UCaaS: $250-$350 per user per year


That includes upfront capital investment and recurring costs. A rough estimate of the cost per user for the first year for each system would be:

  • On-premise UC: $70,000-$90,0000 for hardware/infrastructure, software licenses, endpoints, and installation/deployment support.

  • Public cloud solution: In a 100 user environment, in most cases the upfront costs are $0.

  • Private cloud solution: Highly variable but declining


The recurring cost per user per year for each system might be:

On-premise UC: $120 to $145 per user, per year for ongoing maintenance, cost of upgrades and public network access. 


Public cloud UCaaS: Between $360 to $480 per user per year which includes the license cost per month and included deployment support. (This assumes an average of $30-$40 per user for licenses which includes renting the endpoints)


Private cloud UCaaS: $250 – $350 per user per year for financing and 3rd party maintenance


Of course, much hinges on volume. For smaller entities, hosted arguably provides lower TCO, especially when the customer wants a fully-featured platform. The tradeoffs and TCO are harder when mobility is a viable solution, when the customer does not require advanced features, and when the customer is willing to keep a premises system longer than five years. 


Any TCO analysis can be shifted when considering “soft costs” contract lock in, supplier instability, software upgrade and maintenance fees or situations where the number of supported users changes dynamically and often, for example. 


The same sort of analysis also applies to use of cloud computing (public or private) versus enterprise owned infrastructures. Generally speaking, volume tends to favor TCO of owned platforms. Episodic or dynamic variations in demand tend to favor cloud computing. Low volume favors cloud solutions, largely because of savings on capex. 


 And some argue the soft costs or value tip TCO one way or the other. License cost also can tip an analysis over a 10-year period as well. 


The point is that “as a service” solutions often make great sense. But so do “owned platform” choices. 


Needs to support dynamic and frequent shifts in demand can make a difference. But incorrect forecasting of demand also can lead to under-used resources, as when users overestimate the magnitude of cloud resources they require. 


And even when the “cost of compute or storage” TCO is understood, there might be other less-quantifiable business values deemed important, such as ability to interwork with business partner systems, apps and use cases. 


In other words, neither “cloud” nor “owned” computing or voice infrastructure “always” is the best choice.


Friday, July 24, 2020

Does Broadband Cause Growth, or Does Growth Cause Broadband?

Despite ongoing information technology investments, labor productivity growth declined sharply across OECD countries over the past decades, the OECD said in a 2019 report. The OECD argues that information technology has supported productivity, but that economy-wide productivity gains have been disappointing for other reasons.


source: OECD


That is worth keeping in mind. IT intensity--in and of itself--does not explain productivity or economic growth, any more than the mere existence of broadband internet access, no matter how high the quality or low the cost, alone drives economic growth, though this sometimes is argued. “If we only had better broadband…”


One can note correlations, to be sure. But correlation is not causation. Many would agree that broadband contributes to growth. But many things contribute. And the evidence about broadband access actually driving growth is unclear. 


It might well be the case that economically vibrant areas create the demand for quality broadband. 


What matters is how much value can be wrung from broadband and all the other complementary assets that must be in place to drive significant economic growth. 


“Digital technologies are characterised by strong complementarities (i) between the technologies themselves; (ii) with firms’ capabilities and assets, such as technical and managerial skills, organisational capital, innovation and financing capacity; and (iii) with policies that promote competition and an efficient reallocation of resources in the economy,” OECD says. 


In other words, economic growth results from many complementary sources. “Shortfalls in these complementary factors have slowed the diffusion of digital technologies and reduced the associated productivity benefits,” OECD said.  


It has been argued that gains are happening, but we cannot measure them. OECD does not believe that. 


“This is not just a measurement issue,” the report states. “Most researchers assess that mismeasurement is not the main reason of the observed productivity slowdown.” 


To the extent more-intensive application of IT has helped, it has not been enough to counteract the other negative forces. Perhaps that is typically the case. IT investment helps, but the drivers of results largely come from other sources.


Thursday, July 23, 2020

"New Normal" Might Well Look Pretty Much Like the Old Normal

This ABI Research forecast showing how company analysts have revised projections of future activity because of the Covid-19 pandemic might also suggest why many predictions of a “new normal” might turn out to be mostly ephemeral. That is not the conventional wisdom, but there are precedents for “less change than might have been supposed.”


source: ABI Research


To be sure, the pandemic might accelerate any pre-existing trends. What already was in motion might “go faster” because of pandemic responses. That is why some observers say internet usage experienced a year’s worth of change in a couple of months when people were forced to work from home and stay home from school. 


It is common to hear arguments that many or most workers will continue to work from home, post pandemic, and not return to in-office work. Many argue business travel will never return to past levels. Some might argue that will last until lots of firms start losing market share to competitors who are getting face to face with prospects. 


Beyond that, there are other events few who make the “nothing will be the same” arguments. They assume there is no vaccine, or that most people will refuse to vaccinate. They tacitly seem to assume some new version of virus keeps recurring, so that no country is ever fully “over” the pandemic. 


But people and firms will make different decisions if they no longer must worry about social distancing, masks and other protective measures. A non-scientific poll on Blind, for example, shows 66 percent of respondents reporting work from home is harming their mental health. Though impressionistic, that suggests people will want to return to normal work settings, once safety is no longer an issue. 


Productivity might also be an issue, longer term, if work from home spreads widely. 


Also, most businesses probably cannot sustain themselves with permanent social distancing. Profit margins are too thin to allow restaurants to operate at 25-percent capacity; airlines to block middle seats forever; elevators to restrict riders to only a few at a time. 


Expanding into Adjacencies is Risky, But Risks Must be Taken

When firms look for growth in slow-growth businesses, one obvious option is to seek adjacent roles in the ecosystem. The other common routes to “diversify” are to add new customer segments, new roles for existing products, new products, distribution channels or geographies. 


It never is especially easy, as analysts note that the odds of success decrease as firms move further away from their present “core” competencies and roles. 


source: Harvard Business Review 


The same holds for internal reform of organizations. Consider a study by McKinsey on successful organizational change. That study suggests that about 26 percent of all attempted organizational transformations succeed, whether or not change agents have taken at least 24 discrete actions in support of the change. In that study, the suggested actions are not necessarily the same as approval hurdles. But the principle is likely at work.


source: McKinsey


This should not come as a surprise. All proposed internal changes encounter resistance. Management experts sometimes note that the chances of any successful organizational change are somewhat slim, and more difficult as the number of approvals grows. 


source: Purdue University


If you have ever spent time and effort trying to create something new in the communications business, you know it rarely is easy, simple or uncomplicated to do so, and the larger the organization you work for, the harder it seems to be. That is because all organizational change involves power and politics, and changes will be resisted.  


You might be familiar with the rule of thumb that 70 percent of organizational change programs fail, in part or completely. 


There is a reason for that experience. Assume you propose some change that requires just two approvals to proceed, with the odds of approval at 50 percent for each step. The odds of getting “yes” decisions in a two-step process are about 25 percent (.5x.5=.25). 


source: John Troller 


The odds of success get longer for any change process that actually requires multiple approvals. Assume there are five sets of approvals. Assume your odds of success are high--about 66 percent--at each stage. In that case, your odds of success are about one in eight for any change that requires five key approvals (.66x.66x.66x.66x.66=82/243). 


You might argue the difficulty of change means firms should not try to change. That might work in stable industries, for stable firms, when demand is constant and profit margins are reasonable.


But connectivity firms do not work in that environment. There essentially is no option to “do nothing.” All legacy product lines are shrinking and must be replaced. So the risk of change must be taken.


How Much Value from Telco Data Stores?

One often hears it said that connectivity providers serving enterprises and consumers have a trove of data that can be mined using analytics to predict or help prevent some issues such as churn. Call center detail can be used to identify service issues and outages. There might also be other ways to mine data stores to reduce truck rolls and service calls, especially related to network issues. 


Beyond that, one might argue, there is not actually all that much data useful at the application layer. Mobile network operators have location data, but it never is so clear that such data can be used in a personally-identifiable way, allowing revenue streams to be created. 


Google, on the other hand, seems to know with great precision not only where users are, and also can build histories of movement in space. Google also has lots of other data to collate with movement details, which is how it builds its advertising business.


The point is the value of service provider analytics never seems as high as proponents tout, beyond network operations details. 


That is not to downplay the value of network-related analytics. But one might be skeptical about the value of much other customer account data as a way of predicting much of anything about demand for new services. Telco data stores do not inherently include much detail that is useful for psychographics or even much in the way of demographics. And then there are privacy laws which might restrict the use of such information, even if available. 


One often hears it said that there are “hundreds” of indicators an account is about to churn, for example. And, to be sure, U.S. mobile operator churn levels are quite low. 


What is not so clear is that it is the application of analytics that primarily explains the lower churn. Some might argue that competition has been so robust that switching does not yield the benefits it once dida, and the friction, such as having to buy a pricey new smartphone, also act as barriers to switching behavior. 


At least in the U.S. mobile market, multi-user plans also seem to have worked to reduce churn levels. Multi-service bundles have provided the same benefit in fixed network operations. 


The point is that some perspective on how much can be gleaned from telco data stores is prudent. Beyond network health and status, which does contribute to customer service call and chat volume, there is arguably little useful detail beyond location (and limited ability to use such personally-identifiable information) that might prove the foundation for applications and revenue streams based on that data.


Tuesday, July 21, 2020

Is U.S. Internet Access Actually Expensive or Slow?

Minimums, median and maximum all are valuable indices in life, business and nature, including measures of internet access adoption or “quality.”


Benchmarks are valuable when trying to measure “progress” toward some stated goal. A minimum speed definition for broadband access is an example. But that does not obviate the value of knowing maximum and median values, either, especially when the typical U.S. internet access buyer routinely buys services significantly higher than the minimum. 


In the first quarter of 2020, for example, only about 18 percent of U.S. consumers actually bought services running at 40 Mbps or less. All the rest bought services running faster than 50 Mbps. 


source: Openvault


An analysis by the Open Technology Institute concludes that “consumers in the United States pay more on average for monthly internet service than consumers abroad—especially for higher speed tiers.” 


As always, methodology matters. The OTI study examines standalone internet access plans, even if that does not account for the plans most consumers actually buy. The figures do not appear to be adjusted for purchasing power differences between countries. Were that done, it might be clearer that average internet access prices are about $50 a month, globally


Global prices are remarkably consistent, in fact, when adjusting for purchasing power conditions in each country.  


Nor does any snapshot show longer term trends, such as lower internet access prices globally since at least 2008. A look at U.S. prices shows a “lower price” trend since the last century. U.S. internet access prices have fallen since 1997, for example. 


source: New America Foundation


The OTI study claims that, comparing average prices between markets with and without a municipal system shows higher prices in markets with government-run networks. Not all agree with that conclusion. 


“The OTI Report’s data, once corrected for errors, do not support the hypothesis that government-run networks charge lower prices,” says Dr. George Ford, Phoenix Center for Advanced Legal and Economic Public Policy Studies chief economist. 


“Using OTI’s data, I find that average prices are about 13 percent higher in cities with a municipal provider than in cities without a government-run network,” says Ford. 


Our definitions of “broadband” keep changing in a higher direction. Once upon a time broadband was anything faster than 1.5 Mbps. Ethernet once topped out at 10 Mbps. 


Today’s minimum definition of 25 Mbps will change as well. The point is that having a minimum says nothing about typical or maximum performance.


About 91 percent to 92 percent of U.S. residents already have access to fixed network internet access at speeds of at least 100 Mbps, according to Broadband Now. And most buy speeds in that range. 


source: Broadband Now


It is useful to have minimum goals. It also is important to recognize when actual consumers buy products that are much more advanced than set minimums.


Directv-Dish Merger Fails

Directv’’s termination of its deal to merge with EchoStar, apparently because EchoStar bondholders did not approve, means EchoStar continue...