Friday, July 16, 2021

SMB IT Spending to Return to Pre-Covid Levels in 2022

One legitimate question we all should have is what changes are relatively permanent post Covid and which trends revert to the mean (back to pre-Covid states). Most might agree that various attempts at “digital transformation” have accelerated. The issue is whether we have simply accelerated temporally, but at similar rates, or whether the rate of change has increased. Nobody seems to believe demand has decreased. 


Analysys Mason suggests that on at least one metric--the volume of information technology investment--Covid caused a change in investment. Analysys Mason also believes the rate of investment will return to pre-Covid levels in 2022. 


Many industries will be making bets about the level of demand for all sorts of  products as “normalcy” returns. 


source: Analysys Mason 


Irrespective of investment levels, virtually everyone expects more growth for cloud computing solutions. In some respects, that is a simple reflection of the fact that computing architecture has changed. Cloud or remote computing now is the norm, as apps are nearly universally expected to be consumable using internet networks.


Thursday, July 15, 2021

Global Fixed Network Average Downstream Speed is Now 106.6 Mbps

With the caveat that “average” anything related to the internet can obfuscate as much as illuminate, “average” global mobile speed in June 2021 was 55 Mbps downstream and 12.7 Mbps upstream. “Average” fixed broadband downstream speed was 106.6 Mbps and upstream was 57.7 Mbps. 


source: Speedtest 


Methodology does matter, though, as different sources report often-disaparate figures. 

Wednesday, July 14, 2021

Telco Content Execution Risk is a Bigger Issue than Strategic Miscues

There is a difference between execution risk and strategic risk. In the former instance a firm or person might have had the right idea, but chose the wrong set of actions. In the latter instance a firm or person chooses an incorrect plan. 


But telco efforts to diversify into content or media--though panned--actually have been a success, by standard innovation rules of thumb. 


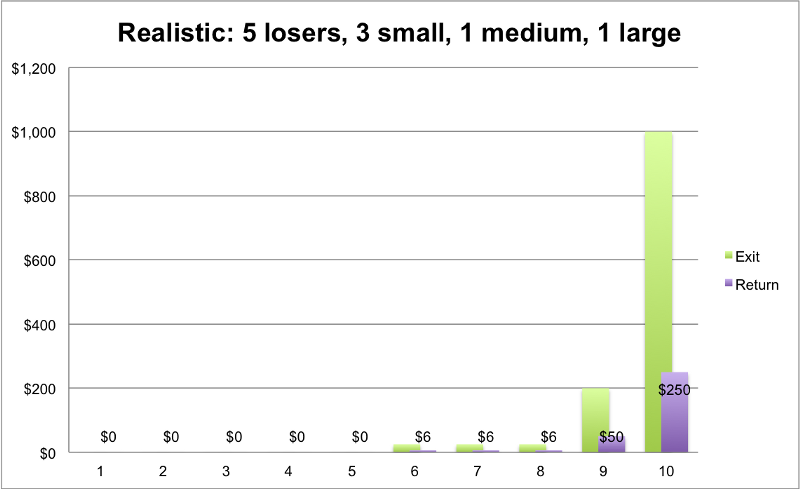
Most efforts at innovation of any kind fail. The general rule of thumb is that eight to nine out of 10 efforts will fail. The corollary is that only about one in 100 innovation efforts will create a truly-significant positive change in outcomes. 


Telecom firms sometimes make moves that later are viewed as mistakes of execution or strategy. We might be wrong about such conclusions, in substantial part. 


Consider Verizon’s sale of 90 percent of its  AOL assets, or AT&T spinning out its DirecTV and Warner Media interests into external entities. Both those moves are viewed by many as examples of telco failure. But how many other innovation efforts by either firm, or all other providers, have generated billions of dollars in incremental new revenue, so quickly? 


How many generate billions in incremental cash flow for any single firm? Answer: almost none. 


Some will argue diversifying into content is not a good strategy for connectivity providers. But in 2017 50 telcos around the globe generated more than $90 billion in content revenues, mostly from video services


Neither AOL nor Time Warner and DirecTV had the strategic impact Verizon or AT&T hoped for. In the former case lack of scale was an issue; in the latter case the issue was attendant debt burdens. The argument can be made that Verizon simply did not invest enough, or that AT&T invested too much (took on too much debt). 


Still, the incremental boost of revenue and cash flow in both instances was arguably much better than any other moves either firm made in new lines of business. Either firm’s investments in internet of things platforms or services, while also strategically important, produce revenues and cash flow that pale in comparison to what each firm was able to accomplish in content and video, in comparable time frames. 


Organic growth in core connectivity services cannot contribute much, in a growing number of connectivity markets, to revenue. The phrase terminal decline has been applied to legacy connectivity services, for example.  And that leads to a search for new revenue sources.  


source: GSMA Intelligence 


A few cable TV companies also have transformed themselves from video distributors into content owners, mobile service providers, business connectivity providers and leading suppliers of broadband access as well. 


The notion that connectivity providers “cannot” master the content business is incorrect. It can be argued that telcos have had more financial success in content than in their roles as app store providers, equipment manufacturers, computing suppliers or data center suppliers. 


Though legacy telcos do participate to some extent in the enterprise phone system business, system integration, virtual private network and other connectivity lines of business, they often do so as lesser providers in segments dominated by others (either communication specialists or information technology providers). 


The point is that telcos arguably have been more successful in video entertainment than in all other diversification efforts of the past four decades. 


source: GSMA 


In 2018 nearly half of telco executives surveyed by EY cited television and video services as among the top three best ways to grow new revenues. The alternative is failure, if present revenue and profit trends continue. 


Global telco revenue growth rates remain stubbornly close to one percent per year, below the long-term rate of inflation. If one were looking any key component of telecom revenues, one would see a historical curve reminiscent of a standard product life cycle, with declining demand, declining profits or both


Product maturation, product substitutes and changes in value are issues telcos have dealt with for a couple of decades already.  So if the core business is under strategic attack, what strategy is called for?


The range of options have not really changed much in four decades. Telcos can run today’s business more efficiently; grow the current business through acquisition or innovation or get into new lines of business. 


All three have worked for various providers; at various times. The biggest single revenue driver was entry into the mobile business. First voice subscriptions for business users; then consumer users; then text messaging and now internet access have provided waves of revenue growth in the mobile segment. 


The larger point is that most innovation efforts fail. Content and video services have been among the successes, not the failures.


Actually, AT&T Did Quite Well in Content and Video Subscription Businesses

Many will criticize telco failures to "innovate." Many will pan diversification efforts such as that made by AT&T into content ownership and entertainment video services. By one reckoning, AT&T actually did quite well.


Many will criticize telco failures to "innovate." Many will pan diversification efforts such as that made by AT&T into content ownership and entertainment video services. By one reckoning, AT&T actually did quite well.


It actually took only a handful of attempts before AT&T was able to emerge as a significant provider of video content, video subscriptions and internet access. In fact, it did not actually take many tries before AT&T and Verizon actually created roles for themselves in content and video. 


On June 24, 1998, AT&T acquired Tele-Communications Inc. for $48 billion, marking a reentry by AT&T into the local access business it had been barred from since 1984. 


Having spent about two years amassing a position in local access using resold local Bell Telephone Company lines, AT&T wanted a facilities-based approach, and believed it could transform the largely one-way cable TV lines into full telecom platforms. 


That move was but one among many made by large U.S. telcos since 1994 to diversify into cable TV, digital TV, satellite TV and fixed wireless, mostly with an eye to gaining share in broadband services of a few different types. 


By some accounts, TCI was at the time the second-largest U.S. cable TV provider by subscriber count, trailing only Time Warner. TCI had 33 million subscribers at the time of the AT&T acquisition. As I recall, TCI was the largest cable TV company by subscribers. 


For example, in 2004, six years after the AT&T deal, Time Warner Cable had just 10.6 million subscribers. In 2000, by some estimates, Time Warner had about 13 million subscribers. That undoubtedly is an enumeration of “product units” rather than “accounts.” Time Warner reached the 13 million account figure by about 2013, according to the NCTA


Since 1994, major telcos had been discussing--and making--acquisitions of cable TV assets. In 1992 TCI came close to selling itself to Bell Atlantic, a forerunner of Verizon. Cox Cable in 1994 discussed merging with Southwestern Bell, though the deal was not consummated. 


US West made its first cable TV acquisitions in 1994 as well. In 1995 several major U.S. telcos made acquisitions of fixed wireless companies, hoping to leverage that platform to enter the video entertainment business. Bell Atlantic Corp. and NYNEX Corp. invested $100 million in CAI Wireless Systems.


Pacific Telesis paid $175 million for Cross Country Wireless Cable in Riverside, Calif.; and another $160 to $175 million for MMDS channels owned by Transworld Holdings and Videotron in California and other locations. 


By 1996 the telcos backed away from the fixed wireless platforms. In fact, U.S. telcos have quite a history of making big splashy moves into alternative access platforms, video entertainment and other ventures, only to reverse course after only a few years. 


But AT&T in 1996 made a $137 million  investment in satellite TV provider DirecTV. 


Microsoft itself made an investment in Comcast in 1997, as firms in the access and software industries began to position for digital services including internet access, digital TV and voice services. In 1998 Microsoft co-founder Paul Allen acquired Charter Communications and Marcus Cable Partners. 


Those efforts, collectively, are well within the “one success in 10” rule of thumb, for any single firm, and close to it for the entire industry. More significantly, the amount of revenue generated by those efforts come well within the “one in 100” rules of innovative success for “blockbuster” impact. 


AT&T, remember, continues to own 70 percent to 80 percent of its former Time Warner content assets. It continues to benefit from the cash flow of DirecTV and its fixed network video services. It continues to drive cash flow from HBO Max.


And all that was achieved with far fewer than 10 attempts. By standard metrics of innovation, that clearly beats the odds.


What most will miss is the difficulty of making successful change in any organization, on a routine basis. As a rule of thumb, only about one in 10 efforts at change will succeed. Quite often, only about one in 100 successful innovations is truly consequential in terms of organization performance.


source: Organizing4Innovation 


That means we must tolerate a high rate of failure before we can hope for successful change. And we must fail quite a lot before we encounter a successful innovation with the power to change a company's or a whole industry's fortunes.


Of all the innovations connectivity providers have attempted--and been criticized for--how many have had industry-altering implications? Not many. Fixed network voice; mobile phones; internet access and possibly entertainment video subscriptions have been transformative.


Deregulation, privatization and competition have been historically transformative. But one might argue that was something that "happened to" the connectivity business, not necessarily an innovation of the industry itself.


Yes, we have seen many generations of business data networking services and business phone systems and services. But few have revenue magnitudes so great they change the fortunes of the industry or whole firms. In 150 years, only mobility and internet access have had clear industry-altering implications.


We all are familiar (even when we do not know it) with the sigmoid curve, otherwise know as the S curve, which describes the normal adoption curve for any successful product. We are less familiar with the idea that most innovations fail, whether that is new products, new technologies, new information technologies or business strategies. 


S curves apply only to successful innovations.


Most new products simply fail. In such cases there is no S curve.  The “bathtub curve” was developed to illustrate failure rates of equipment, but it applies to new product adoption as well. Only successful products make it to “userful life” (the ascending part of the S curve) and then “wearout” (the maturing top of the S curve before decline occurs). 


source: Reliability Analytics


Though nobody “likes” to fail, there is good reason for the advice one often hears to “speed up the rate of failure.” The advice is quite practical. 


Only about one in 10 innovations actually succeeds. Those of you who follow enterprise information technology projects will recognize the pattern: most efforts at IT change actually fail, in the sense of achieving their objectives. 

source: Organizing4Innovation 


“We tried that” often is the observation made when something new is proposed. What almost always is ignored is the high rate of failure for proposed innovations. About nine out of 10 innovations will probably fail. Most of us are not geared to handle that high rate of failure. 


Unwillingness to make mistakes almost ensures that an entity will fail in its efforts to grow, innovate or even survive. 


Those of you who follow startup success will recognize the pattern as well: of 10 funded companies only one will really be a wild success. Most startups do not survive


source: Techcrunch 


Connectivity providers are not uniquely free from the low success rate of most innovations. Innovation is hard. Most often efforts at innovation will fail. Even smaller efforts will fail nine times out of 10. An industry-altering innovation might happen only once in 100 attempts.


The more failure, the more the chances for eventual success. Many would consider telco initiatives in content and video subscriptions to have "failed." It is more accurate to call them an innovative success, given the relative handful of attempts to lead that business.


AT&T continues to own 70 percent of its former Time Warner content assets. It continues to benefit from the cash flow of DirecTV (about 71 percent ownership) and its fixed network video services. It continues to drive cash flow from HBO Max.


And all that was achieved with far fewer than 10 attempts. By standard metrics of innovation, that clearly beats the odds.


Why All Forecasts are Sigmoid Curves

STL Partners’ forecast for Open Radio Access Network investments--whether one agrees with the projections or not--does illustrate one principle: adoption of successful new technologies or products tends to follow theS curve growth model.


The S curve  has proven to be among the most-significant analytical concepts I have encountered over the years. It describes product life cycles, suggests how business strategy changes depending on where on any single S curve a product happens to be, and has implications for innovation and start-up strategy as well. 


source: Semantic Scholar 


Some say S curves explain overall market development, customer adoption, product usage by individual customers, sales productivity, developer productivity and sometimes investor interest. It often is used to describe adoption rates of new services and technologies, including the notion of non-linear change rates and inflection points in the adoption of consumer products and technologies.


In mathematics, the S curve is a sigmoid function. It is the basis for the Gompertz function which can be used to predict new technology adoption and is related to the Bass Model.


 I’ve seen Gompertz used to describe the adoption of internet access, fiber to the home or mobile phone usage. It is often used in economic modeling and management consulting as well.


Source: STL Partners


The following  graph illustrates the normal S curve curve of consumer or business adoption of virtually any successful product, as well as the need to create the next generation of product before the legacy product reaches its peak and then begins its decline. 


The graph shows the maturation of older mobile generations (2G, 3G) in red, with adoption of 4G in blue. What one sees is the maturing products are the top of the S curve (maturation and decline) while 4G represents the lower part of the S curve, when a product is gaining traction. 


The curves show that 4G is created and then is commercialized before 3G reaches its peak, and then declines, as the new product displaces demand for the old. 

source: GSA


Another key principle is that, successive S curves are the pattern. A firm or an industry has to begin work on the next generation of products while existing products are still near peak levels. 


source: Strategic Thinker


It also can take decades before a successful innovation actually reaches commercialization. The next big thing will have first been talked about roughly 30 years ago, says technologist Greg Satell. IBM coined the term machine learning in 1959, for example.


The S curve describes the way new technologies are adopted. It is related to the product life cycle. Many times, reaping the full benefits of a major new technology can take 20 to 30 years. Alexander Fleming discovered penicillin in 1928, it didn’t arrive on the market until 1945, nearly 20 years later.


Electricity did not have a measurable impact on the economy until the early 1920s, 40 years after Edison’s plant, it can be argued.


It wasn’t until the late 1990’s, or about 30 years after 1968, that computers had a measurable effect on the US economy, many would note.


source: Wikipedia


The point is that the next big thing will turn out to be an idea first broached decades ago, even if it has not been possible to commercialize that idea. 


The even-bigger idea is that all firms and industries must work to create the next generation of products before the existing products reach saturation. That is why work already has begun on 6G, even as 5G is just being commercialized. Generally, the next-generation mobile network is introduced every decade. 


source: Innospective


There are other useful predictions one can make when using S curves. Suppliers in new markets often want to know “when” an innovation will “cross the chasm” and be adopted by the mass market. The S curve helps there as well. 


Innovations reach an adoption  inflection point at around 10 percent. For those of you familiar with the notion of “crossing the chasm,” the inflection point happens when “early adopters” drive the market. 

source 


It is worth noting that not every innovation succeeds. Perhaps most innovations and products aimed at consumers fail, in which case there is no S curve, only a decline curve. 


source: Thoughtworks 


The consumer product adoption curve and the S curve also are related to the point at which early adopters are buyers, but before the mass market adoption starts. 


source: Advisor Perspectives 


Also, keep in mind that S curves apply only to successful innovations. Most new products simply fail. In such cases there is no S curve.  The “bathtub curve” was developed to illustrate failure rates of equipment, but it applies to new product adoption as well. Only successful products make it to “userful life” (the ascending part of the S curve) and then “wearout” (the maturing top of the S curve before decline occurs). 


Tuesday, July 13, 2021

State of the Internet


Lots of stats. 

Monday, July 12, 2021

What Drives Telco Growth?

Connectivity provider revenue growth mostly comes from acquisitions and mergers, despite some thinking that organic growth is the key. 


As fast as T-Mobile has been growing in the U.S. market, its merger with Sprint has driven the biggest change in revenue and market share over the last decade. 


source: UBS 


source: Seeking Alpha 


As important as operational excellence might be, mobile operator executives, for example, believe mergers, acquisitions and alliances will drive most of the growth gains. 

source: KPMG


Historically, tier-one service providers have arguably obtained most of their growth from acquisitions, not organic growth. That makes sense in a business where organic growth is one to two percent per year. 


source: Deloittte 


Increasing scale is one way European telcos see revenue growth, notes McKinsey. Still, organic growth is propelled by changes in buyer demand (shift to internet access, for example) and operating performance.  Shifts of market share are less likely to drive growth. 


Organic growth is tougher when markets are saturated, and most connectivity markets are reaching saturation.


The point is that focusing on the core connectivity business makes sense, as that drives the bulk of total revenues. The problem is that no matter how well a competent connectivity provider does, connectivity services alone will not drive much revenue growth, which happens at about the rate of inflation. 


Market share shifts sometimes are possible, but mergers to boost scale have been significant drivers of revenue growth. In some cases, they have provided most of the revenue growth.


Directv-Dish Merger Fails

Directv’’s termination of its deal to merge with EchoStar, apparently because EchoStar bondholders did not approve, means EchoStar continue...