Friday, July 6, 2018

Winner Take All is the Rule, Not the Exception, And Always Has Been

Some observers find troubling (and unusual) the present market structure of the internet apps industry, where a “winner take all” pattern tends to exist. Historians will argue that such patterns are absolutely normal, in any industry, and have been the case in the pre-internet era as well.

In other words, "winner take all" is not the result of a broken market, but instead the normal and expected outcome in any competitive market, in any era, and not just in the internet age.

For that reason, it is not so clear that "winner take all" trends in the app business are necessarily the result of a broken market. That is the shape markets tend to take. In fact, what is unusual are markets where the 6:3:1 pattern does not exist.

As a rule, any market or industry will tend to see a huge difference between the leader and number two and number three providers, in terms of market share, with a corresponding difference in profit margin.

So a classic market share structure would have something like a 60-30-10 pattern (or 55-27-18 if you want absolute fidelity to the rule). The key point is that pre-internet markets tended to be “winner take all.” That is not new, nor necessarily evidence of market failure.

So winner take all is the rule, not the exception, in most markets, and has been the case even before the internet ecosystem was created. The classic pattern is that the leader in any market  has twice the share of the second provider, which in turn has twice the share of number three.

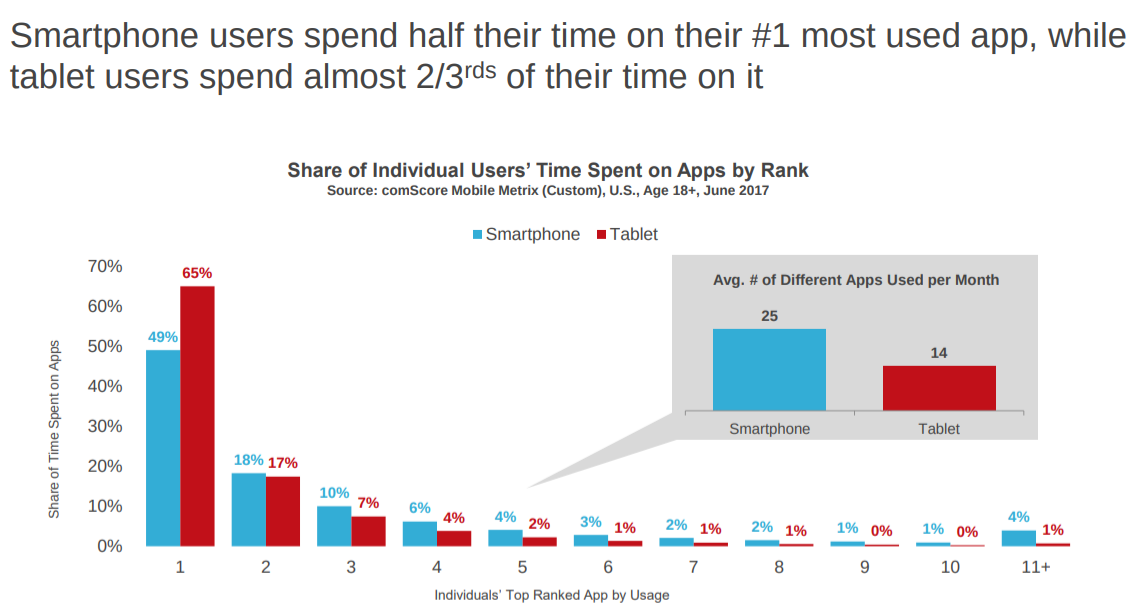
You can see the pattern in app use. U.S. smartphone users spend nearly half their digital media time on their most-used app, with a long tail of lesser-used apps, comScore data shows. Tablet users spend 60 percent of their time on the most-used app.


Thursday, July 5, 2018

ISPs Want Freedom Netflix Has

Netflix is introducing new premium plans in Europe featuring support for 4K and high dynamic range support that would not be available on standard plans. Adding features based on quality is not unusual for any product supplier, nor is the offering of different product models.

We note this only to point out that while observers seem to understand the business wisdom when suppliers offer different models and features, at different price points, to satisfy different segments of the market, that same business practice is supposed to be denied to internet access providers.

The point: Netflix is creating additional value, and differentiating plans, to support its business model. ISPs want to do the same thing.

source: BLS  

In principle, offering quality of service or other features of an access service, and therefore creating differentiation, is simply a normal business practice. So long as standard and economy products exist, premium versions are not necessarily harmful to consumer choice, the right to use any lawful application, or the ability of app providers to be reached by their customers and users.

Increasing product value might be a bigger business challenge in any industry where prices for the standard product version are falling, as has been the case for U.S. internet access prices, where prices have fallen for two decades, according to U.S. Bureau of Labor Statistics data.

According to the U.S. Bureau of Labor Statistics, prices for internet services and electronic information providers were 21.98 percent lower in 2018 versus 2000.

Between 2000 and 2018: Internet services experienced an average inflation rate of -1.37 percent per year. In other words, internet services costing $50 in the year 2000 would cost $39.01 in 2018 for an equivalent purchase.

Compared to the overall inflation rate of 2.09 percent during this same period, inflation for internet services was significantly lower.

As budget and standard consumer internet access offers keep getting better, in terms of bandwidth, usage buckets, latency and cost-per gigabyte of usage, as well as absolute prices in many cases (and certainly for inflation-adjusted pricing),  the search for ways to add value is understandable.


Australia National Broadband Network Falls Behind Plan for Revenue, Above Plan for Cost

It never is unexpected when a big construction project, especially a project being conducted on a continent-sized area, falls behind schedule. And Australia’s National Broadband Network appears to be falling behind its original targets, in terms of customer activations and planned-for revenue. But some might say the shortfalls are relatively minor.

Cumulative revenue, for example, is down about $18 million, but some might argue that is not so much for a national project of this scope, in its second year of actual construction.

More worrisome is the possibility that the NBN will never actually make a profit, as costs are higher than originally planned and average revenue per account is far lower than originally planned, balanced however by wholesale revenue.


Networks Creep Towards A La Carte

It is an open question whether most of today’s linear programming networks (delivered using one or more fixed or satellite networks) could exist if they had to go direct to consumer as stand-alone streaming packages, as does HBO, or as a few other networks might contemplate.

So far, channels historically not supported by advertising have had the easier time of the transition. HBO, Starz and Showtime, for example, can be purchased as streaming services.

A key issue is consumer expectations about cost of a single channel. Surveys show consumers expect a cost of about $2 per channel, per month, roughly five to eight times more than many channels now charge.

Few streaming channels are sold for such prices, though, suggesting the economics of stand-alone streaming---for most channels--does not allow the expected pricing of a couple dollars per month, as one might deduce from today’s 40-channel bundles selling for up to $40 a month.

CBS sells streaming access as well, suggesting the possibility that the most-watched ad-supported channels might be able to create stand-alone streaming services.

A sort of hybrid step is allowing big retailers such as Amazon to handle sales and distribution. Amazon Channels feature:

  • HBO ($14.99 per month)
  • Showtime ($8.99 per month)
  • Cinemax ($9.99 per month)
  • Starz ($8.99 per month)
  • Mubi ($5.99 per month)
  • Sundance Now ($6.99 per month)
  • Sports Illustrated TV ($4.99 per month)
  • Comic Con HQ ($4.99 per month)
  • History Vault ($4.99 per month)
  • Comedy Central Stand-Up ($3.99 per month)
  • PBS Masterpiece ($5.99 per month)
  • IndiePix Unlimited ($5.99 per month)
  • DocComTV ($2.99 per month)
  • Smithsonian Earth ($3.99 per month)
  • Reelz ($3.99 per month)
  • Daily Burn ($14.99 per month)
  • PBS Kids ($4.99 per month)
  • Shudder ($4.99 per month)
  • Cheddar ($2.99 per month)

Some will point to the success of Netflix, Amazon Prime, Sling TV, DirecTV Now, Hulu and others.

Some of those services still use a bundling concept (a menu of TV shows, movies and specials), but not discrete channels. Others use a “skinny bundle” of channels to keep costs lower.

And while Disney and ESPN will undoubtedly be early to test the economics of single-channel streaming, most other networks are likely to resist, as it remains profoundly unclear whether such a strategy would be profitable.

Also, bundles remain popular with consumers, leading to the creation of “skinny” bundles that cost less because they contain fewer channels (and therefore less “cost of goods”).

Monday, July 2, 2018

Edge Computing Might Hit Inflection Point About 2021

Edge computing is entering an early “hybrid” state, and will enter its “native edge” period starting about 2022, GSMA Intelligence now estimates. Revenue will probably hit an inflection point around 2021, according to Grandview Research estimates.


U.S. edge computing market, 2016 - 2025 (US$ Million)
U.S. fog computing market
source: Grandview Research

IoT Networks: One Size Does Not Yet Fit All

As much as network technologists might prefer a single network that does everything well, that almost never is the case in metro area communications, and remains true for internet of things networks as well.

The number of potential metro platforms is somewhat bewildering, and includes a number of proprietary (Sigfox and others) and some more-open or standards-based alternatives. We might not be able to say with any certainty which platforms will ultimately “win,” based on market share.


To be sure, sensor applications (machine to machine) have been in place for decades, mostly using the 2G network. And many expect that several local area technologies (Wi-Fi, others) will be used inside buildings to support IoT applications and devices.

But many believe the key “race” is between LoRaWAN providers and mobile suppliers using NB-IoT and LTE-M, in the metro area portion of the market.

In terms of mobility, LoRaWAN and LTE-M work better. NB-IoT really is designed for stationary apps. LoRaWAN and NB-IoT are better in terms of sensor or device battery life than LTE-M.


But LTE-M has a clear advantage in terms of bandwidth. LoRaWAN is optimized for applications where messages are sent infrequently.

NB-IoT and LoRaWAN have better link budgets than LTE-M, though, suggesting either NB-IoT or LoRaWAN could have coverage advantages, depending on the amount of interference present on the unlicensed spectrum used by any particular LoRaWAN network, at any particular time and space.


It is hard to say how costs and use cases might change. If the mobile industry gets its way, LTE-based solutions might well rival LoRaWAN and other solutions in terms of battery life, coverage and other performance attributes, while covering a fuller range of use cases (bandwidth, signaling frequency, mobility).

But those are wider area or mobility use cases. Many IoT apps might only require short-range access (Wi-Fi and others) to reach the access, and then the backbone networks.


Sunday, July 1, 2018

Is Video Market Shrinking or Growing?

Is the video subscription business shrinking? The answer depends on which part of the business one is looking at.

As linear video subscription prices rise, take rates drop. Cheaper streaming alternatives, meanwhile, keep growing, both in terms of revenue and subscribers. So you might think the market is shrinking, in terms of revenue. Maybe not.

Higher prices for linear subscriptions will drive even more consumers towards alternatives, and that will eventually reduce average prices for any single service. What remains to be seen is whether total spending actually will shrink much. As some of you already have discovered, lower prices for linear is balanced by more spending on streaming services.

The point is that aggregate video entertainment spending might not actually drop. In fact, there already is evidence that total video scription spending is growing, looking at both  linear and streaming formats.


According to Federal Communications Commission reports, U.S. cable TV prices climb every year, though arguably not so much higher than the background rate of inflation. Since the cost of goods (programming) is rising much faster than the rate of cable TV increases, service providers are finding operating cost economies elsewhere in the business.


Sports programming costs are one culprit. At around seven percent annual increases, prices double in a decade, so you can see where this is going.

Then there is the Netflix effect, where high spending on original content by internet app firms is forcing all the other competitors to ratchet up their spending as well. In fact, Netflix now spends as much as does Disney, Fox and Warner Media on content, every year.


AI Physical Interfaces Not as Important as Virtual

Microsoft’s dedicated AI key on some keyboards--which opens up access to Microsoft’s Copilot--now is joined by Logitech’s Signature AI mouse...