Monday, December 3, 2018

Long Distance Provides Example of What Will Happen with Subscription Video

What might happen with linear subscription video depends on the popularity of product substitutes and the degree of competition in the market, as was the case for U.S. long distance calling after the breakup of the Bell system in 1985.

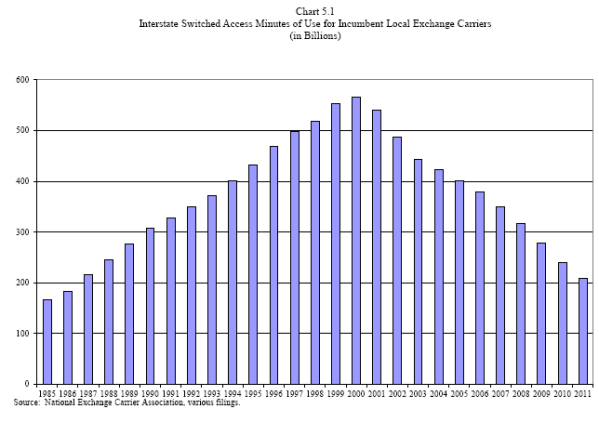
Also, much depends on which the market positions of various providers. The history of long distance calling provides an instructive example. Though competition shifted shares of market for two decades, the arguably bigger change came in 2000, when demand for “long distance” was cannibalized sharply by mobile phone service.


For two decades, though average prices continued to decline, the big change was market share shift. Then, for two decades, the big change was product substitution.

The application to linear video is that competition has been shifting market share for a few decades (first from fixed to satellite; then cable to telco). What we should anticipate in the coming decade is a change of dynamic from market share shifts to product decline and substitution (decline of linear and replacement by streaming alternatives).


The whole point of deregulation is to shift market share from incumbents to challengers. In the U.S. market, regulatory support meant that attackers (the Baby Bells) steadily gained share, while AT&T lost share, from 1985 to about 2000.

Sometimes, though, unforeseen consequences are encountered. Virtually nobody thought long distance would almost disappear, to be replaced by mobility as the industry profit driver.

The long slow decline, when incumbents such as AT&T simply sought to control the pace of decline while trying to create a different business model, held for quite some time. But then a quantum change happened, and the whole market virtually collapsed.


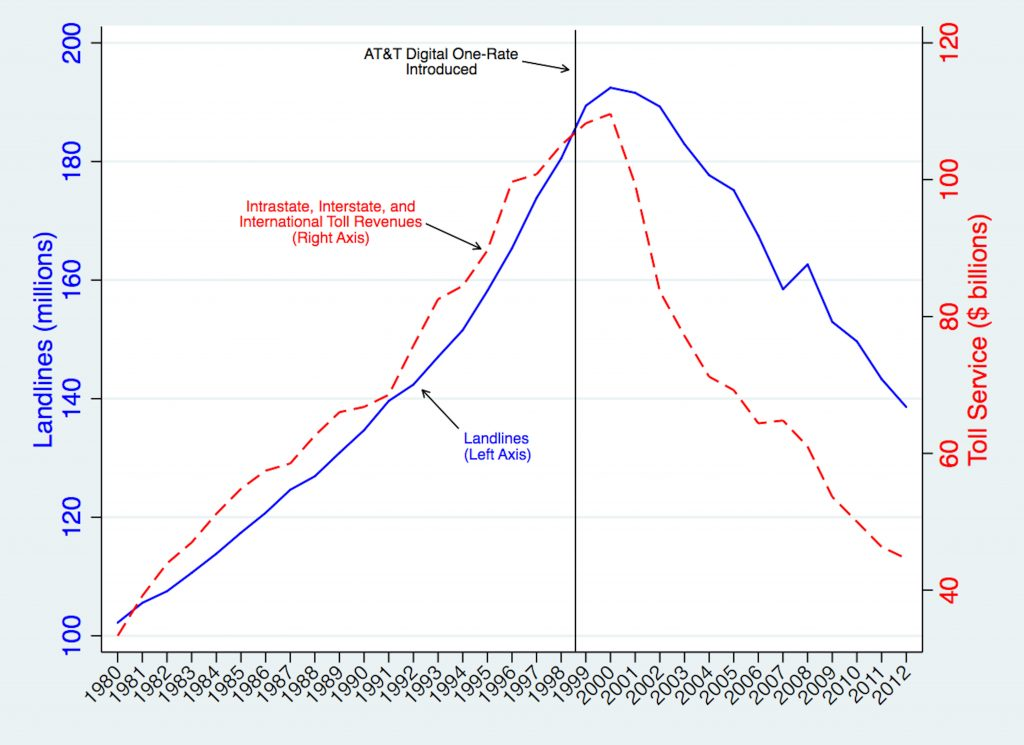
After 2000, all fixed network providers lost share, as demand shifted to mobility, largely because AT&T introduced its Digital One Rate plan, which made domestic long distance calling as affordable as local calling.

The point is that the speed of such changes depend on the degree of regulatory support for challengers; technology shifts and shifts of end user demand.


As applied to the video subscription business, we have reached the equivalent of the 2000 peak of long distance revenues, which implies a long process of declining revenues. Where efforts to gain or protect market share were paramount for a few decades, the new challenge is to create alternative products.

As mobile calling became the substitute for both long distance and local calling, so over-the-top streaming services are destined to replace linear subscription products. There is one crucial difference, however.

It was, relatively speaking, easy to create free and low-cost communication alternatives. Video entertainment has substantial “cost of goods” issues, however, in the form of expensive content rights. It might be true that “bits are bits” where it comes to communication services or apps.

It is never true in the video entertainment business, as content is highly differentiated, as well as expensive.

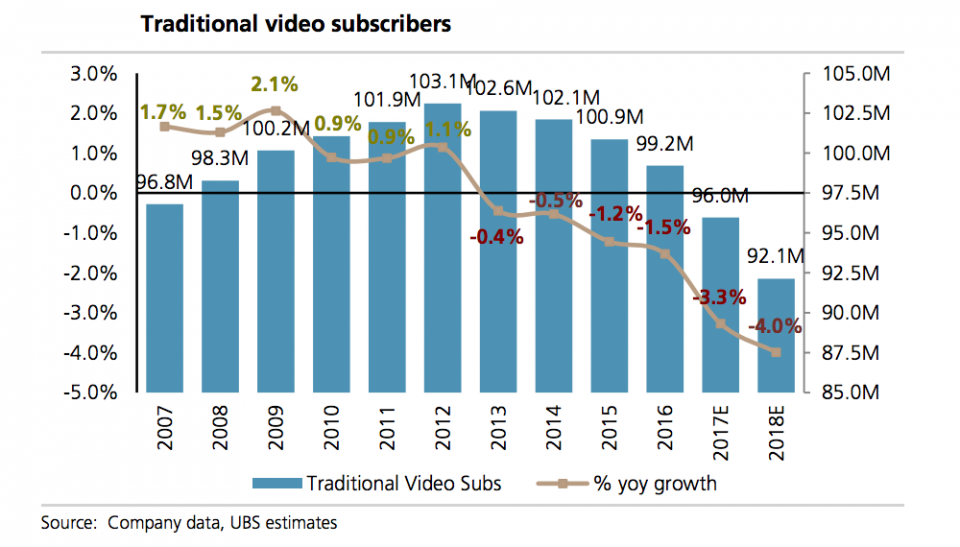
In the first nine months of 2018, some 23 percent of broadband households served by fixed network providers did not subscribe to a linear video service, according to S&P Global Kagan.

Over the first nine months of 2018, 2.8 million fewer linear video subscriptions were sold, with the biggest drops coming in the satellite segment of the distribution business.


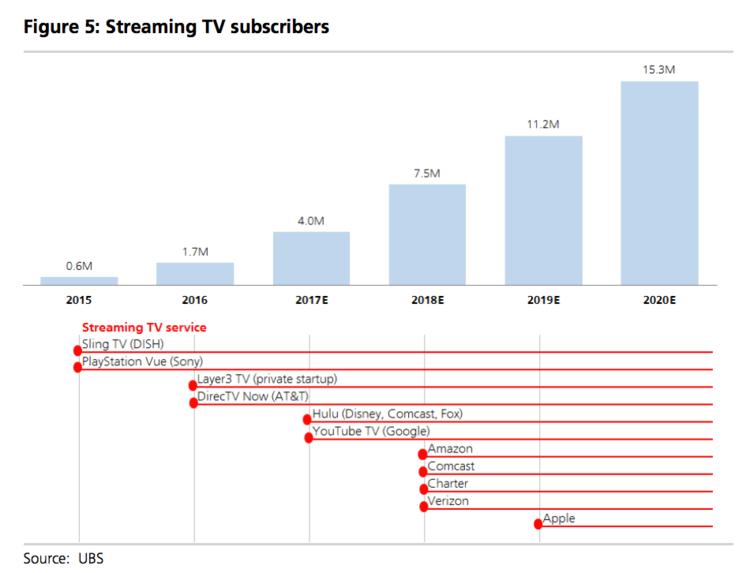
By 2022, analysts at UBS predict, such streaming alternatives will represent 25 percent of all video subscriptions.

UBS projects there will be 9.2 million video streaming subscribers by the end of 2018.  UBS predicts there will be 24 million accounts by the end of 2022.


The new issue is what products will emerge to replace linear video, including streaming services that are optimized for mobile delivery as well as fixed network versions.

SD-WAN Growth Rate 37%

SD-WAN traffic will grow at a CAGR of 37 percent compared to three percent for traditional MPLS-based WAN, Cisco predicts. As a result, SD-WANs will carry 29 percent of WAN traffic by 2022.


CDNs Will Carry 72% of Total Internet Traffic by 2022

Content delivery networks (CDNs) will carry 72 percent of total Internet traffic by 2022, up from 56 percent in 2017, Cisco predicts. That is one indication of the importance edge computing is likely to assume, as most CDNs cache content at the edge of the wide area network.

The other clear trend is that private networks built and operated directly by enterprises such as Google, Amazon, Facebook, and Microsoft will carry a greater percentage of total traffic. In some ways, that trend mirrors the shift of retail applications (consumer and enterprise) away from connectivity providers to loosely-coupled, over the top apps.

At a high level, it can be said that more of the value of any communications-related application, service or process value is moving out of the “connectivity provider” realm. In other words, “becoming a dumb pipe” is but one impact of loosely-coupled app architecture. The other trend is that even the dumb pipe functions are taken directly by big app providers.

One way of measuring the importance of edge computing is to look at the percentage of total network capacity (wide area, metro, region and metro) used to support internet traffic.

Metro capacity is growing faster than core-capacity and will account for 33 percent of total service provider network capacity by 2022, up from 27 percent in 2017.


The obvious implication is that less data will cross WANs than otherwise would be required.


Sunday, December 2, 2018

Will 65% of Customers Buy Gigabit by 2023?

Supply can drive demand, if prices for a desired product are low enough. Rethink Technology Research, for example, estimates 40 percent of consumers are willing to pay a price differential up to US$20 for a gigabit internet access connection, growing to 65 percent of consumers as gigabit becomes a ubiquitous offer.

“We expect Asia to reach 233 million 1-Gbps lines, Europe 59.6 million, the US 37.7 million and Latin America just 10.7 million,” says Rethink Technology Research. “China alone is expected to have 193.5 million.”

Where take rates for gigabit connections in most countries remain in the “three percent to four percent of homes” range, gigabit adoption rates in most countries will grow to to well above 30 percent on average, and in countries such as France, Switzerland and South Korea, more than 50 percent of households will buy gigabit broadband services by 2023, Rethink predicts.

China will improve gigabit subscription rates from four percent of its 456 million households to close to 42 percent, Rethink predicts.


Price matters, though. The general trend is for access speeds to be increased while price remains constant. So the issue is how many consumers will be content with gradually faster speeds for the same price, versus upgrades to the faster speed available.

Service provider strategy also matters. Some ISPs might try selling one speed only (gigabit). Others will prefer a multiple speed tiers strategy. Historically, that strategy has had most consumers opting for the mid-tier offers, rather than the fastest or budget speed tiers.

As speeds climb, and unless new “bandwidth hog” applications become popular (beyond entertainment video), value will remain with the budget and standard tiers of service, one might argue.

Network Slicing Might Shift Value of Networks

Network slicing might ultimately be more important driver of business strategy than many expect, with both potential revenue upside and downside for connectivity providers. The upside is the potential ability to create customized wide area networks with features preserved to the radio edge of the network. In principle, that turns a commodity connection into a value-added platform.

The downside is that network slicing also might be used by enterprises and carriers to further commoditize the value of physical networks. `

Consider this diagram from ETSI, explaining the architecture of network slicing, as used by potential customers of network services. The “tenant” is the customer. The network slice provider is an aggregator of network services.

The network slice agents are the sales agents for any network’s slices. The network infrastructure providers are what we now call telcos or service providers.


It does not take much imagination to predict that some tenants (network service providers, enterprises, app providers, transaction platforms, device providers) can stitch together regional or global networks with assured performance (latency, bandwidth) by buying network slices from many network service providers.

The early analogy is the way Google Fi uses Wi-Fi, Sprint, T-Mobile US and U.S. Cellular networks for access. Where Wi-Fi is available, Google Fi devices default to Wi-Fi. Where not available, devices sense whether Sprint, T-Mobile US or U.S. Cellular have better signal, and default automatically to that network.

In a network slicing environment, a tenant will essentially do the same thing, using network slices to to create a complete network, possibly with performance assurance. Potentially, tenants might also dynamically shift slices, based on any number of potential business rules (cost, quality, bandwidth, congestion).

The bottom line is that the way tenants (enterprises or carriers) build networks could change, in ways that shift value to the integrator of slices, whether that integrator is the enterprise itself or an agent working on behalf of the tenant.

Size of Network Slicing Depends on How We Count It

The network slicing market might be relatively small if one considers the sales volume of network infrastructure, perhaps large if one measures “value” created by network slicing.

It all depends on how one counts. It might be reasonable to predict revenue in the hundreds of millions for the former; billions for the latter.

That is the same problem one faces when comparing the value of goods sold using the internet, and the “value” of the internet, or of various suppliers within the ecosystem.

The adoption of 5G network slicing for manufacturing alone is expected to create a US$32 billion of value, at a CAGR of 96 percent through 2026, according to ABI Research. “The second biggest revenue opportunity lies in the logistics sector, where the market is projected to increase from US$65 million in 2019 to US$20 billion in 2026, at a CAGR of 127 percent. “

Of course, value created for an industry is not the same thing as revenue for service providers. Nor will it be easy to separate out value created specifically by network slicing, from the associated value of mobile access, network transport, cloud computing and other connectivity contributors that play a role in creation of a virtual network using a network slice.

And even when looking specifically at value for a connectivity service provider, there are net revenue, capital investment and operating cost savings to consider. On the revenue side, “net” revenue often will matter when a “network slice” (virtual network service) actually displaces some other amount of current spending by a customer with a given service provider.

In other cases, the impact include higher incremental sales of existing or new products; churn reduction; longer customer lifecycle or other benefits that are harder to quantify.

Better customer experience, faster time to market, simpler resource management or greater flexibility are some of the contributors to value.


Saturday, December 1, 2018

Do You Need Gigabit Internet Access?

Marketing headlines aside, there is relatively little value to be gained, for a typical consumer internet access account, by buying a gigabit internet access service, over an alternative operating at 100 Mbps.

Granted, loading web pages is but one of a number of use cases. But the benefits of “more bandwidth” and “lower latency” show why gigabit internet access actually does not solve as many user experience issues as you might expect.

After about 10 Mbps, page load time does not improve with bandwidth. The one clear exception is any internet access account with multiple users who are using a shared connection at the same time. Then access connection requirements shown here are “per user,” not “per connection.”

Better latency performance arguably has more impact on page load times. That is one reason why 5G is seen as supporting many new ultra-low latency use cases. Design latency is one millisecond for 5G. That noted, 4G latency already is low, at around 10 milliseconds.


AI Physical Interfaces Not as Important as Virtual

Microsoft’s dedicated AI key on some keyboards--which opens up access to Microsoft’s Copilot--now is joined by Logitech’s Signature AI mouse...