Showing posts sorted by date for query Comcast homes passed. Sort by relevance Show all posts

Thursday, January 4, 2018

Fort Collins Colo. to Build Own Gigabit Network

The City of Fort Collins will build its own retail municipal broadband network. The city expects to build the entire network over three to four years.

Target residential pricing is  $50 per month for 50-Mbps service, and $70 per month for 1-Gbps service.

An “affordable Internet” tier also will be offered, the business plan says. The city expects to borrow between $130 million and $150 million to fund network construction and activation.

The city estimates a cost per passed home to be $984, with the cost to connect a customer location at about $600 each.

It is obvious that most of the customers will come from one of the two dominant providers, Comcast and CenturyLink, as more than 91 percent of households already buy a fixed network internet connection.

Comcast has about 57 percent market share, while CenturyLink has about 37 percent share, the city says.

Comcast already has launched gigabit services in Fort Collins, ahead of the municipal network launch.

City consultants estimate the new municipal network could get as much as 30 percent share of market. That is based, in large part, on experience. Other municipal networks have gotten share in about that range.

One caveat is that it is unclear how the other networks measure penetration. One way is to count by connected homes. The other method, where a network offers multiple services, is to count “units sold” and then divide by the number of households.


In such cases, the actual number of connected homes is less than the penetration figures would suggest, as a single home, buying three services, generates three revenue units. When measuring penetration rates, that has the same impact as three homes buying one service.

So some of us would guess that the actual household penetration can range from less than 20 percent to perhaps 35 percent.

Much also will hinge on what Comcast and CenturyLink decide to do to hang on to existing customer accounts.

Comcast’s gigabit pricing originally was set at  $159.95 per month without a contract, and $110 per month with a one-year contract.

But few might predict Comcast is willing to lose huge chunks of market share rather than lower its prices to about $70 a month (or whatever level is needed to remain competitive with the municipal network).

Comcast has offered $70 a month pricing in other markets where it faces serious competition for gigabit internet access.


Some idea of operating costs (exclusive of marketing) can be seen in estimates for personnel.

The larger point is that more competition in the internet access space keeps coming, despite fears of a duopoly and limited consumer benefits. For most potential consumers, the real options are going to be mobile services, though, as 5G services are launched nationwide.

Tuesday, December 12, 2017

More Fixed Network ISP Competition Seems to be Coming

The fixed network internet access duopoly possibly is going to be challenged in new ways over the coming decade. New forms of mobile competition are going to develop, including both direct mobile substitution and mobile-enabled fixed wireless. Also, some new fixed network competitors are likely to enter the markets as well.

At least in principle, more than 100 Colorado communities could see some form of
municipal broadband network created, as voters in those communities have approved such moves. That clears a legal hurdle, but now means each community will grapple with the business model.

Longmont, Colo. already has built out a portion of its planned gigabit internet access network, aided by that city’s ownership of a municipal power utility, meaning Longmont owns rights of way, distribution facilities, rolling stock and other assets helpful to creating a city-wide internet access network.

In Centennial, Colo., private internet service provider Ting Internet will piggyback on a new government network to be built by the city of Centennial itself.    

In a few cases, state funds could play a role, as subsidies for middle-mile trunking can change the business model. Magellan Advisors, for example, identifies several roles cities can take, including streamlining of processing necessary for private ISPs to build or upgrade infrastructure; providing access to city-owned dark fiber; city-owned wholesale capacity services or actual provisioning of municipal services for businesses or consumers.

Risk and capital investment grows assume more active roles, including that of actual service  provider. One point worth making is that adoption rates vary based on the number of services offered, and by the ways adoption is measured.

These days, in competitive consumer markets, penetration is measured in terms of revenue-generating units, not “locations” or “households.” Each unit sold (voice, video or internet access) is counted against the base of locations. So a single location buying three services results counts as much as three other homes buying just one service.

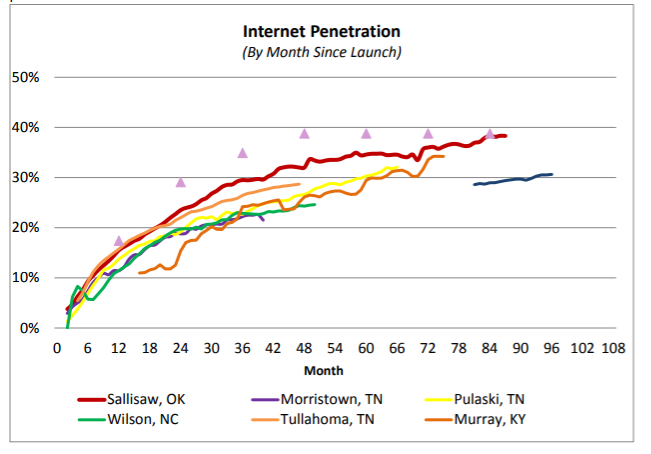
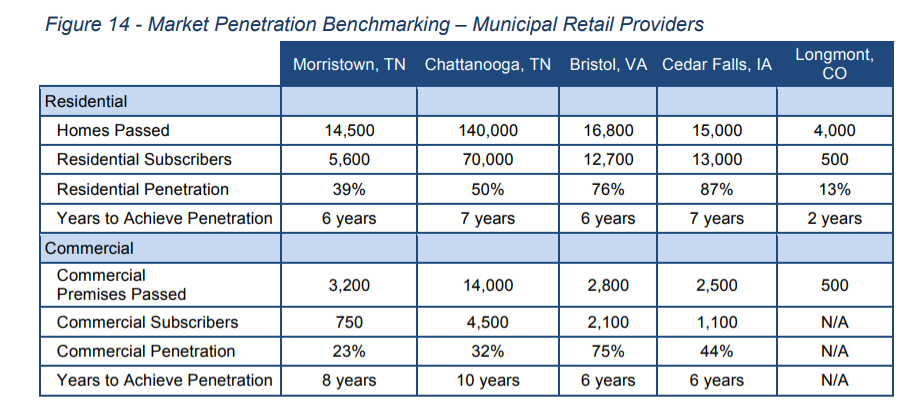
So it is that a number of retail service providers such as Morristown, Tenn.; Chattanooga, Tenn.; Bristol, Va. or Cedar Falls, Iowa seem to have far higher penetration rates than Longmont, Colo.

That is partly because the Longmont network still is being built out, but also reflects the fact that Longmont’s network sells only internet access and voice, but not video entertainment services. The other networks have been in operation and marketing for three times as many years as Longmont.


Customer “penetration” by household therefore is different from penetration measured as a function of units sold. The difference is that determining the magnitude of stranded assets hinges on how many locations passed generate revenue.

Assume that, on average, a typical household buys 66 percent of the total suite of services (two of three triple play services or  three of five services, for example).

The difference is significant. Measuring “penetration” by units sold, penetration appears to be as high as 76 percent to 87 percent. Measured as a function of homes generating revenue, penetration could be as low as nine percent, or as high as 44 percent, with a “typical” value being something between 20 percent to 25 percent of homes passed.

Penetration: Units Sold or Homes Buying Service?

Morristown
Chattanooga
Bristol
Cedar Falls
Longmont
homes passed
14500
140000
16800
15000
4000
subscribers
5600
70000
12700
13000
500
units sold
39%
50%
76%
87%
13%
services sold
3
3
5
3
2
HH buys .66 =
2
2
3
2
1
Homes served
2828
35354
3848
6566
379
penetration
20%
25%
23%
44%
9%

It might be worth pointing out that all these communities (Morristown, Chattanooga, Bristol, Cedar Falls and Longmont) have municipally-owned utility companies, and might therefore represent a sort of best case for retail operations serving consumers.

That seems consistent with other evidence. In markets where a telco and a cable operator are competent, as is the attacking ISP (municipal or private), market share might take a structure of 40-40-20 or so, possibly 50-30-20 in areas where the telco does not have the ability to invest in faster broadband and the cable operator has the largest share.

Beyond the actual cost of the network, and the business role chosen by the municipality, details of revenue generation (homes that generate revenue as a percentage of total; number of services offered) are fundamental.

Beyond that are the other operating and marketing costs, overhead and need for repaying borrowed funds and making interest payments, on the part of the retail service provider.

One might argue that most other communities, without the advantages ownership of an electric utility provides, will often find the lower risk of a shared public-private approach more appealing.

Also, some ISPs might find the availability of some amount of wholesale or shared infrastructure makes a meaningful difference in a business model.

One might suggest there are a couple of potential practical implications. Efforts by incumbent ISPs to raise retail prices in the same way that video entertainment prices have grown (far higher than the rate of overall inflation) will increase the odds new competitors enter a market.

Higher prices, in fact, will increase the likelihood of new entrants entering a market, as the higher prices increase the attractiveness of doing so.

In at least some cases, the new competitors will be firms such as Verizon, which now has announced it will essentially overbuild an AT&T and Comcast markets in Sacramento, Calif.

Though it is not easy, more competitive ISPs are likely to enter more markets, as lower-cost access platforms evolve, helped in some cases by municipal facilities support.

Where that happens, it is conceivable that the incumbents will see a new limitation on their market share, dipping from possibly 50-percent share to a maximum of perhaps 40 percent each, on a long-term basis, assuming the new competitor is not eventually bought out by one of the incumbents.

Friday, February 10, 2017

How Google Fiber and Verizon Fios Face Similar Challenges

In some ways, Google Fiber’s experience with gigabit internet access resembles Verizon’s earlier experience with Fios. Both firms announced aggressive fiber-to-home builds, and both halted those builds before completion of the announced or intended  footprints.

As Google Fiber maintains its construction and marketing of existing gigabit networks, while pausing extension, so did Verizon halt its Fios build before all of its major metro areas were wired.

The business model seems to have been the issue for both firms. Google Fiber has been disappointed with take rates and revenue, while Verizon seems to have discovered the business model did not work as well as expected, either.

Likewise, both firms now believe fixed wireless could substantially improve the business model.

The dynamics of competitive access markets are among the key reasons both firms now think differently about fiber to the home deployment. In the monopoly era, the supplier of access services (voice, for telcos; video entertainment for cable TV companies) could safely assume that, once a network was built, adoption would range from 80 percent to 95 percent.

Broadband Internet
Subscribers
Net Adds


Cable Companies


Share
Comcast
24,316,000
329,000

Charter
22,202,000
387,000

Altice
4,122,000
17,000

Mediacom
1,145,000
17,000

WOW (WideOpenWest)*
728,400
2,700

Cable ONE
510,573
2,256

Other Major Private Company**
4,765,000
20,000

Total Top Cable
57,788,973
774,956
62.49%


Phone Companies


AT&T
15,618,000
-23,000

Verizon
7,038,000
24,000

CenturyLink
5,950,000
-40,000

Frontier^
4,404,000
-99,000

Windstream
1,063,000
-12,800

FairPoint
309,547
-1,893

Cincinnati Bell
299,800
3,100

Total Top Phone Companies
34,682,347
-149,593
37.51%


Total Broadband
92,471,320
625,563


That meant the “cost per customer” and “cost per location” were nearly identical. In simple terms, “build past a home or business, get that location as a customer” was a good rule of thumb.

All that changes in competitive markets. In internet access markets, one firm--typically the cable operator--can expect to get as much as 60 percent take rates, while the telco can expect to get 40 percent take rates.

Video, in fact, is the more competitive market, as there are at least three suppliers in every market, limiting cable operators to about 50 percent adoption, while satellite gets 20 percent share and most telcos get about 20 percent. The salient exception is AT&T, which owns both DirecTV satellite service and also has sold U-verse video services. In some instances (in its largest fixed network areas) AT&T could have as much as 25 percent total video account share.

The obvious implication is that network “cost per potential customer” (cost per passing) and “cost per customer” diverge quite a lot. Cost per passing represents significant stranded investment, when take rates range from less than 20 percent to 50 percent.

Simply, at 20-percent take rates, cost per customer is five times the cost per passing. Even at robust 50-percent take rates, “cost per customer” is double that of “cost per passing.”

Even Verizon, able to sell three anchor services, with 40 percent adoption of internet access and perhaps about the same voice adoption (as a percentage of homes passed), has found the business case for Fios a difficult proposition. That is why its new optical fiber deployments are based on enterprise and mobile backhaul requirements first, to create a relatively dense optical footprint, and then to extend from optical endpoints to potential consumer neighborhoods.

It is doubtful Google Fiber has managed to consistently get 20 percent adoption in most of its markets.

That is why both Verizon and Google Fiber have paused their original fiber-to-home footprints, and why both are seriously moving towards fixed wireless access to provide gigabit internet access.

Pay-TV Providers
Subscribers
Net Adds


Share
Cable Companies


Comcast
22,428,000
32,000

Charter
17,275,000
-37,000

Altice
3,598,000
-41,000

Mediacom
834,000
-8,000

Cable ONE
329,386
-9,588

Other major private company*
4,305,000
-25,000

Total Top Cable
48,769,386
-88,588
52.08%


Satellite TV Companies (DBS)


DirecTV
20,777,000
323,000
22.19%
DISH**
13,643,000
-116,000

Total DBS
34,420,000
207,000
36.75%


Phone Companies


Verizon FiOS
4,673,000
36,000

AT&T U-verse
4,544,000
-325,000
4.85%
Frontier^
1,245,000
-85,000

Total Top Phone
10,462,000
-374,000
11.17%


Total Top Pay-TV Providers
93,651,386
-255,588


Why Marginal Cost of Content Creation is Generative AI's Superpower

Virtually every observer might agree that artificial intelligence will automate laborious tasks and therefore increase process efficiency. A...