Thursday, December 1, 2022

"Access" Remains 80% of Total Connectivity Network Cost

Terrestrial connectivity networks always require as much as 80 percent of total invested capital in the access portion of the network, not the long haul or other facilities. For mobile operators and internet service providers, nearly all the capital cost lies in the access network (exclusive of spectrum investments, which would skew the ratio even further in the direction of access as the cost driver). 


The same holds true for operating costs, where perhaps 85 percent of total operating costs lies in the access network. 


Some focus only on WAN costs and interconnection, especially when arguing that “ISP prices are too high,” but the real costs for any ISP lie in the access network. Cost per gigabyte of transferred data might be low, but that is a relatively insignificant cost of doing business for ISPs operating in denser markets. 


As always, interconnection and other transport costs are a higher cost item for ISPs in rural areas, with low subscriber density and distance from the nearest internet onramp (interconnection) point. 


That also appears to be the case for energy consumption, as most of the active devices operate in the access plant. A 4G or 5G network, for example, might consume 73 percent of total energy in the radio access network. 


The wide area core network might consume about 13 percent of total energy, while data centers and servers might consume nine percent of total energy. 

source: ENEA 


The broader observation is that access is the expensive part of a connectivity network, whether looking at capital investment or operating expense.


Tuesday, November 29, 2022

When Price Comparison Shopping Rules, So Do Hidden Fees

Though sellers have good reasons for using hidden fees, customers generally dislike the, since total price is greater than top-line advertised price.  Though annoying for buyers, there are reasons for such tactics. 


In competitive markets where price comparison engines operate,  price obviously is among the key differentiators. Where search engines rank products by price, it always makes sense to advertise the lowest-possible retail price, if competitors do so. 


Mandating all-inclusive pricing by government edict is one way of improving transparency while not putting any single supplier at a disadvantage. 


In the absence of such mandates,  “below the line” price add-ons are simply a requirement for sales processes highly dependent on automated search mechanisms. Buyers may not like it, but so long as price comparison engines get used, lead price matters. Advertised prices always have mattered, but arguably matter more now that price comparisons made online are such an important part of consumer buying behavior. 


In fact, such additional fees have represented as much as a quarter of total costs for some bundled-service packages in recent years (video plus internet access, for example). Equipment rental charges or other “cost recovery” fees often are included in total recurring prices. 


source: Consumer Reports 


One might think it irrational for firms to willingly compete on such a basis, but there is upside to balance price pressure downside: greater reach. Allowing price comparison engines to use retail pricing data does lead to price competition. But it also provides any single retailer greater prospect reach. As always, top competitors want to be available at retail where the top rivals also are present.   


Of course, service providers often levy fees of various types, below the line, for precisely the same reason. We might disagree with the practice, or the reasons for the fees, but suppliers are responding to the implications of price increases in an era when price discovery is easier than ever. Add-on fees are an “easy” way to maintain to-line posted prices while actually increasing them. 


When inflation exists, prices must be raised, since input prices climb. Consumers rarely claim to “like” their video providers or the many additional fees they see on their bills. But “broadcast TV” fees are a reflection of the rising prices video distributors must pay station owners for the right to carry their programing. 


The same logic applies to sports programming costs that keep rising annually as well. Since 1983, for example, the cost to carry National Football League programming has increased at an eight percent compound annual growth rate. Subscription TV suppliers are distributors: they do not generally own the content they bundle for their customers. So when those costs rise, they must be passed on to customers, just as energy and transportation, storage or marketing costs must ultimately be passed on to customers. 


Few--if any--businesses could survive eight-percent annual cost increases for an essential input to their retail products without adjusting prices.


Sunday, November 27, 2022

Digital Infra is Anything but Supercore

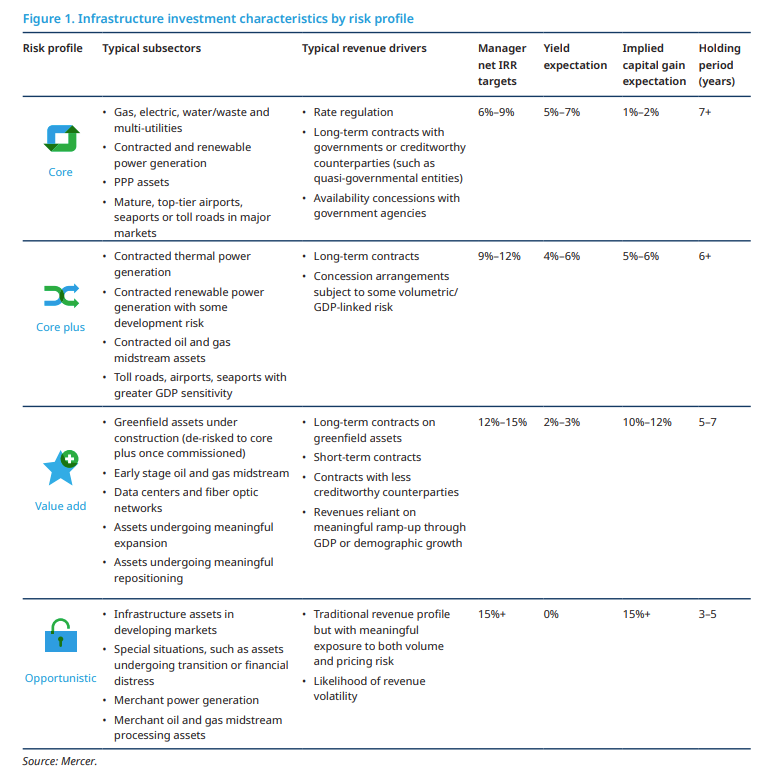
Digital infrastructure investing, like alternative asset investing generally, now has moved to embrace core plus concepts. The nomenclature comes from the traditional real estate investment concepts used by buyers of alternative assets. 


Some might say “core” assets are akin to Class A office buildings, which are the most prestigious in a city. Class B buildings might be those which offer fewer prestige value than class A, and might be located outside a downtown core area. Class C buildings will tend to be aimed at more industrial or service oriented businesses and smaller businesses. 

source: Bullpen


It might be more accurate to characterize the different classes of assets by risk and return profiles, as there is less the notion of “prestige” as in office space, and more the fact that digital infra is a newer class of alternative or real estate assets, albeit with generally higher exposure to economic cycles and less business moat protection. 


As the range of infrastructure assets has grown, some now see more gradations of risk, adding “supercore” as a category of regulated assets, to distinguish between other assets that are not formally rate or price regulated. 


By definition, digital infra assets would not be considered supercore, as data center, cell tower, fiber network and other “telecom” network assets are unregulated in terms of pricing and do not offer guaranteed rates of return. 


In a private equity or other institutional investment context, “core” infrastructure  has meant gas or electricity utilities that have business moats, offer predictive cash flow and are relatively resistant to economic fluctuations. These businesses also tend to be rate regulated, with low capital appreciation, longer asset holding cycles and lower yield. 


That profile fits requirements of large pension funds and other institutional investors including sovereign wealth funds, for example. 


“Core plus” adds new classes of assets such as airports, seaports, roads that have more exposure to economic cycles but higher capital gain potential, balanced by potentially less predictable cash flow. 


Data centers, specialized fiber networks, edge computing facilities, fiber-to-home networks, towers and hosting facilities are considered “value add” assets. Capital gain potential is higher, assets holding periods might be shorter and yield is expected to be  lower. 


“Opportunistic” assets might be digital infra in developing markets or  distressed assets. 
source: Mercer


Yet others will use a related taxonomy using “super core” (core); core (what others might call core plus) and core plus (what others might call value add). 


As always, people will disagree about the boundaries between asset classes or the placement of specific assets within a class. Some argue that “core” infrastructure includes assets which are primarily income-producing. That view groups toll roads, bridges and hospitals in the same grouping with gas and electrical utilities. 


Also, some now view “core infrastructure” as including mobile towers, cloud storage and data centers. In that typology, some would say core plus/value add is a different category. 


The classification scheme matters to the extent that it guides investment thinking about what is core and what is “core plus'' or “value add.” 


The obvious areas of disagreement are that some assets viewed as “core plus” by some will be considered “core” by others. In a digital infra context, that means deciding whether data centers, tower networks and fiber access networks are “core” or “core plus.” 


The same definitional issue is whether those sorts of assets are “core plus” or “value add.” Perhaps nobody is going to confuse those categories with “opportunistic” investments which involve some level of asset distress or uncertainty. 


Digital infra, as viewed by many, has become an “essential” sort of infrastructure akin to roads, airports, seaports, electricity and natural gas supply. If so, then cell towers, fiber networks and data centers are “core” assets. So “core plus” and “value add” are the adjacencies to be explored, aside from the occasional “opportunistic” play.  


As a practical matter, digital infra investors tend to view those assets as core. Historically, infrastructure investors have looked for investments that:

  • are real, capex-intensive assets 

  • are essential services 

  • offer steady and stable returns

  • Are economic cycle protected 

  • provide cash yields

  • have barriers to entry

  • are typically within energy, telecom or transport.


Most observers would likely agree that “core plus” means any additional new asset classes or assets with less utility-like characteristics. That might mean assets with shorter-term contracts, no rate regulation and some exposure to economic cycles, though generally regarded as “essential” facilities and functions. 


With the emergence of “supercore” asset baskets that consist exclusively of assets with regulated pricing, it seems logical to include data centers, tower networks, edge computing facilities or fiber networks as “core.”


Friday, November 25, 2022

Correlation is Not "Causation"

All economic benefit forecasts hinge on the assumptions made about the correlation between some investment and expected outcomes. 


But few--if any-- studies actually claim a causal relationship between home broadband and economic outcomes. Generally, less direct descriptions are made. Broadband is said to have effects on economic growth rates, for example. Broadband is said to influence economic growth.  


Or faster broadband, such as 5G, is said to provide economic benefits as well as social outcomes. We might agree that broadband has “effects, influence or provide benefits of various types. 


We might agree that quality broadband tends to be associated with higher or faster economic growth. But that is correlation, not causation. Consumer purchasing of faster-speed broadband is associated with higher incomes, higher levels of education and wealth, for example. But nobody claims broadband “caused” higher income, education levels or wealth and income. They tend to be associated. 


Such correlation is often cited as “causation,” but economists rarely are so direct, though some might have made such claims. 


“High levels of broadband adoption are (arguably) causally associated with higher incomes,” says one study. Note the wording: even a correlation between broadband and higher incomes is only “casually associated.” No claim of causality is made. 


“Our analysis indicates a positive relationship between broadband expansion and economic growth,” says another study. “Although the evidence leans in the direction of a causal relationship, the data and methods do not definitively indicate that broadband caused this economic growth,” the study concludes. 


Likewise, home broadband or internet access is claimed to boost productivity, or is at least said to be correlated with such gains. The issue there is a broader difficulty measuring knowledge worker or office worker productivity, not simply the assumed impact of broadband. 


It is one matter to argue home broadband or faster broadband provides benefits. It is another matter to argue that the faster speed “causes” outcomes. Again, correlation is not “causation.” 

Thursday, November 24, 2022

Predictions for 2023 are Predictable

It is the time of year when analysts make predictions about what comes next in the new year. It might be correct to say such predictions are mostly what we already know, and can extrapolate and foresee. It is the black swans we most want to know about, but, by definition, we cannot foresee such disruptions.

As always in the computing or connectivity business, most of the trends are extrapolations from what happened this year. In businesses as capital intensive and scale-dependent as computing and connectivity, very little that moves the revenue, products or operations volume needles can be started or finished in only a year. 

Consumer price hikes might trigger regulator attention while service providers continue to seek cost cuts. Investment in 5G will continue, as will efforts to align connectivity with higher-bandwidth, low-latency xReality applications and use cases, Analysys Mason suggests.


Some service providers will continue to push into and operate in adjacent areas of the internet ecosystem, such as content and banking. Service providers will make additional efforts to ensure their services support enterprise multi-cloud strategies. 


In the broader technology industry, much the same is true: if a trend was important in 2022, it will be important in 2023. In the connectivity realms, premises networking such as Wi-Fi, 5G rollouts and commercial deployment of low earth orbit satellite constellations will be top of mind. 


source: Zdnet 


Other current trends, such as attention to extended reality use cases, applied artificial reality and machine learning will continue. Effort to reduce energy consumption will continue as well. 


While some might add perspective on sales trends for digital infrastructure, private equity interest in digital infra assets or the possible impact of recession on consumer behavior--most observers probably noting some possibility of slowdowns for such reasons--the underlying trends will remain intact. 


Personally, I am always more interested in all the things that will happen that nobody really predicted. But, of course, we cannot predict such occurrences. 

Tuesday, November 22, 2022

Higher Interest Rates Should Slow Digital Infra Investing

If interest rates remain high, or climb, for an extended period, transactions in the digital infrastructure space are going to slow down, since many deals are financed using borrowed money. The only issue is “how much will the deal flow slow?” 


The other issue is “how long will higher interest rates prevail?” Lower interest rates enable more transactions. 


Since the beginning of 2022, the private equity industry has finalized 92 data center transactions representing  $41.5 billion in deal value,, according to PitchBook data through August 25. 


Global Switch, which manages 13 data centers across Europe and Asia-Pacific, appears ready to join that list. According to Bloomberg, EQT, KKR and PAG are the final bidders for that asset. 


The $15 billion take-private of CyrusOne by KKR and Global Infrastructure Partners is by far the largest PE-backed data center deal this year.


Separately, Time dotCom has said it will sell part of its data center business to DigitalBridge. The sale of AIMS Data Centre appears to be part of a bigger expansion effort in Southeast Asia in conjunction with DigtalBridge. 


Between 2015 and 2018, private equity provided 42 percent of deal value in the data center sector, according to Synergy. Between 2019 and 2021 private equity share of the total deal value rose to 65 percent. 


In the first half of 2022, private equity deal reached more than 90 percent, according to Synergy analysts. 


But higher interest rates  should slow the pace of dealmaking, since debt is used to finance the deals, and debt is becoming more expensive. 


The longer term issue is exit strategy. Virtually all private equity assets are sold over a period ranging up to six years or so. So who are the eventual buyers? Public companies who prefer to operate businesses longer term, institutional investors with a longer time horizon or some strategic buyers, in some cases. 


Two decades, the quip often made was  that a software startups exit strategy was “we sell to Google.” In principle, hyperscalers could be buyers, though it seems more likely they also could be anchor tenants in markets where leasing makes more sense than building or buying. 


Monday, November 21, 2022

More Hybrid Digital Infra Coming?

Virgin Media O2 has begun construction of the XGS-PON network that will replace its hybrid fiber coax network. The move is perhaps notable for a few reasons. It is one of the world’s largest cable companies to adopt FTTH when expanding service beyond its current footprint. 


Some might see the move as a swap of FTTH for HFC. That is not the case. Virgin Media O2 is staying with HFC where it already is operating networks. 


But it will use FTTH to build a new wholesale FTTH network in areas it does not presently serve. In those areas, Virgin Media O2 will be an anchor tenant on a wholesale network half owned by InfraVia Capital Partners. 


Liberty Global and Telefónica will share ownership of half the venture. The new wholesale facilities will serve up to seven million premises that will not overlap with VMO2’s existing network. 


The new move is a continuation of the hybrid philosophy: both HFC and FTTH; copper and optical media; facilities-based competition but also facilities sharing; network ownership versus wholesale. 


As the cost of continually upgrading access facilities--mobile or fixed--continues to climb, there are likely to be additional efforts to “go hybrid,” and rethink the value of owned and leased capabilities. 


Traditionally, network ownership has been seen as a source of competitive value. Expensive access facilities provide business moats. These days, the capital investment required in a competitive setting increases the amount of risk for investing in fully-owned facilities. 


In markets where competition means a reduction in potential revenue by 40 percent or more (two facilities-based contestants), or in markets where a single wholesale network is available to all contestants, the value of facilities ownership is diminished. 


A monopoly provider might reasonably expect to get take rates close to 95 percent or more. Two competent facilities-based contestants will tend to split the market, each getting 40 percent to 50 percent of the installed base. Share in wholesale-based markets will be even more dispersed. 


Under those conditions, even if ownership confers some advantages, the magnitude of the advantage diminishes rapidly when two or more facilities-based providers compete. 


In the decades to come we might see even more of a shift to “facilities light” forms of competition, as service providers tweak their business models to protect profit margins. Along the way, new perceptions of what drives the highest value might develop. 


Already, the traditional business value of facilities ownership seems to be lessening.


DIY and Licensed GenAI Patterns Will Continue

As always with software, firms are going to opt for a mix of "do it yourself" owned technology and licensed third party offerings....