The mobile and telecom industries have rarely been good at predicting the actual "new product" value of each next-generation mobile network. The switch to 2G, the first digital platform, was seen as increasing the efficiency of spectrum use; improving voice reliability; enhancing security and increasing capacity.
The use of Signaling System 7 also allowed sending of control data “out of band” (separately from the voice channel) to manage the network. Aside from security advantages, that also provided faster call set up and tear down.
SS7 supports a wide range of then-advanced telecommunication services, such as call forwarding, caller ID, call waiting, and short message service (SMS or text messages). It is reasonable to say that telco executives primarily expected operating efficiencies from SS7, as well as the ability to embed voice handling features in the network.
To be sure, some “new products and capabilities” were anticipated for 3G and 4G, ranging from mobile internet access in 3G to video entertainment and video conferencing (3G and 4G). But many more-exotic use cases failed to develop. In fact, many would attribute the one-time leadership of smartphones by BlackBerry devices and Research in Motion as an example of the role of email value.
In fact, some might argue that mobile e-mail was a more salient outcome of 3G than “web access,” which remained painfully slow on 3G networks. Likewise, some might argue that “turn by turn” navigation apps were a clearer “new use case” for 4G, early on, than video conferencing or video entertainment.
Later 4G development of ride sharing apps is an example of a new use case not envisioned by 4G architects.
The point is that we are not very good at predicting what new use cases, revenue drivers and value users will see in each next-generation network, beyond an order of magnitude increase in bandwidth and a similar improvement in latency performance (which most users will not be able to identify).
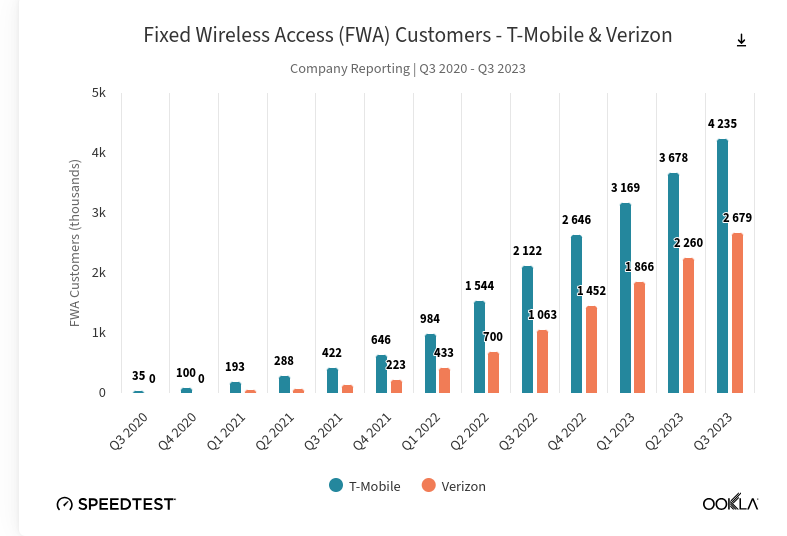
Likewise, virtually nobody predicted that fixed wireless would be the first “at scale” new revenue opportunity 5G enabled.
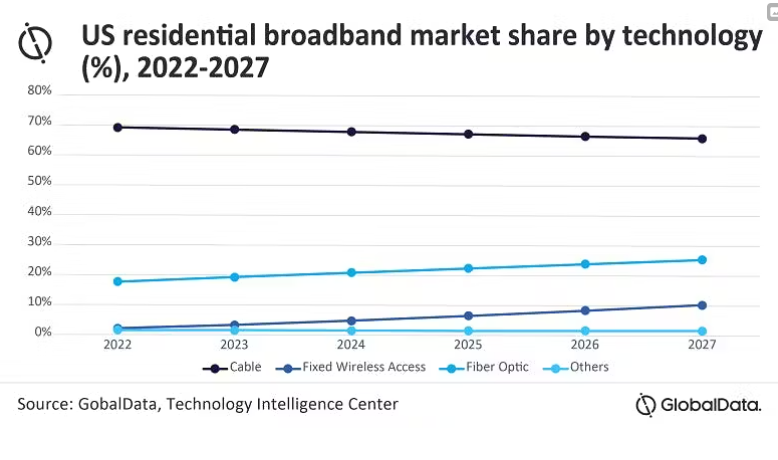
Despite the fact that fixed wireless was hardly ever mentioned as among the new features and capabilities 5G would bring, it has, so far, proven to be the best example of a new use case that generates significant new revenue for mobile service providers selling it. Over the past few years fixed wireless has generated virtually all the net new home broadband connections in the U.S. market, for example.
Some might point to consumer dissatisfaction with cable-provided home broadband as one reason for the growing adoption of fixed wireless, where the value proposition might well turn on lower prices rather than an increase in speeds, in some cases, while being based on higher speeds and lower prices in other cases.
The former might be the driver in urban areas where fixed wireless provides lower prices; the latter the driver in rural areas, where fixed wireless might actually be faster than DSL but also less costly than cable.
The point is that the value proposition in urban areas is “good enough” speed and lower price; while in rural areas the value proposition might be “faster speed, lower price.”
J.D. Power surveys actually suggest that fixed wireless consumer satisfaction are comparable to optical fiber and cable home broadband, and actually higher than satisfaction with fiber-to-home services. By definition, that means the value proposition for fixed wireless is based on price and speed, as FTTH always is much faster.
Price seems important. “T-Mobile’s current FWA (fixed wireless access) plan retails for $50/month, but that falls to $30/month for customers subscribing to its Magenta MAX mobile plan,” analysts at Ookla say. “Verizon prices at a slight premium to T-Mobile, with its FWA service currently retailing for $60/month, but falling to $35/month with select 5G mobile plans.”
Speed might be less important in urban areas, but perhaps more important in rural areas. The median download speed across the United States for all fixed providers combined in the third quarter of 2023 was 207.42 Mbps, Ookla says. The median speeds for Verizon and T-Mobile fixed wireless was 122 Mbps, Ookla notes.
And though fixed wireless has traditionally been viewed as an attractive platform in rural areas, 5G home broadband gains are driven by consumers in urban markets. Both T-Mobile and Verizon are getting 80 percent of their gross additions in urban locations, Ookla says.
Among the key takeaways from 5G home broadband is that the value proposition--as always--is a mix of drivers, including both speed and price. Consumers seem willing to accept less of the former to get more of the latter.
If the success of 5G home broadband shows anything, it is that the consumer estimation of home broadband value can change when a new value proposition is available (faster speed and lower price).
According to Nerdwallet, the most-popular home broadband service plans in 2023 cost $41.31 per month for 104 Mbps in the downstream direction. According to OpenVault, in the first quarter of 2024 about 33 percent of U.S. home broadband customers purchased service plans operating between 200 Mbps and 400 Mbps. Some 11 percent purchased service plans operating between 100 Mbps and 200 Mbps.
The download speed provided in this top-selling category was 104 Mbps.