Showing posts sorted by relevance for query Any Revenue Growth for Telecom in 2020?. Sort by date Show all posts

Thursday, December 2, 2021

As Important as Edge Computing, IoT and Security Are, ARPU Increases and Account Growth Will Drive Service Provider Business Revenue

Most “new source of revenue” growth opportunities available to fixed and mobile service providers are incrementally important. Very few are expected to produce huge amounts of revenue in the near term.


On the other hand, most of the revenue volume will come from tweaks to the existing revenue model (consumer phone service). Perhaps surprisingly, 5G fixed wireless could be one of the biggest near-term contributors to new service revenue. 


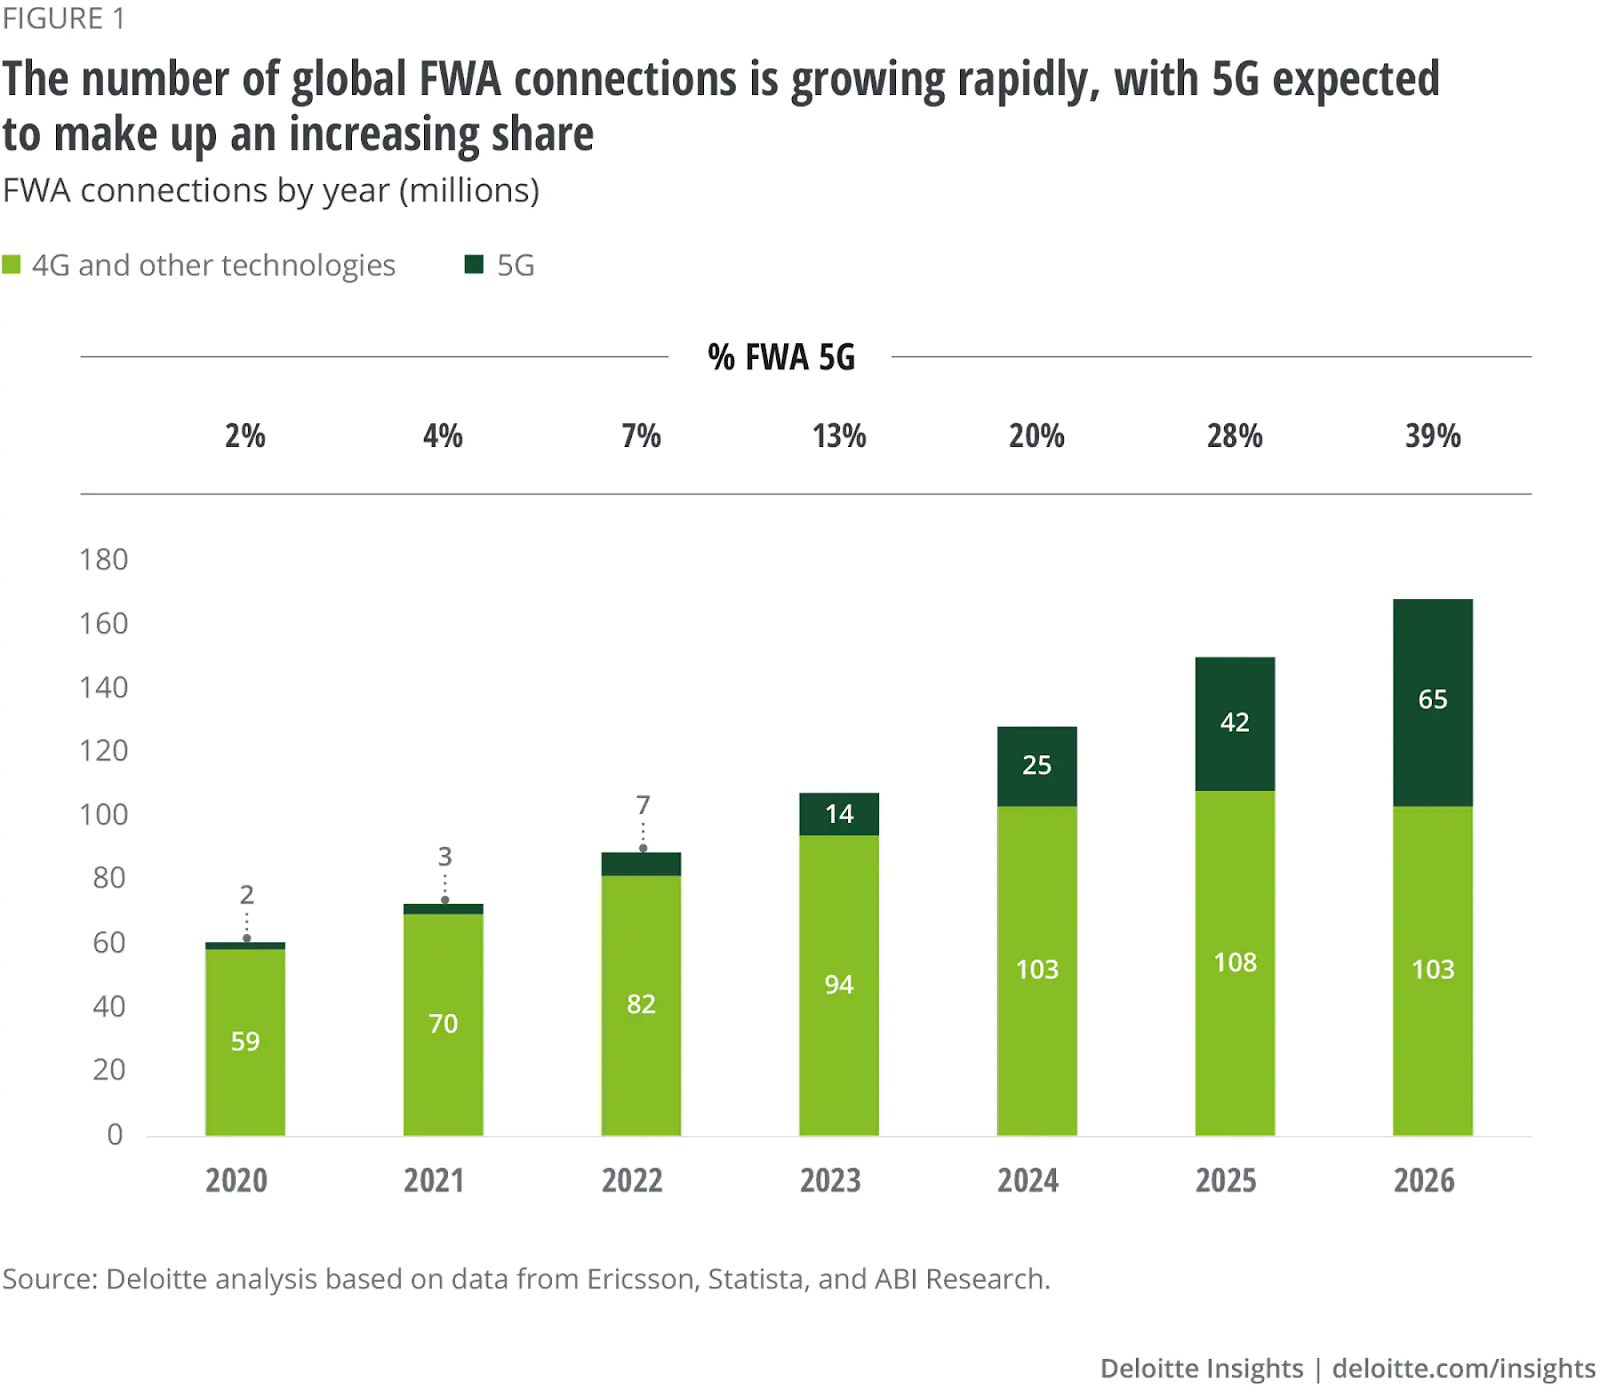
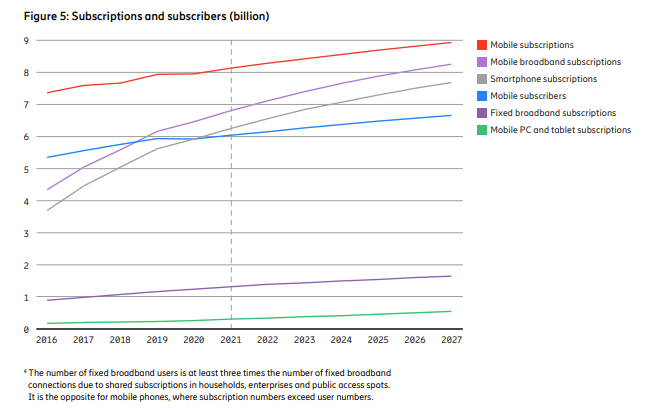
Deloitte Global predicts that the number of FWA connections will grow from about 60 million in 2020 to roughly 88 million in 2022, with 5G FWA representing almost seven percent of the total. Most of the installed base consists of 4G connections and it will take some time for 5G to overtake 4G. 


By 2026 there could be 160 million FWA accounts in service. At an average monthly cost of $20, that generates perhaps $38.4 billion in service revenue. At $40 per month, FWA generates perhaps $76.8 billion in service revenue. 


The total fixed network broadband installed base is expected to be about 1.75 billion accounts in 2027. So FWA will represent about nine percent of total fixed network broadband accounts. 

source: Ericsson 


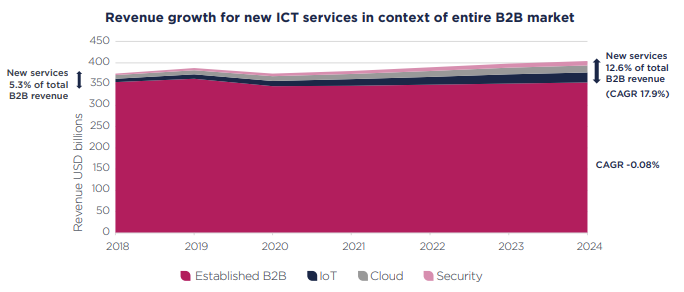
Compare that with projected revenues from other more-touted services such as internet of things, edge computing and security. Those three services will in 2024 amount to about 12.6 percent of total business service revenue of $400 billion globally. 


So security services, IoT and edge computing combined will amount to about $50 billion in annual revenues by 2024. If cumulative growth rate for those services is 17.9 percent, then 2026 revenue might be about $70 billion globally. 

source: IN Forum 


If global telecom service revenue is about $1.6 trillion in 2025, and consumer revenues are about 65 percent of total service provider revenues, then business revenues could hit $560 billion in about 2025 or 2026. 


If you assume consumer services in 2025 or so will be about 60 percent of total revenues, then business revenues could be as high as $640 million. 


How much of that could come from new sources such as edge computing, security and IoT is the issue. If those new sources are 12.6 percent of total business revenues, then existing business services will represent 87 percent of total revenue, or anywhere from $330 billion up to $556 billion.


In other words, improving revenue from existing services still drives most of the possible business revenue improvement. 


It is possible that fixed wireless access is a bigger business than edge computing, security and IoT in 2026. At the low end of the FWA estimates, fixed wireless might still be bigger than any of the other new services individually. 


The point is that we tend to overlook the new revenue impact of FWA, focusing on the more-touted areas of security, IoT or edge computing. But FWA is possibly going  to be a bigger revenue contributor. 


While fixed wireless will grow about 19 percent per year to 2026,  5G FWA connections will grow at an annual cumulative growth rate of nearly 88 percent, over the same period, Deloitte Global says. 


source: Deloitte Global 


source: IN Forum 


source: IN Forum 


source: IN Forum 


source: IN Forum


Monday, November 25, 2013

How Will Service Providers Find Investment Capital When Revenues are Falling?

European service provider revenues from fixed network services across Europe will decrease at an overall rate of around two percent a year through 2020, while mobile service provider revenues decrease 1.5 percent per year through 2020, analysts at A.T. Kearney have forecast.

The decline in European  fixed telephony revenues accelerated in 2012 (-8.3 percent in 2011 and –31 percent over the last five years), driven in part by a negative five percent growth of fixed lines in service, according to European Telecommunications Network Operators association.

Since 2005, fixed line subscribership is down 22 percent.  The bad news is that mobile revenues, long the driver of industry growth, also are declining (-0.6 percent), according to ETNO.

That poses a problem for service providers as they contemplate investments in next generation networks built to supply very high speed Internet access connections.

The reason is that it is difficult to increase capital investment in any business when gross revenue is falling. The more typical strategy, in such cases, is to harvest the declining business, when possible, saving scarce capital for investment in new and growing lines of business.

To be sure, telecom executives already are working to boost revenue and reduce cost. But the combined effect of revenue, operating cost and capital investment  reductions would still result in a decrease in the European telecom sector’s free cash flow from €44 billion in 2011 to just €23 billion by 2020, A.T. Kearney analysts also project.

That makes heavy new investments problematic, as necessary as they might be.

By some estimates, it will cost as miuch as 200 billion euros to upgrade all European fixed networks for Internet access at 100 Mbps. That would be tough to do if free cash flow is but €23 billion.

The latest estimate from the European Telecom Network Operators association suggests telecom service revenue will decrease by close to three percent in 2013 among major European countries, representing a drop of about €7.1 billion.

Across Europe as a whole Etno estimates that revenues will decrease by 3.7 per cent in 2013, twice the decline in 2012.

In 2012, total capital expenditure across the industry reached €46 billion, of which €26 billion was invested in fixed networks and €20 billion in mobile, according to Idate, which also has forecast potential costs of upgrading European fixed networks as high as €229 billion.

The problem is that, as a rule of thumb, fixed network service providers invest no more than about 17 percent of revenues in capital investment every year, according to Infonetics Research.

Some might argue that network capital investment in many markets is far lower than that, representing single-digit percentage of revenue spent every year in all forms of capital investment.

The problem is that at €23 billion free cash flow, all of Europe’s fixed network operators collectively would not be able to spend much more than about $4 billion a year to upgrade their networks. At that rate, it would quite a long time to rebuild European fixed networks to support gigabit speeds.


Friday, January 28, 2022

Google Invests in Airtel: Why?

Google’s new $700 million investment in Airtel, with up to $300 million to follow over five years, is part of an initiative by Airtel to reduce the cost of Android devices in the Indian market. The deal includes a 1.2 percent ownership stake in Airtel. 


But that is not the first investment Google has taken in an India mobile operator Google in 2020 invested $4.5 billion for a 7.73 percent stake in Reliance Jio Platforms. 


Separately, Facebook invested $5.7 billion in Reliance Jio Platforms in 2020. 


In part, such investments can be driven by multiple different values. Securing market entry in a key new growth area is one reason for such hyperscale app provider investments in mobile service providers. Protection from overzealous regulation is another possible benefit. 


source: Mint 


Seizing early market share leadership and user base when there are rivals is another obvious value. To the extent that hyperscalers benefit from ingesting more data, that is another value. 


Such investments in mobile and other connectivity firms are not primarily driven by the desire to replace connectivity providers in the ecosystem. 


On the other hand, it is  hard to avoid noting that two hyperscale app providers are owners of stakes in India’s largest mobile services provider, while Google now becomes a stakeholder in India’s second-largest mobile operator. 


In other cases Google has worked with mobile operators to seek ways to reduce infrastructure costs, as the Telecom Infra Project is doing. TIP seeks to  “accelerate the development and deployment of open, disaggregated, and standards-based technology solutions” that deliver high-quality connectivity. 


As a clear byproduct, TIP expects costs of infrastructure to drop. 


Keep in mind the firm and ecosystem role advantages. Looking only at the internet of things value chain, suppliers of platforms and applications depend on the connectivity function to create their business models. In other words, Facebook and Google benefit from universal, high-quality broadband. Their businesses actually require that affordable, high-quality internet access be as widespread as possible, everywhere in the world. 


source: IoT Global Network 


Instead of a value chain, think of the concept of layers as incorporated in the Open Systems Interconnection model or TCP/IP. By design, applications can run independently of the ownership of networks. The modular design means different suppliers, vendors or entities can operate at each layer, independently of ownership. 


source: Medium 


Unlike the older “closed” model of telecom, where every app on a network was either directly owned by the infrastructure owner or operated with its permission, the layers model separates each layer. 


That creates the business model we call “over the top,” where any lawful applications can be used by any person or machine without the permission of the internet access provider. 


But layers also dictate possible business models. OTT exists precisely because any lawful app can be used by any user on any network. The bundled or closed approach to creating and using applications or platforms is replaced by an open and disaggregated model.


That has profound implications. Hyperscale app or platform suppliers benefit from universal, affordable, quality internet access. Anything that increases the ability to access the internet (such as home broadband, Wi-Fi, mobility networks, satellite and fixed wireless networks) is the foundation for app provider revenue models.  


Hence their interest in ensuring that internet access is easier to deploy, everywhere, at lower costs, since lower costs mean “everyone” can use the internet. 


Conversely, the same drivers operate almost in the opposite way for connectivity providers, in some ways. The business objective of driving down internet access costs obviously limits connectivity provider gross revenues and profit margins. 


For a hyperscale or any other app or platform provider, internet access is a cost of doing business. So there is an incentive to promote lower input costs. For a connectivity provider, the access is the business, so there is an incentive to raise prices when possible. 


On the other hand, TIP, for example, aims to help lower infrastructure costs by creating open approaches to infrastructure that lead to lower costs, as functions are disaggregated and designed according to open standards any supplier can build upon. 


Investing in important, fast-growing access providers sometimes is strategic when a big new market is opening and early scale is desired. But there are other potential benefits, such as deflecting regulatory opposition or gaining mobile operator marketing push. 


That explains why Facebook and Google made their investments.


But it also is worth noting that hyperscale application and platform providers now also operate as forces to reduce infrastructure costs in ways that are helpful to connectivity providers. 


In one sense, among the changes is a shift from supplier-driven technology development to connectivity-provider led development. 


We may see other forms of connectivity role encroachment over time. At least some of that activity is a logical drive by an ecosystem participant to lower the costs of an essential business input, while increasing the revenue opportunity it can chase.


Saturday, January 2, 2016

What is Happening to Revenue, Profit in the Access Business?

The state of the global telecommunications business, even the U.S. telecom market, or any of the industry segments, is hard to explain in a single number, or even a time series.

At one level, it is easy to point to continual growth. In fact, it would be hard to find a single year where aggregate revenue failed to grow, globally or in any single country.

But what that growth means for various providers, and different product segments, often is a different matter altogether.

                                         U.S. Telecommunications Revenue

The top line paints one picture.

From 2015 to 2020, U.S. wireline revenue will grow from $270 billion to $276 billion, at a compound annual growth rate of 0.4 percent, while U.S. mobile revenue will grow from $217 billion to $271 billion at a CAGR of 4.5 percent, according to Insight Research Corp.

Globally, communications revenue is projected to grow from $2.2 trillion to $2.4 trillion at a compounded annual growth rate of 2.3 percent from 2015 through 2020, Insight Research Corp. estimates.

The detail might tell a very different story.

In 2002, the U.S. telecommunications industry’s gross revenues were $385 billion (including cable and satellite TV), and its net revenues (after interconnection costs, program content, and handset subsidies) were $315 billion.

By 2013, even while consumer revenues grew, aggregate business segment revenues fell at least 15 percent.

And that understates the changes. Fixed network revenue fell by half. All the net revenue growth came from mobility or linear video services.

More significantly, where 85 percent of total Verizon earnings were driven by the fixed network, by 2013 the fixed network represented just 21 percent of earnings.


From 2015 to 2020, fixed network revenue will grow from $1.0 trillion to $1.1 trillion at a CAGR of 0.8 percent, while mobile revenue will grow from $1.1 trillion to $1.4 trillion at a CAGR of 3.5 percent.

Mobile revenues passed fixed network revenues a few years ago and by 2020 mobile revenue will be 25 percent higher than fixed revenue, according to Insight Research.

source: Global Telecommunications, International Telecommunications Union

source: Insight Research Corp.

source: Insight Research Corp.

The point is that gross revenue alone does not tell you what is happening with product demand or profitability.

International long distance, fixed voice, and now mobile voice and messaging, have suffered. High speed access, Ethernet access, cloud computing and mobile data have benefited.

Cable TV operators make more money, but many competitive providers make less, or are out of business.

New contestants, such as Google Fiber, Comcast and independent Internet service providers are demonstrating that facilities-based competition is more feasible than once believed.

So “total revenue” does not tell the story of what is happening “inside” the communications business, even at the level of access revenues, to say nothing of how application markets are changing.

Tuesday, February 6, 2024

Private Equity, Overbuilder and Telco FTTH Payback Models are Very Different

Firms backed by private equity have different business models than other long-term operators of connectivity assets. PE-backed firms aim to create value (typically double the asset value within seven years) and then sell the assets. 


That is a different model than used by connectivity service providers who operate for the long term, where fundamental issues of free cash flow, revenue growth and profit, as well as the ability to pay dividends, are the key constraints. 


And so it is with investors in fiber-to-home assets. 


Back in the heady days of 1996, when the Telecommunications Act of 1996 became law, business models for firms providing connectivity services changed in a big way. For legacy providers, maintaining market share became the key issue. For attackers, gaining share became the obvious key issue. 


Beyond that, the imperatives were different. Legacy providers, operating their businesses for the long haul, could not adopt the “fast growth rather than profits” models as used by many attackers. At a time of “easy money” and “we want you to grow fast” attitudes of key investors, that made sense for attackers.


And, as has been true for many software startups, long-terms operating profits were not the goal. Instead, fast growth in a “hot” area was the objective, since such firms had reasonable expectations they would simply be bought out at some point before they ever reached “terminal value.”


That, at least, is what one has to assume when looking at the costs of FTTH networks and costs to actually connect customers and earn a profit on those services.


The reported cost per-home-passed (CPHP) for underground FTTH deployments ranged from $1,600 to $2,600, according to a recent estimate by Cartesian researchers. The CPHP for aerial deployments was lower than those of underground, ranging from under $700 to $1,500 for respondents in suburban and urban environments, and $1,300 to $2,700 in more rural areas. 


source: Fiber Broadband Association 


Actually connecting a paying customer adds another $600 to $830 in drop costs. 

source: Fiber Broadband Association 


So the per-home cost of serving a paying customer includes an attributed cost of building the network; an assumption about take rates and then the cost of the drop and installation; plus operating and marketing costs. 


Take rates matter. At a 50-percent take rate, for example, the per-customer cost of the network can range from $2,600 to perhaps $5,200, with an additional $600 to $800 in drop costs, for a per-customer network cost ranging from a “best case” of perhaps $3,200 up to perhaps $6,000. 


But that is just the network platform. One would have to add in operating and marketing costs, plus any debt service and loan principal repayments. Operating and marketing costs might range from about $210 per year to $800 per year, per customer, according to some estimates. 


Cost Category

Low Estimate ($/year/subscriber)

High Estimate (/year/subscriber)

Sources

Network Infrastructure

$100

$500

FTTH Council: $200-$300,  Deloitte: $300-$500

Operations & Maintenance (O&M)

$25

$75

FTTH Council: $40-$60. Analysys Mason: $25-$35

Customer Acquisition (CAC)

$50

$150

BroadbandNow: $50-$100, Analysys Mason: $60-$150

Customer Care & Billing

$25

$50

Analysys Mason: $25-$35,  Leichtman Research Group: $30-$40

Marketing & Sales

$10

$30

Analysys Mason: $10-$20,  Leichtman Research Group: $15-$25

Total Operating Cost

$210

$805

Sum of individual ranges


And one might have to add interest charges and eventual debt principal repayment in addition to those charges. 


And there is a possible additional range of investments as well. Some firms must first acquire copper-based legacy telco assets first, before starting the FTTH upgrade, either to own and operate over the long term, or to sell the assets in five to seven years. 


Transaction

Date

Buyer

Seller

Asset Type

Homes Passed (M)

Price (USD Billion)

Cost per Passing (USD)

Source

Brightspeed - Lumen assets (20 states)

Oct 2022

Brightspeed

Lumen

Fiber

0.3

3.0

10,000

Reuters

Consolidated Communications - NewWave Communications

Aug 2022

Consolidated

NewWave

Fiber

0.18

0.65

3,611

Fierce Telecom

Windstream - MetroNet Holdings (FL)

Aug 2022

Windstream

MetroNet

Fiber

0.06

0.28

4,667

Fierce Telecom

Frontier Communications - Verizon (WA, OR)

Dec 2021

Frontier

Verizon

Mixed (Fiber & Copper)

0.14

1.05

7,500

Fierce Telecom

Allo Communications - Lincoln Telephone & Telegraph

Nov 2021

Allo

Lincoln

Mixed (Fiber & Copper)

0.11

0.21

1,909

TelecomTV

Ziply Fiber - US Cellular assets (WA, OR)

Oct 2021

Ziply

US Cellular

Fiber

0.12

0.51

4,250

Fierce Telecom

CNSL - Searchlight Investment

Jan 2020

Searchlight

CNSL

Mixed (Fiber & Copper)

0.71

0.425

600

CNBC

In many cases, the capital investment to acquire assets is equal to, or more than, the cost to add the FTTH upgrade. But that’s where the business case lies. If one assumes a copper asset can be purchased for $600 to $800 per passing, but then an upgraded FTTH asset can be sold for $5,000 to $10,000 per passing, that is the business case for making all the investments in FTTH. 


It might still be a difficult business case for a shorter-term owner, but “buying copper assets; upgrading to FTTH and then selling” can work. 


The payback for longer-term operators always has been equally challenging, if not more challenging, and has gotten arguably tougher as total account revenues including voice and video entertainment have dwindled, forcing the payback model to be based on home broadband alone. 


The main point is that FTTH payback models for private equity investors and service providers are quite distinct. What makes sense for a PE firm might not always make sense for a legacy fixed network service provider or an “overbuilder.” 


That is perhaps one reason why GFiber (owned by Alphabet) has not purchased copper telco fixed network assets before upgrading them. As with other “overbuilders,” GFiber has simply built its own greenfield FTTH networks from scratch.

AI Will Improve Productivity, But That is Not the Biggest Possible Change

Many would note that the internet impact on content media has been profound, boosting social and online media at the expense of linear form...