Showing posts sorted by date for query U.S. homes total. Sort by relevance Show all posts

Tuesday, February 6, 2024

Private Equity, Overbuilder and Telco FTTH Payback Models are Very Different

Firms backed by private equity have different business models than other long-term operators of connectivity assets. PE-backed firms aim to create value (typically double the asset value within seven years) and then sell the assets. 


That is a different model than used by connectivity service providers who operate for the long term, where fundamental issues of free cash flow, revenue growth and profit, as well as the ability to pay dividends, are the key constraints. 


And so it is with investors in fiber-to-home assets. 


Back in the heady days of 1996, when the Telecommunications Act of 1996 became law, business models for firms providing connectivity services changed in a big way. For legacy providers, maintaining market share became the key issue. For attackers, gaining share became the obvious key issue. 


Beyond that, the imperatives were different. Legacy providers, operating their businesses for the long haul, could not adopt the “fast growth rather than profits” models as used by many attackers. At a time of “easy money” and “we want you to grow fast” attitudes of key investors, that made sense for attackers.


And, as has been true for many software startups, long-terms operating profits were not the goal. Instead, fast growth in a “hot” area was the objective, since such firms had reasonable expectations they would simply be bought out at some point before they ever reached “terminal value.”


That, at least, is what one has to assume when looking at the costs of FTTH networks and costs to actually connect customers and earn a profit on those services.


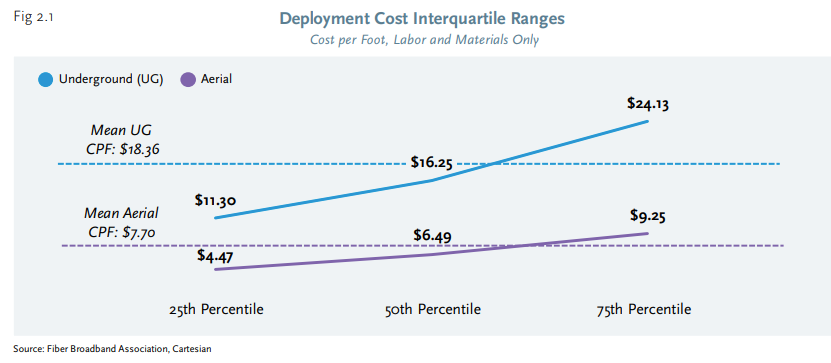
The reported cost per-home-passed (CPHP) for underground FTTH deployments ranged from $1,600 to $2,600, according to a recent estimate by Cartesian researchers. The CPHP for aerial deployments was lower than those of underground, ranging from under $700 to $1,500 for respondents in suburban and urban environments, and $1,300 to $2,700 in more rural areas. 


source: Fiber Broadband Association 


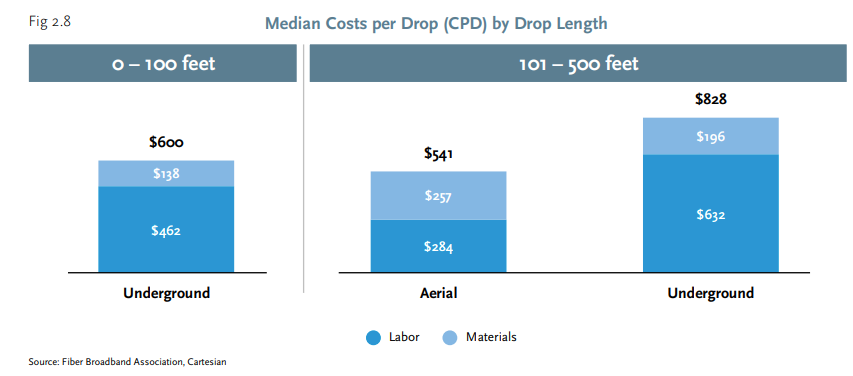
Actually connecting a paying customer adds another $600 to $830 in drop costs. 

source: Fiber Broadband Association 


So the per-home cost of serving a paying customer includes an attributed cost of building the network; an assumption about take rates and then the cost of the drop and installation; plus operating and marketing costs. 


Take rates matter. At a 50-percent take rate, for example, the per-customer cost of the network can range from $2,600 to perhaps $5,200, with an additional $600 to $800 in drop costs, for a per-customer network cost ranging from a “best case” of perhaps $3,200 up to perhaps $6,000. 


But that is just the network platform. One would have to add in operating and marketing costs, plus any debt service and loan principal repayments. Operating and marketing costs might range from about $210 per year to $800 per year, per customer, according to some estimates. 


Cost Category

Low Estimate ($/year/subscriber)

High Estimate (/year/subscriber)

Sources

Network Infrastructure

$100

$500

FTTH Council: $200-$300,  Deloitte: $300-$500

Operations & Maintenance (O&M)

$25

$75

FTTH Council: $40-$60. Analysys Mason: $25-$35

Customer Acquisition (CAC)

$50

$150

BroadbandNow: $50-$100, Analysys Mason: $60-$150

Customer Care & Billing

$25

$50

Analysys Mason: $25-$35,  Leichtman Research Group: $30-$40

Marketing & Sales

$10

$30

Analysys Mason: $10-$20,  Leichtman Research Group: $15-$25

Total Operating Cost

$210

$805

Sum of individual ranges


And one might have to add interest charges and eventual debt principal repayment in addition to those charges. 


And there is a possible additional range of investments as well. Some firms must first acquire copper-based legacy telco assets first, before starting the FTTH upgrade, either to own and operate over the long term, or to sell the assets in five to seven years. 


Transaction

Date

Buyer

Seller

Asset Type

Homes Passed (M)

Price (USD Billion)

Cost per Passing (USD)

Source

Brightspeed - Lumen assets (20 states)

Oct 2022

Brightspeed

Lumen

Fiber

0.3

3.0

10,000

Reuters

Consolidated Communications - NewWave Communications

Aug 2022

Consolidated

NewWave

Fiber

0.18

0.65

3,611

Fierce Telecom

Windstream - MetroNet Holdings (FL)

Aug 2022

Windstream

MetroNet

Fiber

0.06

0.28

4,667

Fierce Telecom

Frontier Communications - Verizon (WA, OR)

Dec 2021

Frontier

Verizon

Mixed (Fiber & Copper)

0.14

1.05

7,500

Fierce Telecom

Allo Communications - Lincoln Telephone & Telegraph

Nov 2021

Allo

Lincoln

Mixed (Fiber & Copper)

0.11

0.21

1,909

TelecomTV

Ziply Fiber - US Cellular assets (WA, OR)

Oct 2021

Ziply

US Cellular

Fiber

0.12

0.51

4,250

Fierce Telecom

CNSL - Searchlight Investment

Jan 2020

Searchlight

CNSL

Mixed (Fiber & Copper)

0.71

0.425

600

CNBC

In many cases, the capital investment to acquire assets is equal to, or more than, the cost to add the FTTH upgrade. But that’s where the business case lies. If one assumes a copper asset can be purchased for $600 to $800 per passing, but then an upgraded FTTH asset can be sold for $5,000 to $10,000 per passing, that is the business case for making all the investments in FTTH. 


It might still be a difficult business case for a shorter-term owner, but “buying copper assets; upgrading to FTTH and then selling” can work. 


The payback for longer-term operators always has been equally challenging, if not more challenging, and has gotten arguably tougher as total account revenues including voice and video entertainment have dwindled, forcing the payback model to be based on home broadband alone. 


The main point is that FTTH payback models for private equity investors and service providers are quite distinct. What makes sense for a PE firm might not always make sense for a legacy fixed network service provider or an “overbuilder.” 


That is perhaps one reason why GFiber (owned by Alphabet) has not purchased copper telco fixed network assets before upgrading them. As with other “overbuilders,” GFiber has simply built its own greenfield FTTH networks from scratch.

Sunday, January 14, 2024

How Much Mobile and Telco Success Beyond "Connectivity"?

By some estimates, larger mobile and fixed network connectivity service providers earn substantial percentages of revenue from sources beyond their core connectivity services for consumers and businesses, often in the form of services for business customers, but with some contributions from video entertainment revenues bought by consumers. 


All that matters for service providers as they hope to create more value from their products and services, beyond “dumb pipe” connectivity, though that is the point of home broadband or business data connections. 


Though the role within the internet ecosystem is that of “connectivity” provider, internet service providers often (telcos always) earn significant revenue from applications such as carrier voice and text messaging, device sales and rentals. In many cases, telcos also own and operate application businesses, most often aimed at business customers.


So when forecasters suggest that the bulk of “new service revenues” from 5G will come from business customers, that is a logical extrapolation from the fact that most non-connectivity revenue already earned by connectivity service providers is earned from services sold to business customers, not consumers. 


All that matters when trying to forecast the importance of any proposed new service provider revenue source, whether data centers, internet of things, edge computing, private networks, security, AI as a service or other products. 


Few, if any, service providers provide any detailed breakout of what we might call “ancillary” revenues earned by providing services or products other than “connectivity.”


But many would estimate that many larger telcos earn as much as 22 percent to 27 percent of total revenue in such ways. Consider Verizon, which might earn as much as 20 percent of its total revenue from Verizon Business operations, which primarily sells non-connectivity information technology solutions and services for businesses.


Verizon Connect, the unit providing fleet management and telematics solutions, might generate two percent to three percent of Verizon's overall revenue, perhaps in the same range as Verizon supplied cloud services. 


Rank

Company

Country

Total Revenue (USD Billion)

Non-Connectivity Business Revenue (%)

Examples of Services

1

Deutsche Telekom

Germany

81.0

35%

T-Systems (IT solutions & services), cloud services, cybersecurity

2

AT&T

USA

170.8

30%

WarnerMedia Business Solutions (now part of Discovery), AT&T Cybersecurity, Fleet Management Solutions

3

Verizon Communications

USA

136.9

27%

Verizon Business (IT solutions & services), Verizon Connect (fleet management), cloud services

4

NTT Group

Japan

103.5

25%

Dimension Data (IT solutions & services), NTT Communications (global network services)

5

Orange Group

France

52.5

23%

Orange Business Services (IT solutions & services), cybersecurity, cloud services

6

Vodafone Group

UK

44.4

20%

Vodafone Business (IT solutions & services), Managed Security Services, IoT platforms

7

Telefonica

Spain

43.4

18%

Telefónica Tech (IT solutions & services), Cloud & Security Services, Big Data solutions

8

China Telecom

China

54.8

16%

Tianyi Cloud (cloud services), enterprise IT solutions, system integration

9

América Móvil

Mexico

53.2

15%

Claro Business (IT solutions & services), data center services, cybersecurity

10

SoftBank Group

Japan

89.3

14%

Yahoo Japan Business Solutions, Arm Technology (chip technology), enterprise IT solutions

11

Deutsche Bahn

Germany

43.6

13%

Schenker Logistics IT services, Arriva IT solutions, DB mindbox (IT consulting)

12

KDDI

Japan

44.2

12%

au Business Solutions (IT services), data center services, system integration

13

Bharti Airtel

India

34.5

11%

Airtel Business (IT solutions & services), cloud services, data center services

14

Telecom Italia

Italy

17.0

10%

TIM Enterprise (IT solutions & services), Noovle IoT platform, cloud services

15

Telenor Group

Norway

20.2

9%

Telenor Connexion (IoT solutions), dtac Enterprise (Thailand), Grameenphone Enterprise (Bangladesh)

16

Proximus

Belgium

6.0

8%

Proximus Flex (flexible work solutions), B2B IoT solutions, IT managed services

17

Ooredoo Group

Qatar

13.6

7%

Ooredoo Managed Services, cloud services, cybersecurity services

18

Telia Company

Sweden

5.1

6%

Telia Innova (IT solutions), Cloud Services, IT consulting

19

Swisscom

Switzerland

8.4

5%

Swisscom Enterprise (IT solutions & services), cloud services, IT consulting

20

Telekom Austria Group

Austria

7.3

4%

A1 Digital (IT solutions), A1 Business Cloud, IoT solutions

21-25

Other Telcos

N/A

N/A

<4%

IT solutions & services, data center services, security solutions


Rank

Company

Country

Total Revenue (USD Billion)

Non-Connectivity Revenue (%)

Examples of Non-Connectivity Services

1

Deutsche Telekom

Germany

81.0

32%

Cloud services, IT solutions, media & entertainment

2

AT&T

USA

170.8

28%

WarnerMedia (now part of Discovery), DirecTV, cybersecurity services

3

Verizon Communications

USA

136.9

25%

Oath (now Verizon Media), cloud services, Verizon Connect for fleet management

4

NTT Group

Japan

103.5

22%

Dimension Data (IT services), Docomo Bike Sharing, Docomo Healthcare

5

Orange Group

France

52.5

20%

Orange Business (IT solutions), Orange Money (mobile finance), cyberdefense services

6

Vodafone Group

UK

44.4

18%

VodafoneZiggo (cable TV & broadband), M-Pesa (mobile money), IoT platforms

7

Telefonica

Spain

43.4

16%

Movistar Play (streaming service), cloud solutions, Telefónica Tech (IT services)

8

China Mobile

China

114.5

15%

Migu Music (music streaming), cloud services, mobile advertising

9

China Telecom

China

54.8

14%

Tianyi Cloud (cloud services), enterprise IT solutions, smart city projects

10

América Móvil

Mexico

53.2

13%

Claro video (streaming service), Telcel IoT solutions, financial services

11

KDDI

Japan

44.2

12%

au Smart Pass (loyalty program), au WALLET (mobile payments), home security systems

12

SoftBank Group

Japan

89.3

11%

Yahoo Japan, Arm Holdings (chip technology), Sprint (now part of T-Mobile US)

13

Bharti Airtel

India

34.5

10%

Airtel Payments Bank, digital TV services, data center services

14

Telecom Italia

Italy

17.0

9%

TIMvision (streaming service), cloud services, Nuvola IoT platform

15

Telenor Group

Norway

20.2

8%

Telenor Connexion (IoT solutions), dtac (Thailand), Grameenphone (Bangladesh)

16

Ooredoo Group

Qatar

13.6

7%

Ooredoo Money (mobile wallet), managed IT services, smart city projects

17

Deutsche Bahn

Germany

43.6

6%

Schenker Logistics, Arriva (public transport), DB mindbox (IT solutions)

18

Proximus

Belgium

6.0

5%

Proximus Flex (flexible work solutions), IoT connectivity, TV production services

19

Telia Company

Sweden

5.1

4%

Telia Innova (IT solutions), Bonnier Broadcasting (media), TV4

20

Swisscom

Switzerland

8.4

3%

Bluewin (internet hosting), cloud services, IT consulting

21

Telekom Austria Group

Austria

7.3

2%

A1 Digital (IT solutions), A1 Xplore TV, A1 IoT services

22

MTN Group

South Africa

16.0

1%

MTN MoMo (mobile money), digital entertainment platforms, enterprise IT solutions

23

Vodacom Group

South Africa

9.0

1%

M-Pesa (mobile money), Vodacom Business (IT solutions), financial services

24

Liberty Global

UK

7.9

0%

Cable & internet services, Virgin Media O2 (UK), Telenet (Belgium)

25

Millicom

Luxembourg

4.0

0%

Tigo Money (mobile money), cable & internet services, digital media offerings


Of course, many telcos also earn revenue from consumer services including subscription entertainment video services. -/*


Rank

Company

Country

Total Revenue (USD Billion)

Video Entertainment Revenue (%)

Examples of Video Services

1

AT&T

USA

170.8

12%

Earnings from WarnerMedia DirecTV ownership

2

Verizon Communications

USA

136.9

8%

Oath (now Verizon Media), Yahoo Screen (streaming)

3

Orange Group

France

52.5

7%

Orange TV (pay-TV), OCS (streaming), Canal+ (France)

4

Vodafone Group

UK

44.4

6%

VodafoneZiggo (cable TV & broadband), Horizon TV (Ireland)

5

China Mobile

China

114.5

5%

Migu Video (streaming), IPTV services

6

América Móvil

Mexico

53.2

4%

Claro video (streaming), IPTV services

7

Telekom Italia

Italy

17.0

3%

TIMvision (streaming), Infinity TV (pay-TV)

8

SoftBank Group

Japan

89.3

3%

Hulu Japan (streaming), SoftBank TV (satellite TV)

9

Bharti Airtel

India

34.5

2%

Airtel Xstream (streaming), IPTV services

10

KDDI

Japan

44.2

2%

au Smart Pass (loyalty program with video content), UULA VOD service

11

Deutsche Bahn

Germany

43.6

1%

DB Play (streaming platform), TV channels on ICE trains

12

Ooredoo Group

Qatar

13.6

1%

beIN SPORTS (regional sports network), IPTV services

13-25

Other Telcos

N/A

N/A

<1%

IPTV services, partnerships with streaming platforms, niche video offerings


The point is that larger internet service providers with voice, messaging and other operations (telcos, cable operators and others) operate both “dumb pipe” internet access as well as applications businesses (voice services, text messaging, business applications, systems integration, data center services).


Focusing on the “core business” therefore is a complicated, double-edged sword. Focusing strictly on “internet access, voice and text messaging” might be quite limiting in an environment where growth is slow and profit margins are thin. 


But moving into different roles within the ecosystem is always challenging, and telcos often have met with limited success when attempting to do so. 


So execution risk is always significant. And some telcos arguably have done a better job of diversifying.


Telco

Business

Year Launched

AT&T

Data centers (AT&T Global Network Services)

2011

Deutsche Telekom

System integration (T-Systems)

1995

Orange

Cybersecurity (Orange Cyberdefense)

2015

Singtel

Digital advertising (Singtel DASH)

2012

NTT Docomo

Smart cities (Docomo Smart City)

2017

Telefonica

IoT solutions (Telefonica Tech)

2011

Telstra

Digital health (Telstra Health)

2018

Vodafone

Enterprise software (Vodafone Business Solutions)

2016

KT

AI and robotics (KT AI & Robotics)

2018


Telco failures also are common. 


Telco

Business

Year Launched

Outcome

Reason for Failure

AT&T

Cloud computing (AT&T Cloud)

2013

Sold to Amazon in 2017

* Late entry into the market. * Difficulty competing with established cloud providers like Amazon Web Services (AWS) and Microsoft Azure.

Deutsche Telekom

App store (T-Mobile Zone)

2002

Shut down in 2005

* Lack of compelling content and applications. * Competition from established app stores like Apple App Store and Google Play.

Orange

Music streaming (Orange Music)

2003

Shut down in 2007

* Difficulty competing with established players like Spotify and iTunes. * Limited user base and content library.

Verizon

Video streaming (Verizon FiOS TV)

2005

Sold to Frontier Communications in 2016

* High cost of content acquisition and infrastructure deployment. * Limited market share compared to cable and satellite TV providers.

Singtel

Social networking (Singtel Circle)

2009

Shut down in 2012

* Failure to attract a critical mass of users. * Competition from established social networks like Facebook and Twitter.

NTT Docomo

Mobile payments (Docomo Mobile Wallet)

2010

Shut down in 2014

* Low adoption rate among users. * Competition from existing payment methods like credit cards and digital wallets.

Telefonica

Home security (Telefonica Movistar Home)

2011

Sold to Securitas Direct in 2015

* Difficulty scaling the business beyond core customer base. * Competition from established security companies.

Telstra

Digital TV (Telstra BigPond TV)

2007

Shut down in 2013

* High content acquisition costs and low profitability. * Competition from streaming services and satellite TV providers.

Vodafone

Mobile advertising (Vodafone Mobile World)

2009

Shut down in 2012

* Difficulty attracting advertisers and developers. * Lack of critical mass of users.

KT

Online gaming (KT GamePark)

2000

Shut down in 2004

* Failure to compete with established online gaming platforms. * Limited content and user base.


As a general rule, telcos have had better success with business-focused services than consumer-focused services. That possibly explains the higher expectations mobile service provider executives have for business revenue upside from 5G, for example,.compared to consumer services. 


Study Source

Date

Business Focus

Consumer Focus

Top Revenue Opportunities

GSMA Global Mobile Trends Report

Q1 2023

Enterprise IoT, Fixed Wireless Access (FWA), Network Slicing

Enhanced Mobile Broadband (eMBB), Mobile Entertainment, AR/VR

eMBB, Enterprise IoT, FWA

Ericsson Mobility Report

Nov 2023

Private networks, Industry 4.0, Cloud RAN

Video streaming, AR/VR, Gaming

Industrial IoT, eMBB, Private Networks

Capgemini

Oct 2023

Edge computing, Network as a Service (NaaS), Cloud Gaming

AI-powered services, Immersive experiences, Health & Wellness

Industrial IoT, NaaS, AI-powered services

Deloitte

Sept 2023

Smart cities, Augmented Reality (AR) applications, Predictive maintenance

Cloud gaming, Immersive entertainment, Social media

Smart cities, eMBB, Cloud gaming

PwC

July 2023

Connected vehicles, Cyber security, Digital twins

Personalized content, On-demand services, Healthcare applications

Connected vehicles, Cybersecurity, Industrial IoT

McKinsey & Company

June 2023

Smart agriculture, Remote healthcare, Education & Training

Personalized AR/VR experiences, Connected homes, Education platforms

Smart agriculture, eMBB, Personalized AR/VR

Gartner

May 2023

Predictive analytics, Blockchain, Supply chain optimization

Virtual Reality (VR) experiences, Enhanced security, On-demand entertainment

Business process optimization, eMBB, VR experiences

Accenture

Apr 2023

Digital workforce solutions, Smart retail, Manufacturing automation

Personalized entertainment, Connected car services, E-commerce & Retail

Workforce automation, Smart retail, eMBB

KPMG

Mar 2023

Smart grids, Energy management, Environmental monitoring

Social media platforms, Connected devices, Location-based services

Smart grids, eMBB, Connected devices

Bain & Company

Feb 2023

Healthcare data analytics, Financial services, Logistics & transportation

Immersive gaming, Social media with AR/VR integration, Online education

Healthcare analytics, Logistics & transportation, eMBB

Boston Consulting Group

Jan 2023

Autonomous vehicles, Robotics, Remote manufacturing

Virtual reality tourism, Personalized learning, Connected home ecosystems

Autonomous vehicles, eMBB, Robotics

AI Will Improve Productivity, But That is Not the Biggest Possible Change

Many would note that the internet impact on content media has been profound, boosting social and online media at the expense of linear form...