Showing posts sorted by relevance for query data center to data center. Sort by date Show all posts

Monday, March 23, 2015

"Data Center to Data Center" Traffic is Growing Faster Than "Intra-Center" or "Data Center to End User" Traffic

Once upon a time, global wide area network traffic was relatively limited, and mostly represented connections between tandem switch and central office switch locations.

These days, traffic tends to be dominated by server-to-server traffic, within data centers, between data centers and then from data centers to end users.

A recent Bell Labs study forecasts total metro traffic will increase 560 percent by 2017, largely driven by IP video and the increasing adoption of cloud and data center services and applications.

According to the study, metro video traffic (including subscription TV and Internet video) will increase 720 percent by about 2017.

Metro cloud and data center traffic will increase 440 percent by 2017, the study predicts.

As the demand for video content increases, video caching is now being implemented within metro networks, moving content caching deeper into the network.

As a direct consequence, traffic between data centers in metro areas will grow, keeping much traffic off the backbone networks. That’s a significant change.

On the other hand, a growing percentage of traffic also will be moving between data centers.

Traffic between data centers is growing faster than either traffic to end-users or traffic within the data center, and by 2018,  traffic between data centers will account for almost nine percent of total data center traffic, up from nearly seven percent at the end of 2013, according to Cisco.

Until recently, metro traffic had a “north-south” flow from a content source to the end user with content sources typically located at a national central location and delivered over the wide area backbone network.

But there is a change coming, Alcatel-Lucent says. The north-south flows increasingly will be replaced by “east-west traffic  flows for traffic flows from data center to data center, increasingly located within metro centers.

There are revenue implications for providers of high-capacity metro networks and long haul bandwidth providers alike.

Tuesday, October 26, 2021

Data Center Traffic Now Equals Internet Traffic

For most of the last 10 years, data center to data center traffic has been a huge part of demand for wide area network transport capacity. With heavy consumer demand for web apps of all types, including streaming video, you would expect IP networks that support consumer access to carry a significant amount of traffic. 


In 2021, for example, internet traffic overall, which includes business-to-consumer and business-to-business traffic, will be roughly equivalent in magnitude. That is part of a trend that has been in place for nearly a decade, where data center to data center traffic has grown as a percentage of total traffic flowing over wide area networks. 

source: Cisco 


The implications for suppliers of WAN connectivity are significant. It now is possible to capture any demand related to public connectivity revenue simply by focusing on data center to data center connectivity. 


In other words, trends in WAN traffic and value have come to resemble the general pattern of global telecommunications, where enterprise or business demand is about equivalent to consumer demand. That does not necessarily correspond directly to revenue shares, but there is a correspondence. 


It also is possible to illustrate the value of interconnection (network effect) by examining data flowing between organizations and servers within a data center. Much of that traffic represents interconnections and data flow between collocated entities within any single data center. 

source: Cisco 


Pre-internet, connectivity providers were the main actors in collocation activity. These days computing as a service suppliers and application providers are a much bigger factor. Connectivity providers might still represent about 64 percent of interconnections, but enterprises represent 34 percent.


source: Equinix Global Interconnection Index


As suggested by the Equinix Global Interconnection Index, private interconnection happens routinely between enterprises, network, cloud and other information technology providers. 

source: Equinix

Tuesday, November 16, 2021

"Data Center to Data Center" Traffic Drive About Half of WAN Demand

Data center traffic moving to end users was a decade ago a larger percentage of total wide area network data volume. That has been steadily changing, with more traffic moving between data center locations.  


In 2021, the volume of data moving between data centers is about equal to the amount of data moving to end users. Content caching accounts for some of the data center to data center increase. Content mirroring accounts for an additional amount of inter-data-center traffic. 

source: Cisco 


The huge amount of “within the data center traffic” is partly caused by applications that involve lots of queries. Many internet applications are extremely “chatty”. A single search query within the data center might involve hundreds of server requests, for example. 


A social networking transaction has a similar multiplier effect, as it draws in an entire social graph to respond to a single query. 


The architecture of data centers can contribute to the amount of traffic as well, using with separate storage arrays, development or  production server pods and application server clusters that all need to talk to one another.


Still, wide area network bandwidth now is about equally composed of traffic heading for end users and traffic moving between data centers, a trend itself driven by the dominance of content as a driver of network capacity. 

source: Telegeography 


Content drives as much as 83 percent of transAtlantic traffic and 66 percent of transPacific traffic, for example. 

source: Telegeography

Monday, March 23, 2015

What Drives Global Bandwidth Demand? Everything

No single driver accounts for the strong growth of Internet bandwidth demand in every region of the world. Instead, almost every trend in communications, computing and entertainment now collectively boosts demand for capacity.


More users, more users on mobile, more people watching video, more content consumption, stored in more places and assembled from more sources, plus globalization all contribute to higher usage.


But usage alone is not the whole story. “Where” usage occurs also has changed, with the greatest volume growth in Asia. That, in turn, leads to more traffic across Asia to and from Europe, and to and from North America.


Use of more-global internet exchange points (IXPs) likewise has affected traffic flows.


Historically, most traffic transited through US-based network access points (NAPs) in which backbones interconnected their networks and exchanged traffic. As all ISPs had to connect to the US for international transit, they also used these links to exchange domestic and regional traffic, a process referred to as tromboning.


Today, regional IXPs are used to exchange more local traffic. Still, the largest number and percentages of IXPs are located in North America, Europe and Asia. That in turn drives traffic between the three regions.


By 2018, perhaps 78 percent of all workloads will be processed in cloud data centers, Cisco argues.

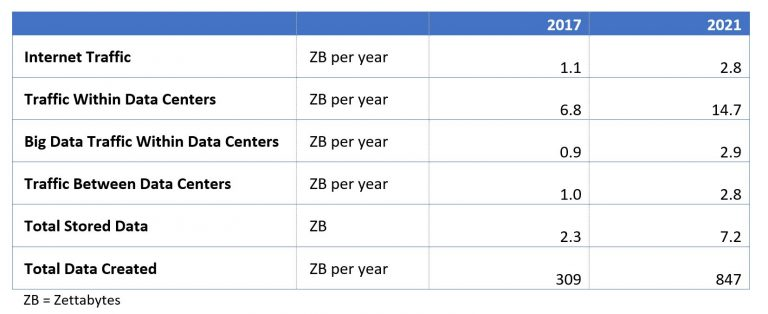
But traffic between data centers is growing faster than either traffic to end-users or traffic within the data center, and by 2018, traffic between data centers will account for almost nine percent of total data center traffic, up from nearly seven percent at the end of 2013. 

The high growth of this segment is due to the increasing prevalence of content distribution networks, the proliferation of cloud services and the need to shuttle data between clouds, and the growing volume of data that needs to be replicated across data centers.

Data center traffic on a global scale will grow at a 23-percent CAGR, but cloud data center traffic will grow at a faster rate (32 percent CAGR) or 3.9-fold growth from 2013 to 2018, Cisco predicts. .


Cloud workloads are expected to nearly triple (grow 2.9-fold) from 2013 to 2018, whereas traditional data center workloads are expected to see a global decline, for the first time, at a negative two-percent CAGR from 2013 to 2018.


From 2013 to 2018, the Middle East and Africa is expected to have the highest cloud traffic growth rate (54‑percent CAGR), followed by Central and Eastern Europe (39-percent CAGR) and Asia Pacific (37‑percent CAGR).


      Cloud Traffic Growth by Region, in Exabytes
Region
2013
2014
2015
2016
2017
2018
CAGR 2013–18
Asia Pacific
489
716
1,010
1,368
1,802
2,331
37%
Central and Eastern Europe
85
120
170
238
331
442
39%
Latin America
89
130
180
240
312
394
35%
Middle East and Africa
31
53
86
132
193
262
54%
North America
643
857
1,102
1,384
1,701
2,077
26%
Western Europe
311
401
502
631
791
988
26%
Source: Cisco Analysis, 2014


      Regional Distribution of Total Data Center Workloads, in Millions
Total Data Center Workloads in Millions
    
2013
2014
2015
2016
2017
2018
CAGR 2013–2018
Asia Pacific
16.3
20.9
28.4
37.9
48.0
61.2
30%
Central and Eastern Europe
2.3
2.7
3.1
3.6
4.3
5.1
17%
Latin America
2.6
3.2
3.9
4.7
5.7
6.9
21%
Middle East and Africa
1.8
2.3
2.9
3.5
4.3
5.2
24%
North America
56.1
62.8
68.7
73.9
80.3
88.0
9%
Western Europe
29.2
33.3
36.5
39.7
42.2
45.1
9%
Source: Cisco Analysis, 2014
The portion of traffic residing within the data center will decline slightly over the forecast period, accounting for nearly 77 percent of data center traffic in 2013 and about 75 percent by 2018. 

Despite the decline, the majority of traffic remains within the data center because of factors such as the functional separation of application servers, storage, and databases, which generates replication, backup, and read and write traffic traversing the data center. 

Furthermore, parallel processing divides tasks and sends them to multiple servers, contributing to internal data center traffic.


Sunday, April 28, 2024

More Computation, Not Data Center Energy Consumption is the Real Issue

Many observers raise key concerns about power consumption of data centers in the era of artificial intelligence. 


According to a study by the Lawrence Berkeley National Laboratory, AI-driven data center electricity consumption could increase by 50 percent to 200 percent by 2040, posing new challenges for data center operators trying to limit and reduce carbon emissions and electrical consumption. 


Study

Year Published

AI-driven electricity consumption (GWh)

Increase over 2023 (%)

Lawrence Berkeley National Laboratory

2020

130

40%

Gartner

2021

200

50%

IDC

2022

300

75%

DigiCapital

2023

400

100%

Lawrence Berkeley National Laboratory

2018

10% of total data center electricity consumption

50%

Gartner

2020

15% of total data center electricity consumption

75%

IDC

2021

20% of total data center electricity consumption

100%


Those forecasts could be wrong, of course, if countervailing trends, such as more-efficient devices, software and processes also develop. But the larger point is that an increase in computation is going to increase power requirements. 


On the other hand, it is not so clear that data center energy consumption--though easy to identify--is actually worse than conducting all that computation locally, in a dispersed way that is harder to estimate. 


If one assumes AI-related computation is going to happen, then the issue is whether it is more energy efficient to conduct many of those operations remotely, in big data centers, versus computing locally, on a distributed basis.


And there the issue is more complicated. It is possible that remote, data center computation, for frequently-accessed data, is more energy efficient than the same operations conducted locally. 


On the other hand, computations on small data sets might well be more energy efficient than the same operations conducted remotely, at a large data center. 


Study Title

Authors/Publisher

Year

Key Findings

The Energy Consumption of Cloud Storage: Exploring the Trade-Offs

Zhiwei Xu et al.

2018

Cloud storage can be more energy-efficient than local storage, especially for frequently accessed data.

The Power of Servers: A Hidden Environmental Cost of Cloud Computing

Elliot et al.

2014

Highlights the significant energy consumption of data centers but acknowledges potential efficiency gains compared to widespread local storage.

A Survey on Modeling Energy Consumption of Cloud Applications: Deconstruction, State of the Art, and Trade-Off Debates

D. Kliazovich et al.

2013

Emphasizes the importance of considering network energy consumption when comparing local vs. remote storage

How Green is the Cloud? A Comparison of the Environmental Footprint of Cloud Computing and On-Premises Solutions

M. A. van den Belt et al.

2013

Concludes that cloud storage can be more environmentally friendly for large datasets due to economies of scale and potential for renewable energy use in data centers.

Energy Consumption of Cloud Storage: The Importance of Power Management

Zhiwei Cao et al.

2011

Concludes that cloud storage can be more energy-efficient than local storage, especially for large datasets.

A Survey on Modeling Energy Consumption of Cloud Applications: Deconstruction, State of the Art, and Trade-Off Debates

George Kousiouris et al.

2018

Highlights the importance of network energy consumption when considering cloud storage. Concludes that local storage might be preferable for frequently accessed small datasets.

The Energy Efficiency of Cloud Storage Compared to Local Storage

Aapo Ristola et al.

2017

Finds that cloud storage can be more energy-efficient for most use cases, especially with increasing data volume.


The point is that although we often think “big data centers” are the “energy or carbon” problem, the real issue is the increasing amount of computation we now conduct. It is not so clear that the data centers are the real issue.


Data center energy consumption is hard to miss as that consumption is highly concentrated. Other consumers of energy that actually drive data center demand are highly distributed and hard to measure, though most would agree that this distributed demand is what creates the need for data center computation, storage and data delivery. 


Device Category

Consumer TWh

Business TWh

Total TWh

Source

Laptops & Desktops

1,200

400

1,600

The Shift Project: https://theshiftproject.org/en/home/ (2019)

Smartphones & Tablets

800

100

900

International Energy Agency (IEA): https://www.iea.org/reports/energy-efficiency-2023 (2023)

Servers (excluding data centers)

-

200

200

The Shift Project: https://theshiftproject.org/en/home/ (2019)

Network Equipment

200

100

300

The Shift Project: https://theshiftproject.org/en/home/ (2019)

TVs & Streaming Devices

600

100

700

IEA: https://www.iea.org/reports/energy-efficiency-2023 (2023)

Gaming Consoles

200

50

250

The Shift Project: https://theshiftproject.org/en/home/ (2019)

Other Devices (printers, wearables, etc.)

100

50

150

Estimated based on IEA report on standby power


Will Video Content Industry Survive AI?

Virtually nobody in business ever wants to say that an industry or firm transition from an older business model to a newer model is doomed t...