Showing posts sorted by date for query occupied housing units. Sort by relevance Show all posts

Saturday, April 15, 2023

Unknown "Homes Passed" Data Hampers Revenue Growth Estimates

Some important types of statistics and data are not collected because governments do not force firms or industries to collect it. For example, many governments think it is important to track data on where home broadband exists, where it does not, how fast it operates, who buys and who does not. 


Private firms often have important incentives to track and measure their own revenues, sales, profit margins and growth rates. Financial markets and accounting rules often require measurement of this sort. 


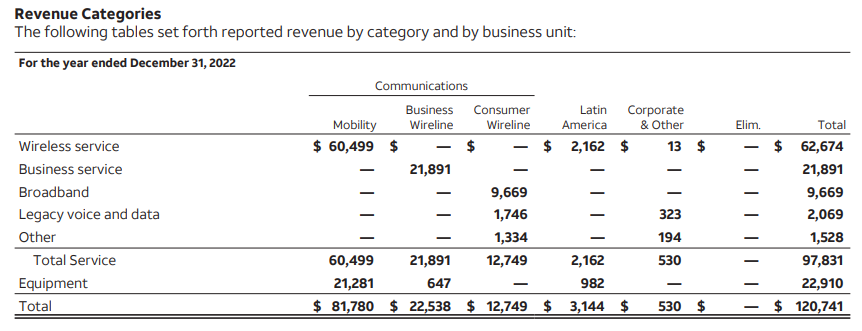
AT&T, for example, reports revenues for mobility, fixed network business revenues and consumer fixed network revenues from internet access, voice and other sources. But those are traditional financial metrics, not operating indices such as penetration or take rates, churn rates and new account gains. 

source: AT&T 


Nobody seemingly believes the same effort should be made to measure the number of home broadband provider locations or dwellings reached by various networks. Better mapping, yes. Metrics on locations passed? No. 


And yet “locations passed” is a basic and essential input to accurately determine take rates (percent of potential customers who actually buy). That input matters quite a lot to observers when evaluating the growth prospects of competitors, even if that figure does not matter much for policymakers, who mainly care about the total degree of home broadband take rates, on an aggregate basis. 


The U.S. Census Bureau, for example, reported some 140.5 million housing units housing units as part of the 2020 census. The estimate for 2021 units is 142.2 million units. Assume 1.5 million additional units added each year, for a 2022 total of about 143.6 million dwelling units


Assume vacancy rates of about six percent. That implies about 8.6 million unoccupied units that would not be assumed to be candidates for active home broadband subscriptions. The U.S. Census Bureau, though, estimates there are about 11 million unoccupied units when looking at full-time occupied status. That figure presumably includes vacation homes.


Deducting the unoccupied dwellings gives us a potential home broadband buyer base of about 132.6 million locations. 


More difficult is the degree to which access networks operated by any single contestant actually pass those locations, as firms generally do not report such numbers in quarterly financial or annual reports (they do not have to do so). 


And that is where estimations must be made. AT&T’s 2022 10-K report cites 14.2 million customer locations connected. Assume AT&T has about 20 percent take rates for its home broadband services where it operates. That implies a housing unit coverage of about 71 million dwellings. 


Assume AT&T has a higher take rate of about 39 percent where it operates fixed networks. That implies housing coverage of about 36 million dwellings. 


The estimate of 71 million home passings strikes me as too high, but the estimate of 36 million seems too low. In the past I have used the figure of 62 million homes passed for AT&T. 


Assume Verizon has about 10 million home broadband accounts, with a take rate of 40 percent (a bit high, probably, if we include copper access). That implies housing coverage of some 25.3 million dwellings. 


Leichtman Research Group has estimates of home broadband accounts that vary from company reports. LRG estimates that AT&T has some 15.4 million internet access accounts. The variance might come from business accounts not enumerated. 


Verizon’s consumer accounts might be overstated, as LRG estimates Verizon has about 7.5 million home broadband accounts, not 10 million. Using the LRG account figures, we might estimate Verizon home coverage of about 18.8 million homes, on the high side. 


ISPs

Subscribers at end of 2022

Net Adds in 2022


Cable Companies


Comcast

32,151,000

250,000

Charter

30,433,000

344,000

Cox*

5,560,000

30,000

Altice

4,282,900

(103,300)

Mediacom*

1,468,000

5,000

Cable One**

1,060,400

14,400

Breezeline**

693,781

(22,997)


Total Top Cable

75,649,081

517,103


Wireline Phone Companies


AT&T

15,386,000

(118,000)

Verizon

7,484,000

119,000

Lumen^

3,037,000

(253,000)

Frontier

2,839,000

40,000

Windstream*

1,175,000

10,300

TDS

510,000

19,700

Consolidated**

367,458

724


Total Top Wireline Phone

30,798,458

(181,276)


Fixed Wireless Services


T-Mobile

2,646,000

2,000,000

Verizon

1,452,000

1,171,000


Total Top Fixed Wireless

4,098,000

3,171,000


Total Top Broadband

110,545,539

3,506,827

source: Leichtman Research Group 


Assume Comcast has 31.2 million accounts, with take rates for home broadband of about 52 percent. That implies something on the order of 60 million households. 


Assume Charter Communications has a take rate of about 45.5 percent where it operates fixed networks. Assume Charter has approximately 30.8 million home broadband accounts. That implies a homes-passed figure of about 67.7 million homes. 


If there are 132.6 million U.S. occupied home locations, then Comcast and Charter can reach about 127.7 million of those locations, or about 96 percent of total, as Comcast and Charter essentially have unduplicated networks, not competing in the same geographies. 


That strikes me as unlikely, on the high side. An older rule of thumb is that Comcast and Charter reach about a third of total U.S. locations, each, for a possible reach of up to 66 percent of total U.S. home locations. 


Using different methodologies, I have in the past estimated that Comcast has (can actually sell service to ) about 57 million homes passed, while the Charter Communications network passes about 50 million homes, the number of potential customer locations it can sell to.


Verizon homes passed might number 18.6 to 20 million. To be generous, use the 20 million figure. 


AT&T’s fixed network represents perhaps 62 million U.S. homes passed. CenturyLink never reports its homes passed figures, but likely has 20-million or so consumer locations it can market services to. 


Ignoring the variance in potential customer locations passed, AT&T would seem to have the greatest opportunity in the home broadband space, if it can build optical access connections faster, as has the biggest home footprint and low home broadband market share. 


On the other hand, AT&T revenue is driven by mobility, not the consumer fixed network. So then the question has to be posed as "how much to invest in the consumer fixed network?" compared to other oportunities. A rational person might argue that answer is "not so much."


Capital availability--and financial returns--are always the issue. Even if it dramatically escalated fiber-to-home capital investment, it is not clear AT&T would gain as much new revenue, compared to investing in mobility or business services, for example.


The point of the wider exercise is that we are forced to guess about how many homes each of the major fixed network contestants actually can reach. That, in turn, affects our ability to estimate adoption rates and potential growth opportunities. 


The key point is that the estimates are imprecise. Pinning down the “homes passed” figure, essential as the denominator in any calculation of take rates, requires estimations with variable degrees of uncertainty, especially for the larger networks.


Saturday, October 30, 2021

Maybe Quality, not Quantity, Now is the Issue for Broadband Access

Figuring out what percentage of persons or homes have “broadband” access requires several assumptions about locations (households, occupation rates, household density) and buy rates. 


To really understand adoption rates, one also has to back out business accounts and locations. Also, one has to adjust for platforms, since fixed networks provide one solution, but mobility is a substitute in some cases. In other words, some homes and people use a “mobile-only” approach to their broadband needs. 


Bulk accounts (colleges and universities with living facilities) also play some part in adding to “homes with broadband services being used.” It is probably less material than the errors from all the other assumptions. 


“Quality” and “price” require more assumptions. Even homes buying--or able to buy--fiber to home services are not the same. Some connections support gigabit per second speeds, others perhaps offer speeds that top out in the hundreds of megabits per second. So “speed” and “access media” are not synonymous, at least at the moment. ]


Nor does access media tell us much about upstream bandwidth. 


“Affordability” and “price” likewise require assumptions, since nobody has granular full market data about the actual packages customers buy, and whether posted retail rates actually reflect the real prices paid, including all promotions and discounts. 


Beyond that, “price” has a relative element. Some would argue that what matters is the relative cost of broadband access compared to household income or disposable income. Is it a larger or smaller percentage of household budgets?


Nor do we necessarily need to rely on government data that often is inaccurate to some degree because it is two years old or uses a methodology which is not granular enough. 


There were perhaps 111.9 million U.S. fixed network broadband accounts at the end of the second quarter 2021, according to Leichtman Research Group. That presumably includes both consumer and business accounts. 


Separately, Point Topic estimates there are a total 120 million or so U.S. fixed broadband accounts in service. Separately, consumer adoption is estimated at about 86 percent of households or persons, depending on which methodology is used (active connections to places or people with active connections).


. Some estimate occupied households to number about 125 million units.   

source: Point Topic 


If so, then about 107.5 million accounts are consumer subscriptions, not counting perhaps 4.4 million fixed network business accounts. 


But it also is important to remember that fixed network subscriptions understate the number of people with broadband at their homes, as most U.S. households are multi-person. Perhaps a quarter of all occupied housing has a single occupant. The other 75 percent are multi-person households.


Using a 2.6-persons-per-household average, for example, would suggest 279.5 million people having access to broadband. Total U.S. population in 2020 is estimated at 334.5 million, confirming the estimate that 84 percent or so of people buy broadband. 


Whether calculating fixed broadband access by locations with connections or persons with connections, the estimates are congruent, which I find somewhat surprising (again, looking only at fixed network accounts, and ignoring mobile access). 


source: Statista 


It has been estimated that 15 percent to 20 percent of homes are mobile-only for internet access. In the U.S. market that might mean 18.8 million to 25 million homes. Adding those figures to the estimated 197.5 million home accounts yields totals that exceed the total number of U.S. homes. 


So we have to assume one or more facts. There are more occupied homes than we think; there are more homes than we think; there are fewer mobile-only homes than we think; the fixed network accounts are overstated or some combination of those issues. Also, we tend to ignore some percentage of highly-rural consumer locations that rely on satellite access, as well as the changes in that market as new satellite constellations go commercial. 


Or perhaps the issue now is the quality of connections, not the coverage. Some people and some households simply do not wish to use the internet, though the percentage seems to shrink every year. As that is the case, “100-percent take rates” is some number less than the total number of homes. 


Perhaps the issue in the U.S. market is more “quality” than “availability.”


Thursday, February 4, 2021

Causation is Clear for Short-Term Rentals, Less Clear for Broadband

“Who benefits and who loses?” is a reasonable question for analyses of public policy and economic studies. As with all questions related to public policy and economics, though, correlation is easier to demonstrate than causation, simply because the number of variables is so great. 


In the connectivity business, the issue is most common in analyses of broadband impact on economic growth, household income or job growth. We assume broadband “causes” economic growth, but correlation is not causation.  


We assume quality broadband is associated with job growth, but cannot prove causation. We assume better mobile broadband also “causes” economic growth, so we might also believe 5G will similarly cause growth. We might be wrong. 


It also is plausible that areas with strong economic growth, above-average household income and wages, higher educational levels and wealth create demand for better broadband. In other words, demand for broadband is a result of strong economic growth, rather than its cause. 


Other cases arguably have stronger causation relationships. Consider the argument that use of short-term rental apps causes a reduced supply of housing and higher housing costs. It seems plausible for the simple reason that housing vacancies in any market tend to be fixed, and rental property managers can make choices about how to market their rentals: short term or long term. 


The issue is how much difference a robust short-term rental has. It also seems plausible that the biggest impact should be in “touristy” areas where there is high demand for short-term housing. Areas with modest tourist demand should also have modest demand for short-term housing. 


It also seems plausible that the greatest effect is in “touristy” areas that also are affluent. 


Airbnb leads to a reduced supply of housing as properties shift from serving local residents to serving Airbnb travelers, which hurts local residents by raising housing costs, according to Josh Bivens, Economic Policy Institute director of research. 


That assessment seems mirrored by some other studies. Short-term rentals using apps such as Airbnb contribute to housing shortages and rent increases, according to Felix Mindl and Dr. Oliver Arentz, researchers at University of Cologne in Germany. 


They attributed 14.2 percent of overall rent increases to short-term rentals or 320 euros ($385) per year for new tenants.


“While a large proportion of hosts can be considered home sharers, we find an increasing proportion of providers who have developed a professional business model from short-term rentals,” Mindl said in a statement. “Professional short-term rentals are available to tourists throughout the year, and thus compete directly with long-term tenants, for whom the rooms are then no longer available.”


Researchers also have found that in local neighborhoods with a lower share of owner-occupancy, Airbnb had a higher impact on rising housing prices and rents. In areas with a higher share of owner-occupancy, Airbnb had somewhat less of an impact on property prices and rents.


The study also found that the total supply of housing was not affected by the entry of an Airbnb property in a given neighborhood, and that Airbnb listings tend to increase the supply of short-term rental units, while contributing to a decrease of the supply of long-term rental units.


Aside from the presumed effect on housing, short-term rental apps also shift revenue between lodging suppliers. As with sports stadiums, which arguably mostly shift spending from one form of entertainment to another, short-term rental apps shift revenue from hotels to individual property owners.


“The most obvious benefit stemming from the creation and expansion of Airbnb accrues to property owners who have units to rent,” EPI noted.


There are other issues, though. The housing market is affected by forces other than Airbnb, such as gentrification and economic trends. A one-percent increase in Airbnb listings is causally associated with a 0.018 percent increase in rental rates and a 0.026% increase in house prices, other researchers argue. 


“In aggregate, the growth in home-sharing through Airbnb contributes to about one fifth of the average annual increase in U.S. rents and about one-seventh of the average annual increase in U.S. housing prices,” say researchers Kyle Barron, Edward Kung and Davide Proserpio


In contrast, annual zip code demographic changes and general city trends contribute about three fourths of the total rent growth and about three fourths of the total housing price growth.


“These results translate to an annual increase of $9 in monthly rent and $1,800 in house prices for the median zipcode in our data,” they say.


The biggest impact comes if a long-term rental unit is converted to a short-term rental unit on a full-time basis, as that subtracts one living unit from the long-term rental stock. On the other hand, an owner-occupied home that rents a room in that house does not do so.


Thursday, January 28, 2021

Why Some Service Providers are More Positive on Fixed Wireless Than Others

Connectivity provider strategy choices virtually always are a combination of necessity and opportunity; constraints and advantages. Consider the view T=Mobile, Verizon and AT&T have about upside from 5G fixed wireless. T-Mobile is arguably the most bullish; Verizon is hopeful but AT&T is a skeptic. 


Sometimes choices are dictated by political choices. In any effort to win approval of its merger with Sprint, T-Mobile promised to supply fixed wireless home broadband service to 10 million homes by 2024. AT&T likewise uses fixed wireless (generally using its 4G platform) as part of a commitment to rural broadband--and receipt of government support funds--it made in 2015.


Neither of those moves is necessarily driven by a strict profit-and-loss or revenue growth motivation. For T-Mobile, the fixed wireless commitment was essentially a bargaining chip to win government merger approval; for AT&T a way to honor a commitment made to get rural broadband funding. 


In other cases, though, market positioning dictates relative financial opportunity and therefore different strategies. T-Mobile, for example, has zero share of the roughly $115 billion annual revenues fixed network broadband access market. 


AT&T has about 14.6 percent of the U.S. installed base of broadband customers. Verizon has less than seven percent of the installed base. 


Compare that to Comcast, which has nearly 29 percent of the installed base, and Charter, which has 27 percent of the installed base. 


AT&T in the third quarter of 2020 had about 11 percent share of the new customers, while Verizon got seven percent of the new accounts. 


In large part, those  fixed network broadband figures are based on relative opportunity, as well as customer preferences. 


Comcast has (can actually sell service to ) about 57 million homes passed.


The Charter Communications network passes about 50 million homes, the number of potential customer locations it can sell to.


Verizon homes passed might number 18.6 to 20 million. To be generous, use the 20 million figure. 


AT&T’s fixed network represents perhaps 62 million U.S. homes passed. CenturyLink never reports its homes passed figures, but likely has 20-million or so consumer locations it can market services to. 


T-Mobile has not historically been in the fixed network home broadband business and has passed zero homes. 


So what percentage of total homes does each provider pass? According to the U.S. Census Bureau there are about 137.9 million U.S. housing units.


Roughly 8.8 percent of units are not occupied, typically. Vacant year round units represented 8.8 percent of total housing units, while 2.6 percent were vacant for seasonal use. 


Add it all up and 88.6 percent of the housing units in the United States in the first quarter of 2020 were occupied and 11.4 percent were vacant, according to the U.S. Census Bureau. 


Still, the addressable market therefore is about 138 million locations. Comcast passes perhaps 41 percent of U.S. homes; Charter passes perhaps 36 percent; AT&T passes possibly 45 percent of home locations while Verizon passes perhaps 14 percent, best case, and many of those locations are high-rise buildings where fixed wireless might not be the best access medium. 


So one way to look at 5G fixed wireless is the ability to take market share away from other providers. T-Mobile can win the most, in the sense that it can grow from zero share to some share. 


Charter and Comcast have market share that is outsized in comparison to their homes passed totals, getting roughly 70 percent of the potential market as customers. 


Verizon’s opportunity is dictated by geography. It has the smallest geographic footprint of any of the other tier-one suppliers. That means the use of its nationwide 5G network to supply home broadband gives it reach to most of the country it cannot presently serve. 


Aside from T-Mobile--which has zero fixed network share or network--Verizon has the greatest potential account upside from providing services outside its fixed network footprint. 


AT&T, on the other hand, already covers the greatest percentage of U.S. homes, and therefore has the most to lose from competitors, followed by Comcast and Charter. Verizon and AT&T earn relatively little from their fixed network customers and therefore are most interested in their mobile customer bases, which provide virtually all the incremental revenue growth for each firm. 


Still, the ability to use the 5G mobile network to attack the home broadband market is interesting to T-Mobile and Verizon for reasons related to geography. 


T-Mobile is solely a wireless provider, has no retail fixed network and therefore stands to gain by taking share in the former fixed network broadband business. Verizon has the most-limited geographic footprint of any of the other providers, and therefore has the most to gain from out-of-market share gains in the fixed wireless space. 


Comcast and Charter remain focused--even for mobility services--on customers in their own regions and areas of service. Operations out of existing markets continue to hold little--if any--appeal. 


Some cable companies who operate in rural areas have said they will use fixed wireless rather than hybrid fiber coax or fiber to the home as an access technology in lower-density areas they might be able to reach using wireless. 


The point is that tier-one service provider interest in 5G fixed wireless depends on their assessment of relative financial upside; in some cases regulatory postures; to a great extent existing and possible market share in home broadband and relative expectations about revenue contributions from fixed network services generally.


AI Wiill Indeed Wreck Havoc in Some Industries

Creative workers are right to worry about the impact of artificial intelligence on jobs within the industry, just as creative workers were r...