Showing posts sorted by date for query openvault. Sort by relevance Show all posts

Sunday, October 29, 2023

What's "Average" in Home Broadband?

As with most anything relating to the internet, “median” or “average” figures often do not reveal as much as we believe, since a relatively small percentage of heavy users exists with larger percentages of light users, along with lots of users somewhere in the middle. 


As a  broad generalization, we might characterize user behavior for any particular app, internet usage in general or data consumption as coming in three buckets.


Consumption

Percentage of users

Heavy

20%

Average

60%

Low

20%


According to data from OpenVault and Ookla, which track internet usage data from millions of broadband customers around the world, heavy users in the U.S. market are defined as those who consume more than 1.2 terabytes of data per month.


“Average” users consume between 300 gigabytes and 1.2 TB of data per month, while light users consume less than 300 GB of data per month. 


As an approximation, home broadband consumers also purchase different tiers of service based on their consumption profiles. The price variance generally is highest for the “heavy” users, where the cost of 1-Gbps service commonly ranges up to about $90 a month, with higher speeds of 2-Gbps, for example, up in the $110 to $125 per month range. 


Consumption

Speed tier

Monthly price

Heavy

2 Gbps or faster

$100-$150

Heavy

1 Gbps

$75-$100

Average

500 Mbps

$50-$75

Low

250 Mbps

$25-$50


Current pricing levels cites by big U.S. internet service providers tends to support the notion of “average” levels of demand with average prices for supplied service. 


AT&T Home Broadband ARPU

Q3'22

Q4'22

Q1'23

Q2'23

Q3'23

Y/Y Growth

Fiber

$62.62

$64.82

$65.92

$66.70

$68.21

8.93%

Non-Fiber

$54.80

$55.54

$56.00

$56.71

$60.43

10.27%

Total Broadband ARPU

$58.63

$60.31

$61.31

$62.26

$64.91

10.71%


Quarter

Comcast ARPU

Charter ARPU

Year-over-year growth rate

Q3 2022

$80.67

$66.10

N/A

Q4 2022

$82.34

$67.75

2.5%

Q1 2023

$83.91

$69.40

4.9%

Q2 2023

$85.48

$71.05

7.4%

Q3 2023

$87.05

$72.70

9.9%


Friday, October 20, 2023

T-Mobile Probably Can Compete for 25% of the Home Broadband Market

A new Ookla report on mobile speed performance cites T-Mobile’s 5G network at 221 Mbps downstream. Compare that to Ookla’s average for fixed network internet service provider speeds at 213 Mbps. 


To the extent that T-Mobile’s fixed wireless service can attain such speeds, it arguably would be faster than the typical home broadband service purchased by, and experienced by consumers. 


That does not mean home broadband providers are not, in many instances, able to sell faster services in the gigabit ranges, for example. It simply is not a service “most” consumers of home broadband are buying, right now. 


Looking at U.S. customer behavior, it appears that about 25 percent of the market is willing to buy service that tops out at about 200 Mbps. If T-Mobile can boost fixed wireless speeds to about 400 Mbps, it could appeal to about 60 percent of U.S. customers. 


source: OpenVault 


Friday, September 29, 2023

5G Fixed Wireless Probably Appeals to about 25% of the U.S. Home Broadband Market

Verizon reports that its fixed wireless customers are using about 300 Gbytes of data per month. T-Mobile, meanwhile, has reported that in 2022 its fixed wireless customers were using an average of 478 GB of data each month.  


According to OpenVault, the average usage by home broadband users is about 567 GB per month. 


source: OpenVault 


One might point out that such levels of fixed wireless usage are characteristic of more than 60 percent of the whole U.S. market. If one assumes that a fixed wireless connection will tend to run no higher than about 200 Mbps, then fixed wireless arguably appeals to about a quarter of the U.S. home broadband market. 


source: OpenVault 


Saturday, August 26, 2023

Customers Buy What They Want, When They Want It

Some “debates” never seem to go away. Some decades ago, an engineering vice president quipped that “fiber is the future,”  followed after a short pause by “and always will be.” 


The humorous point was that customers make concrete choices under concrete circumstances that often defy our notions of “what is better” or “what they should buy.” 


The success of 5G fixed wireless and cable hybrid fiber coax alternatives to digital subscriber line probably comes as no surprise to anybody. But the actual choices consumers make, when fiber to home, hybrid fiber coax and other alternatives are available might confound technologists who believe “fiber is always the answer.”


In fact, consumers make choices that suggest that is not automatically true. Most telcos (perhaps all) have found that after marketing for several years against hybrid fiber coax, they tend to get about 40 percent adoption (four homes out of 10 will buy). 


So something other than “performance” is at work.  Rather obviously, a substantial number of customers believe the product version that makes most sense is a “good enough” product for a “reasonable price” For perhaps half the market, that means whatever commercial service offering speeds “in the middle” and also “prices in the middle” of all offers, low to high. 


Data from OpenVault consistently suggests this is the case. 


source: OpenVault 


Physical media matters, since not every platform has the ability to keep scaling bandwidth into scores-of--gigabit-per-second ranges, either symmetrical or not. 


But consumer demand also matters, as even when the difference between the fastest tier and the slowest tier is two orders of magnitude, most customers will likely keep buying speeds in the middle, about one order of magnitude below the “fastest” tier of service, and one order of magnitude above the lowest tier of service. 


Internet service providers often need to offer speed that is “good enough,” at prices that also are viewed as reasonable, to remain viable for half the market. But it might always be the case that up to 25 percent of the market will buy even a “slower speed” service if the pricing is right.


Even as speed requirements continue to grow, demand for “slower but affordable” and
“Good enough at a reasonable price” should both remain viable segments of the home broadband market.

Tuesday, August 22, 2023

What Affordable Connectivity Program Stats Might Suggest for Internet Access Demand

What business conclusions might be drawn from news that 20 million accounts now are active as part of the Federal Communications Commission’s Affordable Connectivity Program? Probably a quarter of the customer base will prefer to buy less-costly, lower-performance services.


That has immediate business implications for suppliers of fixed wireless services and all internet service providers able to sell lower-speed services at lower prices.


Consider that there are about 123 million to 127 million “consumer and small business” accounts included in counts of “home broadband” subscriptions. 


By most estimates, small businesses represent between 10 percent and 12 percent of those “home broadband accounts.” So for purposes of evaluating the consumer portion of the home broadband market, consider that there might be at least 111 million active accounts, using the FCC’s latest figures. 


If 20 million of those accounts qualify for ACP support, then about 22 percent of the home broadband buyer base is likely to opt for less-expensive service plans. 


Home Broadband Accounts

Small Business Accounts

Study

Year Published

Publishing Venue

126.8 million

15.9 million

Federal Communications Commission (FCC)

2022

FCC

125.1 million

15.5 million

BroadbandNow

2023

BroadbandNow

123.4 million

15.2 million

Statista

2023

Statista


Those figures do not include customers who opt to use mobile internet access as their only form of home internet access. Keep in mind that home broadband accounts are based on service to locations, where mobile-only internet access is based on service to persons. 


If the total U.S. population is about 340 million, and 88 percent of adults use mobile phones, that implies fewer than 299 million mobile phone users. Assume 15 percent of phone customers do not buy an internet access plan for their phones. Assume 10 percent of the population is too young to use a mobile subscription. 


That might imply only 224 million mobile internet access accounts in service. Then further assume 12 percent of phone users rely exclusively on their mobile phones for internet access. That might represent up to 27 million accounts. 


If half of those accounts might consider getting a lower-speed, lower-cost home broadband service, and if half of those live in the same household, then about 6.8 million additional accounts might, in principle, be added to the ranks of potential home broadband buyers.


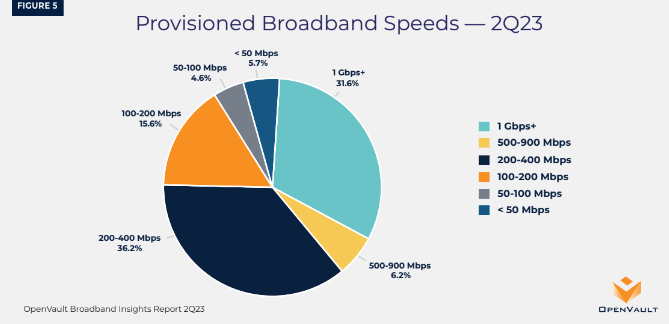
So possibly 27 million home broadband accounts might be, in principle, candidates for lower-cost services, or about 24 percent of all homes. That is consistent with OpenVault findings that about 26 percent of U.S. customers buy home broadband at speeds of 200 Mbps or lower. 


source: OpenVault 


So one might argue that about a quarter of the home broadband market is value oriented,a  third is performance oriented and the rest are in the “reasonable speed for reasonable price” middle portion of the market. 


Mobile Exclusive Internet Access

Study

Year Published

Publishing Venue

15%

Pew Research Center

2021

Pew Research Center

13%

Federal Communications Commission (FCC)

2022

FCC

12%

BroadbandNow

2023

BroadbandNow

11%

Statista

2023

Statista


Households are eligible for the CP if the household income is at or below 200% of the Federal Poverty Guidelines, or if a member of the household meets at least one of the criteria below:

  • Received a Federal Pell Grant during the current award year;

  • Meets the eligibility criteria for a participating provider's existing low-income internet program;

  • Participates in one of these assistance programs:

    • Free and Reduced-Price School Lunch Program or School Breakfast Program, including at U.S. Department of Agriculture (USDA) Community Eligibility Provision schools.

    • SNAP

    • Medicaid

      • Your Medicaid eligibility may be up for renewal. Learn more about how to renew.

    • Federal Housing Assistance, including:

      • Housing Choice Voucher (HCV) Program (Section 8 Vouchers)

      • Project-Based Rental Assistance (PBRA)/Section 202/ Section 811

      • Public Housing

      • Affordable Housing Programs for American Indians, Alaska Natives or Native Hawaiians

    • Supplemental Security Income (SSI)

    • WIC

    • Veterans Pension or Survivor Benefits

    • or Lifeline;

  • Participates in one of these assistance programs and lives on Qualifying Tribal lands:

    • Bureau of Indian Affairs General Assistance

    • Tribal TANF

    • Food Distribution Program on Indian Reservations

    • Tribal Head Start (income based)


All of those criteria are associated with lower income levels.


AI Will Improve Productivity, But That is Not the Biggest Possible Change

Many would note that the internet impact on content media has been profound, boosting social and online media at the expense of linear form...