Thursday, February 20, 2014

EE Says It Doesn't Compete with Over the Top Messaging

While the decline of voice and text messaging prices is not welcome in the mobile business, and though the pace of decline matters greatly, not every executive, at least in public, is excessively worried about the maturation of traditional products.

The acquisition of WhatsApp by Facebook, for example, does not worry Olaf Swantee, EE CEO. That public calm is possible because EE does not rely on text messaging revenues to drive its growth, Swantee insists.

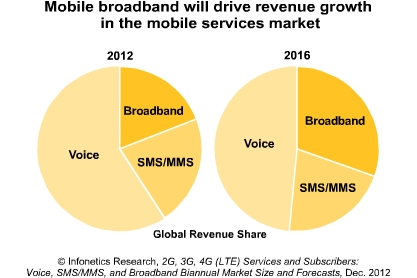
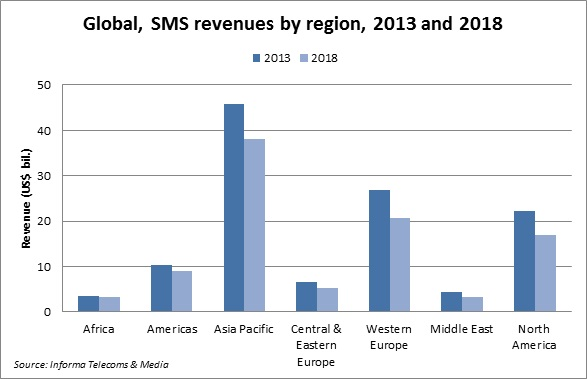
That is an optimistic prediction, when text messaging still drives about a third of revenue growth for a mobile service provider, and represents scores of billions of revenue.


“It is not something we need to compete with,” said Swantee about over the top messaging, pointing out that EE revenue growth is driven principally by the acquisition of additional postpaid mobile service contracts and mobile data plans.

“SMS revenues and usage will come down over time,” Swantee said.

WhatsApp recorded an all-time high of 10 billion outgoing messages in a single day in June 2013, which equated to an average of more than 30 messages per user per day, according to Stephen Sale, Analysys Mason principal analyst.

“We estimate that the total volume of messages sent from mobile devices via IP services exceeded the volume of SMS messages for the first time in 2013, at more than 10.3 trillion compared with 6.5 trillion worldwide,” said Sale. “Messaging volumes associated with OTT services are expected to almost double in 2014 and will reach 37.8 trillion messages sent in 2018.”


“It is only a matter of time before SMS services are dislodged from their current default position on smartphones,” said Sale.

                                Mobile Messaging Forecast

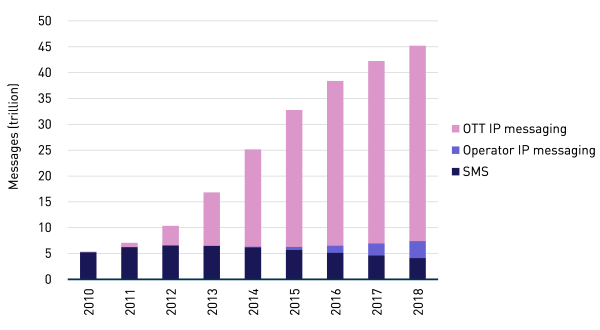
On the other hand, EE revenue growth clearly is weighted towards account gains and mobile broadband. Data and messaging revenues reached 56 percent of total EE average revenue per user in the fourth quarter of 2013, compared to 50 percent of total revenue in the fourth quarter of 2012, with data (non-text) revenue up to 44 percent of ARPU compared to 34 percent in the fourth quarter of  2012, EE says.

EE also says its 4G customer base grew 68 percent from the third quarter of 2013 to the fourth quarter of 2013.

After adding 194,000 postpaid net adds in the fourth quarter of 2013, 58 percent of the EE customer base now is postpaid, excluding machine-to-machine (M2M), delivering six times more ARPU than prepaid.

The prepaid base meanwhile dipped 543,000, EE says.

How Much Will Facebook-Owned WhatsApp Reduce Carrier Revenues?

Facebook’s acquisition of WhatsApp immediately makes Facebook a major provider of fast-growing social messaging (over the top messaging) services globally. Precisely how much the acquisition will affect market dynamics (though intended to benefit Facebook)  is less clear.

Over the top messaging might grow at triple-digit rates in 2014, and at least some of that activity shifts user behavior. Where people might have sent text messages, they now send OTT messages (social or instant messages).

Among the key metrics are revenue and usage, with the caveat that over the top messaging revenue models normally are indirect. Volume is easiest to depict.

“The social messaging market is growing rapidly, with messaging volumes to reach 69 trillion with subscribers growing to 1.8 billion by the end of 2014,” says Eden Zoller, Ovum principal analyst.

Perhaps as significant ar the growth rates. OTT messaging traffic was about 27.4 trillion in 2013, and will grow at 300-percent rate and will grow at a triple digit rate in 2014, Ovum estimates.
Operator-based mobile messaging traffic (short message and multimedia messaging) volumes will peak in 2014 with 7.7 trillion messages, declining in 2015 to 7.6 trillion messages, Ovum also estimates.

It might be easy enough to predict that the text messages WhatsApp actually cannibalizes are high-cost international messages.

That has been true of Skype, the classic example of an over the top voice calling app. Such new apps get used first when the cost of carrier-provided messaging or voice is high. In the same way, WhatsApp likely directly substitutes for international text messages.

Domestic use is more complicated, and likely represents activity that would not have occurred at all. So most OTT messaging probably is largely incremental activity, not a direct substitute for text or multimedia messaging at all.

But it would be reasonable enough to conclude that the revenue impact on mobile service providers will be to cap revenue growth, as users needing to send international text messages will shift to use of OTT apps such as WhatsApp.

That doesn’t necessarily mean international texting revenue will halt, only that it will grow less robustly, as has been the case for international voice. Also, to the extent that the base of users continues to grow, more text messaging users and revenue-generating units will be added to the universe of customers.

The impact on usage in some ways is clearer: OTT messaging volumes will grow.

As always is true, users have multiple ways to communicate, and use of OTT messaging will at least indirectly reduce the volume of messages sent other ways.

Text messaging will generate more than $100 billion in 2014 revenue for mobile service providers, about 50 times the total revenues from all over the top messaging services.

The volume of OTT messages is substantial, with Deloitte analysts estimating that 50 billion OTT messages will be sent every day, compared to 21 billion text messages. But, as with everything Internet, volume and usage is not revenue.

Some observers have estimated that OTT messaging in 2013 cannibalized $32 billion in SMS revenues. But such extrapolations tend to quantify such developments by assuming that nearly all the incremental OTT messages would have been sent using SMS.

In most cases, especially international messaging, the alternative would have been “no message sent,” or use of some other communications mode.

A Facebook-owned WhatsApp likely will help cap potential revenue growth for carrier-provided messaging services, in part by reducing usage, in part by forcing carriers to merchandise texting services (reducing both aggregate revenue and profit margin).

Wednesday, February 19, 2014

Google In Talks with 9 Cities about Google Fiber


Fiber MapGoogle says it is in discussions with  34 cities in nine metro areas around the United States about launching Google Fiber in those communities.


When Will Sprint Get Back on Track?

SoftBank might face a bigger problem than it originally forecast, as it positions Sprint for a run at significantly-higher market share. Most expected Sprint to launch a price-heavy assault on U.S. tariffs and other attributes of the mobile experience. 

But T-Mobile US already has moved to unsettle the market, meaning any future Sprint assault would have to contend with T-Mobile US.

To be sure, Sprint has had other issues. It had the Nextel shutdown and Network Vision transition. Either would have introduced some turbulence. But the point is that the last two years have seen the two largest national competitors continue their market share growth, while T-Mobile US unexpectedly began to grow in 2013. 

sprint title chart feb 2014.png

In many ways, the United States is an ideal telecommunications market, representing both higher spending by a typical customer and higher ability to spend, per customer. So Sprint cannot be counted out, especially once it has put the Nextel shutdown and Network Vision transitions behind it.

But it might not be as easy as SoftBank once would have hoped. 
                                     
The US a rich country that spends heavily on telecoms feb 2014

100% Price Increases for Video Subscriptions Cannot Continue Indefinitely

Disruption on a major scale of the U.S. video entertainment ecosystem seems highly unlikely, for the moment, despite building pressures that suggest the current pattern cannot last forever.

Virtually every observer notes that U.S. cable TV prices have grown at least 100 percent over a decade, at least double the underlying rate of inflation, as measured by the consumer price index.


Many would rationally argue that cannot continue for decades more, as the value-price relationship will grow unappetizing. 

Should current rate increases prevail, in 10 years a typical consumer could be paying $200 to $300 a month for the equivalent of today’s “expanded basic” package, while other prices grow less than 33 percent over a decade, and possibly less.

Perhaps enough value will be added that such prices are deemed reasonable. But many would argue that seems unlikely.

Since 2000, the U.S. consumer price index (which excludes housing prices)  increased by about 34 percent, while another index, the “Everyday Price Index,” which includes such costs, shows a 57 percent increase between 2000 and 2012.

Even using the EPI figures, cable TV prices have grown nearly twice as fast between 2001 and 2011 as average consumer prices, and as much as three times as much by some standard measures, for example.

Video prices subscription prices In Multnomah County, Oregon, for example, grew by about 100 percent from 2000 to 2011, exceeding the background consumer price index and the everyday price index.

Some might point to services such as Netflix, available for roughly $10 a month, and compare that to an HBO subscription, which might cost $15 a month, and see a way for single channels to be sold at retail for about $10 to $20 a month on a stand-alone, streamed basis.

If similar economics prevailed for most networks generally, whether any given subscriber is better served buying a la carte, or buying a subscription, hinges on the number of channels or programs normally viewed.

If single channels could be purchased for $15 a month, then a consumer now paying $90 a month would break even at about six channels. A household habitually viewing more than six channels still would come out ahead simply buying a bundled subscription. But nobody really knows what economics of unbundled channel access actually would emerge.

Some argue that essentially little change would occur, and that typical households might wind up paying about the same amount each month, in an unbundled scenario where customers can buy channels one by one.

Studies by the Federal Communications Commission are inconclusive about whether unbundling would, or would not, save money. One of the studies suggested  “consumers that purchase at least nine networks would likely face an increase in their monthly bills” when buying a la carte.

Likewise, one of the studies suggested bill increases ranging from 14 percent to 30 percent under a la carte, while the other suggests a consumer purchasing 11 cable channels would face a change of bill ranging from a 13 percent decrease to a four percent increase, with a decrease in three out of four cases.

The point is that it is very hard to tell, conclusively, what might happen if providers shifted to a la carte viewing. 

Nor, given content owner preferences and contract clauses, are we likely to find out very soon. 

In truth, video distributors have little discretion about where to place channels (most contracts for ad-supported channels require placement on the most-viewed tier of service), and no freedom to sell any channel a la carte.

But the system has to break at some point.


source: FCC

Tuesday, February 18, 2014

Internet Fragmentation or Just Routing Changes?

There has been concern expressed for at least a decade that the “Internet” is becoming less “open” than it once was, and the reality is that such concerns are legitimate. “National” Internet restrictions are relatively common, and there now is the added concern in some quarters about ways to prevent traffic from crossing into the United States, because of privacy and spying concerns.

But the issues are relatively more complicated than sometimes stated, in part because virtually all networks are moving to use of Internet Protocol, but not all IP networks are part of the public Internet. Many private networks exist that are functionally and statutorily not part of the Internet, or the public network.

Enterprise networks and video entertainment services provide prime examples. But there are nuances; lots of them.

Some have suggested that Brazil, which wants more domestic Brazilian application activity, to reduce its reliance on U.S.-based applications, represents one form of  a “fracturing” of the Internet.

In practice, the Internet has been moving that way for some time, both in terms of language-differentiated apps and services, as well as content regulation. 

Still, in part there also are moves which are strictly at the physical layer, such as creating more in-nation infrastructure or more in-region infrastructure. Such efforts might not actually represent direct fragmentation at the application layer, but only routing efficiency.

Some might say a call to keep more “intra-German” traffic flowing “within Germany” is precisely that sort of thing, and not some wider fragmentation of the Internet in Germany, as some seem to suggest.

The main problem is that it is harder than sometimes supposed to confine data in such ways. Modern webpages are assembled, not simply “accessed” whole. A story on a news site might have  Facebook “Like” buttons, a Google+ “+1″ button and a Twitter button, for example, making it harder to ensure that all data remains exclusively contained on national networks.

Still, changes in routing and fragmentation of the Internet are conceptually distinct; one does not necessarily represent the other.


Mobile Data Consumption Will Grow an Order of Magnitude in 5 Years

Global mobile data traffic to reach almost 13.5 terabytes per month in 2018, iGR forecasts, propelled by a combination of more mobile data users and higher consumption by each user.


The iGR estimate is that, in 2013, approximately 1.4 million terabytes of mobile data traffic flowed over the world’s cellular data networks per month, and by 2018, iGR forecasts mobile data traffic will rise to 13.5 million terabytes per month.


Few would be surprised by such forecasts. Cisco has estimated global mobile data traffic grew 81 percent in 2013, reached 1.5 exabytes per month (1 exabyte is 1,048,576 terabytes)
at the end of 2013, up from 820 petabytes per month at the end of 2012.


What might be more relevant is the contribution various types of devices will have, as drivers of total data consumption. Notebooks and tablets represent higher rates of usage, but smartphones are more prevalent.


Smartphones will be the devices driving the overwhelming majority of data traffic, Cisco predicts.


Generative AI Might Create the Next Digital Real Estate

To the extent that generative artificial intelligence could enable the creation of rivals to search, and improve search, it also creates mon...