Wednesday, April 30, 2014

Consumers Have No Idea How Much They Would Buy of a Product That Isn't Available

Steve Jobs famously maintained that one could not predict consumer demand for a product they never had seen, which is one reason why Jobs never put stock in consumer research.

Likewise, one might argue, all present estimates of the amount of video subscription service “avoided” by consumers is nearly meaningless for predicting consumer behavior in some future market.


The reason is simply that It is difficult to measure demand for  a product that is not available yet.


A November 2013 survey by Verizon Digital Media Services found significant consumption of non-linear video by Millennials, something that likely is surprising to nobody.


source: eMarketer
The survey found 13 percent of Millennials making do without any linear TV service, while some nine percent of other people did so.


But the important questions of whether consumers will pay for some future form of on-demand video, and how much, cannot be determined on the basis of present consumption, since the content many would pay for is simply not available.


But there are other issues as well. At present, one reason many Millennials do not buy linear TV services is actual lack of interest in the value proposition. Some simply do not believe they need to have access.

Others might do so if the value-price relationship were different. In fact, if the price-value relationship changes, it is possible that behavior could shift significantly.


Friday, April 25, 2014

Mobile Internet Providers in Asia Face Demand Uncertainty

Source: Asiabriefing
One of the great challengers mobile service providers face in much of Asia is how much demand there will be, in the future, for mobile Internet access, and how to supply that demand at prices users can afford.

The other problem is that present trends might not predict future behavior.

Mobile data consumption patterns in Asian countries might show “mean” (arithmetic average) of about a gigabyte a month, but the median (half use more, half use less) consumption is more on the order of 300 MB to 400 MB.

On the other hand, present consumption trends are likely skewed by use of mobile devices or dongles to support PC usage. Also, usage is further skewed by users in some countries, compared to others, as Nielsen data suggests.

In the Asia-Pacific region, about one percent of subscribers account for 29.2 percent of upstream traffic and 18.5 percent of downstream traffic, as well as 18.7 percent of aggregate bytes each month, Sandvine reports.

So “average” consumption is skewed by dongles or tethered access to support PC operations.
Smartphone data consumption patterns arguably are quite different, at least for the moment.

Still, Ericsson predicts, smartphone usage could approach a gigabyte a month for smartphone users in Asia by about 2016.
Source: Statista, Sandvine

To be sure, even those patterns do not tell us much about how demand will change as more Asian users get smartphones and start to consume more data.

And patterns could be quite different between the more developed and still developing parts of the mobile market.

But it would be a reasonably safe bet that consumption will grow to match developed Asian norms, over time, even if not at quite identical volumes.

Nearly half of all the data was consumed by video features and apps, according to Sandvine’s second half 2013 report. And, without, a doubt, appetite for video is going to be key.

So unless one wishes to argue that consumers in South Asia and Southeast Asia will not consume much video entertainment, something few likely would be willing to build a business plan upon, demand eventually is going to grow to gigabytes a month.

Mobile ISPs therefore are going to have to craft new strategies to stimulate and supply demand at prices consumers can afford. That is always a challenge in any developing market, of course.

But it will be an important challenge to supply networks that match expected demand, with infrastructure costs as much as an order of magnitude or two orders of magnitude cheaper than is possible today, using traditional mobile or fixed networks.

Present forecasts likely are unable to capture the non-linear development of Internet access in the region, though. The shift from feature phones to smartphones, role of new access platforms, relentless development of affordable smartphones and even the rates of growth in household income all are going to render today’s assumptions incorrect.


Netflix Speed on Comcast Network Improves 65%

In the US, the average speed on the Comcast network for Netflix streams grew 65 percent, from 1.51 Mbps in January 2014 to 2.5 Mbps in March 2014, after the two firms agreed to interconnect directly.


Though speed and packet delay are two different issues, it arguably is the case that unpredictable packet arrival times cause more quality disruption of video streams than absolute bandwidth. 


Direct connections, caching and use of content delivery networks are a few of the standard ways ISPs and app providers work to ensure better end user experience. 


New proposed Federal Communications Commission network neutrality rules intend to allow voluntary commercial agreements between ISPs and app providers to extend content delivery networks all the way to the end user, where today CDNs operate over the backbone networks, but not in the access network.


The boost in Netflix performance on Comcast, after the direct connection, suggests that such techniques do matter, especially for voice and video services.

Google Aiming at Municipal Wi-Fi Again?

Google's direct revenue model scales almost in linear fashion with the number of people using the Internet, in large part because Google apps represent such a huge share of user engagement time with Internet apps.


That is why Google now appears to be considering deploying Wi-Fi networks in towns and cities served by Google Fiber. The new Google Wi-Fi effort obviously would leverage infrastructure assets Google Fiber has created. 


In fact, about 60 percent  of all Internet end devices and users exchange traffic with Google servers during the course of an average day, according to Deepfield.


That finding is based on all traffic from computers, mobile devices, game consoles, home media appliances and other embedded devices. Google’s device share is much larger if traffic  from computers and mobile devices, and not the other devices, is considered.


Google analytics, hosting, and advertising play some type of role in over half of all large web services or sites, according to Deepfield.


Since 2010, in fact, Google represented just six percent  of Internet traffic. In 2013, Google accounted for nearly 25 percent of Internet traffic on average.


Only Netflix represents a larger share of total bandwidth, but Netflix peaks last only for a few hours each evening during prime time hours and during Netflix cache update periods in the early morning.


The point is that Google revenue grows as the base of Internet users grows.


Those facts explain why Google Fiber exists, why Project Loon exists, why Google owns assets in the solar powered drone business, why Google has experimented with municipal Wi-Fi, is the new provider of Wi-Fi for Starbucks in the United States, created Android and Nexus.


Ubiquity of Internet access also is why Google has invested in spectrum or firms owning spectrum, for the purpose of providing Internet access. 


Thursday, April 24, 2014

What Will New Network Neutrality Rules Bring?

No blocking of lawful content has been U.S. Federal Communications Commission policy since 2005, and a policy guide since 2004. Transparency likewise has been policy since 2005.

In 2010, the FCC added new network neutrality rules that eventually were struck down in the courts, largely because the court ruled the Commission did not have authority to issue the rules, which essentially mandated that nothing but “best effort” Internet access could be provided by any fixed network Internet service provider.

Though much hinges on the details, FCC Chairman Tom Wheeler argues that the original principles still will be reflected in the new proposed rules. As always before since 2004, the new rules will specify that no lawful content can be blocked and that ISPs must act transparently in making information about terms and conditions of service, as well as network management policies, available to subscribers.

The new arguably new interpretation to the original rules is that “ISPs may not act in a commercially unreasonable manner” by favoring their own applications and services. In the past, that notion has more strictly insisted on “best effort only” delivery of all Internet traffic.

You can make your own judgments about whether the new proposed rules simply affirm the older rules, or in fact actually change them.

Opponents of the proposed rules will argue that the FCC’s new network neutrality rules actually change the concept dramatically, allowing ISPs to negotiate with app providers for quality of service guarantees that were prohibited before.

The new rules presumably will establish both a baseline for best effort Internet traffic, as well as allowing for voluntary commercial agreements with content and app providers to provide quality of service mechanisms like those provided on the backbone of the network by content delivery networks such as Akamai.

In that one sense, the new network neutrality rules actually can be viewed as changing the key provision of the older network neutrality rules, namely that all packets would receive “best effort only” delivery.

The new rules presumably will allow managed services--content delivery networks to the end user location--so long as all applications can purchase such features on the same terms as any apps owned by the ISP itself.

So, oddly enough, though many considered network neutrality dead when the courts struck down the original rules, a resurrected network neutrality regime--though keeping the name--arguably implements just the policies the original framework aimed to implement.

Predictably, original net neutrality supporters will not like the change, while ISPs will be relieved.

Perhaps the way now is cleared for creation of any number of managed services that ensure the quality of video streaming and voice services using Internet delivery.

Apple, a user of content delivery services itself, wants just that from Comcast, for example.

We'll have to wait for issuance of the proposed rules to find out for sure. But it sure sounds as though a major change is coming.


What Impact on AT&T or Verizon from Marketing War?

Verizon, AT&T net mobile adds
Has the U.S. mobile marketing war finally begun to show in Verizon and AT&T financial performance? Not so much, at least not yet.

Operating results seem to be showing some pressure, but it is hard to distinguish background market maturation trends from the specific impact of T-Mobile US attacks.


AT&T first-quarter 2014 consolidated revenues of $32.5 billion represented growth of 3.6 percent. 

Verizon total operating revenues in first-quarter 2014 were $30.8 billion, a 4.8 percent increase compared with first-quarter 2013 and the company’s highest quarterly growth rate in the past five quarters.


The mobile segments of AT&T and Verizon face market maturity, of course, so slowing growth rates would not be unexpected. The issue is whether higher levels of competition are affecting mobile segment gross revenue, profit margins or subscriber gains.


Total Verizon mobile segment revenues were $20.9 billion in first-quarter 2014, up 6.9 percent year over year. AT&T reported seven percent mobile segment revenue growth.


Clearly, at the top line, it is hard to see any clear negative impact from higher levels of competition.


But there is a significant nuance in terms of mobile segment revenue sources. Verizon mobile service revenues in the quarter totaled $18 billion, up 7.5 percent year over year.


Retail service revenues grew 6.7 percent year over year, to $17.2 billion. That means device revenue was less than $3 billion of quarterly mobile segment revenue.


At AT&T, mobile service revenue grew service revenues grew about 2.2 percent, compared to four percent, in the same quarter a year ago.


In other words, Verizon is growing mobile service revenue about 4.5 percentage points more than AT&T is growing its own service revenue.


Verizon retail postpaid average revenue per account increased 6.3 percent over first-quarter 2013, to $159.67 per month.


On the other hand, mounting price competition seems to be hitting Verizon mobile profit margins.


In first-quarter 2014, Verizon mobile operating income margin was 35 percent and segment EBITDA margin on service revenues was 52.1 percent, compared with 32.9 percent and 50.4 percent, respectively, in first-quarter 2013.


In other words, Verizon profit margins dropped, year over year.


AT&T added many more net mobile subscribers than did Verizon in the first quarter, though. AT&T net additions increased by 1,062,000 in the quarter, led by 625,000 postpaid net adds and 693,000 connected device net adds, the strongest postpaid
growth in five years.


Verizon Wireless added 549,000 retail net connections, including 539,000 retail postpaid net connections, in the first quarter.


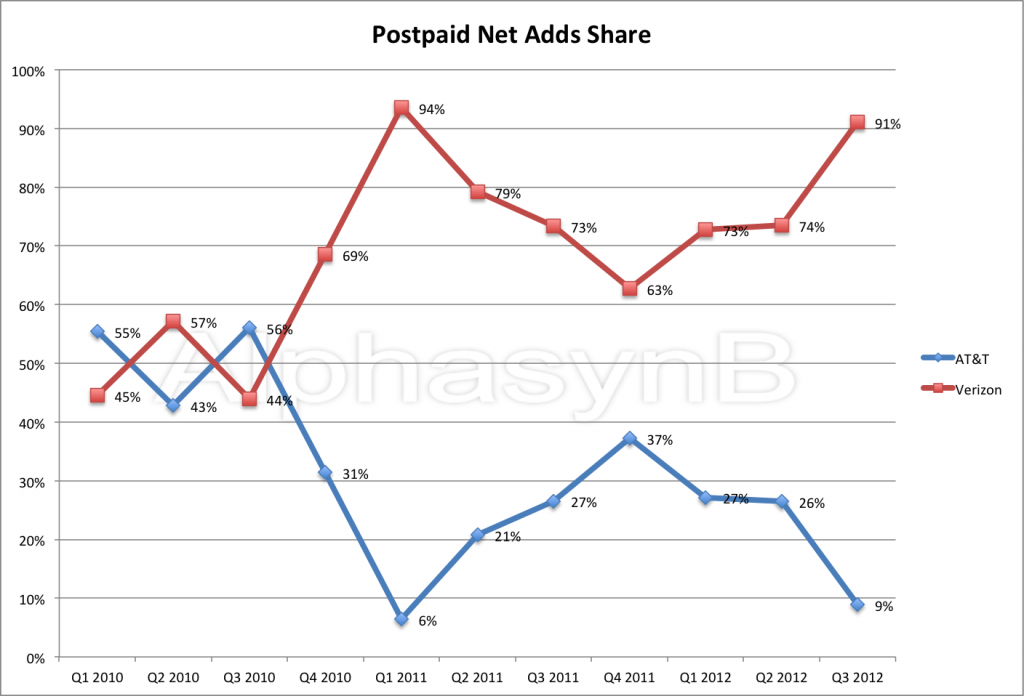
Those figures are significant because Verizon started to pull away from AT&T in the key net postpaid additions category about the fourth quarter of 2010.


And it appears that virtually all of Verizon’s first quarter net subscriber gains came from tablets, not phones.

Verizon added a net 539,000 retail postpaid connections, down from 720,000 net additions a year ago.

But Verizon signed up 634,000 net new tablet connections. In other words, Verizon lost net phone customers, though growing on the strength of tablet connections.

AT&T clearly is benefitting from tablet net additions as well.

Even after T-Mobile US reports its own quarterly earnings, we might not have a clear picture of what the marketing war is doing, both financially and operationally, in part because tablets now are fueling so much of the net subscriber growth at AT&T and T-Mobile US, in particular.

But the long term picture might not be so different from a scenario where T-Mobile US had not kicked off a marketing battle, Strategy Analytics has argued.

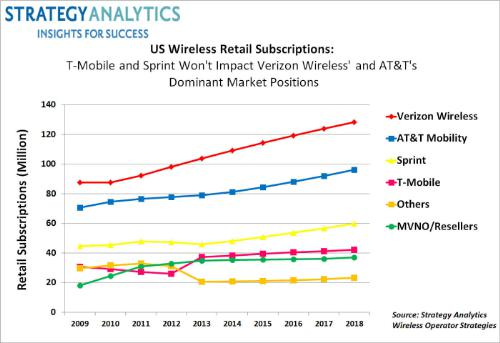
In fact, Strategy Analytics think the U.S. mobile market will remain stable through 2018, with little change in market share.

Among the top four carriers, Verizon Wireless stays on top and T-Mobile on the bottom, while only Sprint gains more than a percentage point in share, Strategy Analytics forecasts.


Wednesday, April 23, 2014

Global Internet Access Speeds Grow; Mobile Use Might be the Bigger Trend

World Internet Usage _Lg
source: zeroseven.com
Global average Internet connection speeds continued to improve in the fourth quarter of 2013, with a quarterly increase of 5.5 percent, reaching 3.8 Mbps, on average, according to the Akamai Technologies Fourth Quarter, 2013 State of the Internet report.

In the fourth quarter of 2013, average connection speeds on surveyed mobile network providers ranged from a high of 8.9 Mbps down to a low of 0.6 Mbps, Akamai says.

Average peak connection speeds above 100 Mbps were observed at several providers, while 3.1 Mbps was the slowest seen.

But it is the growth of mobile Internet adoption, more than the raw speed increases, that are most notable.

Based on traffic data collected by Ericsson, the volume of mobile data traffic increased by 70 percent from the fourth quarter of 2012 to the fourth quarter of 2013, and grew approximately 15 percent between the third and fourth quarters of 2013.

As always, “average” means little. Despite the improvement, half of the countries or regions listed among the top 10 in global average connection speeds actually saw small declines quarter over quarter.

Also, despite a 1.1 percent decline in average connection speed, South Korea held the top spot from quarter to quarter, reporting the highest average connection speed of 21.9 Mbps.

United States access speeds increased, on average, about two percent, leading to an overall average Internet access speed of 10 Mbps.

Overall, 133 countries or regions ended the year with higher average connection speeds than the year before, contributing to a speed increase of 27 percent  from the end of 2012.

Global average peak connection speeds recovered from a small decline in the third quarter of 2013 with improvement of 30 percent to 23.2 Mbps in the fourth quarter.

About 138 qualifying countries or regions, and all of the top 10, saw higher average peak connection speeds than in the third quarter.

Year over year, global average peak connection speeds increased 38 percent compared to the fourth quarter of 2012.

Quarter-over-quarter, the global broadband adoption rate grew 4.3 percent, with 55 percent of all connections to Akamai taking place at speeds of 4 Mbps or above.

Will AI Disrupt Non-Tangible Products and Industries as Much as the Internet Did?

Most digital and non-tangible product markets were disrupted by the internet, and might be further disrupted by artificial intelligence as w...