Sunday, January 1, 2017

Cable Operators Largely Drive U.S. Fixed Network Speed Increases

Competition in U.S. internet access markets, despite some concerns, seems to have spurred some of the most-aggressive speed upgrades ever. According to Ookla, U.S. fixed network access speeds have averaged more than 50 Mbps for the first time, ever.

Between 2015 and 2016, fixed network internet access speeds grew more than 40 percent.

One might be tempted to argue that it is gigabit access offers from Google Fiber, AT&T or Comcast and other cable operators that are driving the speed upgrades. That is unlikely. There simply are not enough actual gigabit customers to affect national trends. Where gigabit and other speeds are sold, it seems unlikely that more than single digits worth of customers actually buy.

Instead, the key shift is upgrades by cable operators, particularly upgrades into the hundred-megabit range.


Mobile speeds also have grown by more than 30 percent since 2015 with an average download speed of 19.27 Mbps in the first six months of 2016.

Overbuilder Model Remains Challenging

Though many have high hopes for the role of municipal or other types of public-private internet access ventures, competing as the third provider in an access market where cable companies and telcos already operate has always been a tough proposition.

Google Fiber is the latest, but hardly the only example. Overbuilders--as fixed network access providers competing against the incumbents are known--always have had a hard time sustaining their businesses because market share is so hard to wrest from the incumbents, despite episodic waves of enthusiasm for overbuilder business models of various types.

Though many think that is because of nefarious behavior on the part of incumbents, the big problem is simply the dynamics of market share in a three-provider fixed network market. Even assuming equal levels of skill and commitment, it has been very difficult for “number three” providers to wrest more than 20 percent share in any market.

That, in turn, “strands” a great deal (80 percent, potentially) of the network assets, and dramatically raises the “cost per customer.” For some key services, such as video entertainment, matters are even worse, as the competition also includes Dish Network and DirecTV (owned by AT&T), which further reduces the likelihood that any overbuilder offering video is going to get significant share.

Some believe Google Fiber, for example, got 10 percent or less of its Google Fiber internet access customers to buy its video service. If Google Fiber in some instances got 10 percent internet access market share, that implies video share of about one percent. And that is not sustainable.

And though some believe Google Fiber might be sold, that does not exactly square with the investment Google Capital recently made to acquire a stake in RCN and Grande Communications, two overbuilders that are being acquired by TPG, a private-equity firm. It would seem incongruous--if Alphabet really wanted to rid itself of Google Fiber--to simultaneously invest in other overbuild assets.

A decade and a half ago, a wave of overbuilders sprung up, with a fairly-standard argument about sustainability. By offering superior triple-play packages, overbuilders would be able to get 15 percent to 20 percent market share, eventually. At the top end of that range, and three anchor products to sell, the logic was sound.

Few have actually managed to hit that 20-percent market share level, though. Arguably, the few that have done so operate in markets where there are not, in fact, two strong incumbents (telco and cable). EPB in Chattanooga, Tenn., for example, is the poster child for overbuilder hopes, having gotten as much as 45 percent of consumer market share in its service area (with share defined as revenue-generating units, not “accounts” or “homes”).

EPB’s internet access share might be about 27 percent, its video share lower than that. An interesting statistic, in that regard, is that about eight percent of EPB’s internet access customers buy the gigabit service.

EPB’s market share is highly unusual in most overbuilder markets, as EPB arguably competes with Comcast, not AT&T, which has negligible video share in Chattanooga.

In a triple-play market, that is important. Comcast might have 61 percent video share, while EPB might have 36 percent share, leaving only three percent video share held by AT&T. Essentially, EPB has become the number-two provider, relegating AT&T to third place, something that is not the case in most other U.S. markets where three mass market fixed network suppliers compete.

The point is that the economics of overbuilding have been difficult for decades, which is why so few are attempted and why so few succeed.

As Google Fiber’s experience indicates, the overbuilder business model remains challenging, unless one of the incumbents essentially chooses not to fight.

Saturday, December 31, 2016

Why Mobile Video Might be So Important

Most U.K. consumers now buy at least parts of a bundle of services (internet access, voice, video, mobile), EY study found. Some 93 percent of U.K. broadband households now have some form of bundle, EY found. That same study also found that TV and mobile bundles score best in terms of satisfaction and loyalty.

That is an indicator of why Verizon, focusing more on becoming a mobile advertising platform for video services and app, and AT&T, which is more intent on becoming a force in mobile content delivery, are working on mobile content delivery systems. If the U.K. preferences wind up being seen in the U.S. market, then the “best possible” bundle will be video entertainment plus mobile service.

At the moment, the most-popular U.S. bundle likely is “internet access plus TV.” That is a preference parallel to “mobile plus TV,” with one twist. Where the most-popular fixed network bundle arguably is TV-and-internet, the most-popular mobile package could naturally become “mobile voice, mobile internet, mobile video,” for the simple reason that buying mobile internet access always comes with voice and messaging included.

In that sense, the “natural” mobile bundle is going to be “bigger” than the natural fixed line bundle, simply because purchasing mobile video will assume the presence of mobile internet access, which in turn presumes the customer also gets voice and messaging (the services are stacked upon each other).

That natural bundle also shows why mobility platforms might become even more powerful: they are the ultimate platform for bundling all ubiquitous consumer communications services and most ubiquitous apps.

The other study finding that reinforces all thinking about bundles is that 55 percent of consumers would buy a bundle “only” if it also represents a price discount. That is logical. Consumers and suppliers are used to the notion of volume discounts.

source: EY

Friday, December 30, 2016

Business Model, Not Technology, is Key to Mobile Substitution for Fixed Net Internet Access

As much as platform capabilities underpin mobile substitution for internet access, fundamental changes of business model are more important. In the U.S. market, for example, the packaging is quite different.

Mobile broadband is priced according to usage, generally in the form of buckets of use. Fixed internet access is priced based on speed (faster speeds cost more), but usage allowances are big enough that usage effectively is “unlimited.”

In other words, mobile retail packaging is based on usage, while fixed access is packaged on “speed tier.”

That poses a key problem for mobile service providers who want to encourage users to substitute mobile access for fixed access: packaging has to replicate what consumers presently expect. That means a shift away from “usage-based pricing” and towards “speed-based pricing” to a large extent.

Some glimmers of that already can be seen. As the tier-one mobile operators move to encourage consumption of video services on mobile devices, they increasingly are exempting data usage. That effectively “levels the playing field” where it comes to video entertainment service data charges.

When consumers buy a fixed network video service, they do not expect to be charged separately, and additionally, for bandwidth. They buy content, and use of the network is allowed. That is the new model mobile operators are moving towards. There are two different angles of that expectation.

When users consumer Netflix, Amazon Prime, Spotify or Pandora content over a fixed network, they do not worry about the impact on their data usage, as the fixed network plans are abundant enough that this is not a concern. So usage allowances that eliminate the need to worry about data usage are foundational.

Mobile operators provide that same sort of assurance by simply allowing consumption of some video services without imposing data usage charges.

Where mobile data might cost about $9 to $10 per gigabyte (GB), fixed access might cost as little as 15 cents per GB.

The point is that, as important as platform innovations are, the retail packaging is even more important.

What "EBITDA" Instead of "GAAP" Profit Tells You

Without wanting to be unduly bearish, the global “telecom” industry is less healthy than it appears. Consider only the shift that has to be made in describing “profit.” According to Ericsson, global revenue will climb about 2.4 percent each year to 2018, with growth of earnings “before interest, taxes, depreciation and amortization” of one percent to 2018.

That shift from “generally accepted accounting principles” to EBITDA tells the story: the global telecom industry no longer is “profitable” in the GAAP sense.

Companies that operate in capital intensive, such as telecom, “do not give investors accurate depictions of performance through the EBITDA margin,” says Investopedia. In other words, in capital-intensive telecom, EBITDA is inaccurate as a measure of operator performance.

That is why “generally accepted accounting principles, or GAAP, do not include EBITDA as a profitability measure, and EBITDA loses explanatory value by omitting important expenses,” the site says.

Revenue is important, but the more-telling shift is the use of “EBITDA” rather than “profit.” EBITDA is a measure of cash flow, or operating efficiency. That is important, but it is not the same thing as “profit,” commonly understood.

To be sure, there are reasons for using EBITDA: it isolates operating performance, without the potential distortions of financing activities. At the same time, positive cash flow does not necessarily mean a firm is “profitable.”

That is not always a long-term problem. The entire U.S. cable TV industry, in its major urban growth phase, always had high cash flow (EBITDA), but zero profits, as all available cash was plowed back into growth. Eventually, when the construction phase ended, cable operators shifted to actual GAAP “profits.” So cash flow matters. A lot.

The problem for the global telecom industry is that while there is growth, that growth is heavily to be found in Asia and Africa. In most other regions, the business is quite mature or getting that way. Where there is not high growth, use of EBITDA arguably masks some structural issues.

Mergers, acquisitions, new products and operating cost reductions are reflections of the underlying trends. In one clear sense, telecom clearly is a declining industry: all its legacy products are in a mature mode, while some have been declining for more than 15 years (international long distance, voice).

To survive, much less prosper, completely new products, at massive scale, will be needed. That is why “internet of things” and “connected cars” are so important: they hold the promise of supplying those big new revenue sources.

But we have to recognize that the shift to “EBITDA” instead of GAAP “profit” tells you something very fundamental about the business.


source: Ericsson

Thursday, December 29, 2016

Mobile is Least-Favored Retail Payment Method, Survey Finds

Retail mobile payments have developed rather more slowly than many have predicted would be the case. The basic objection has been that switching from existing retail payment methods to mobile payment adds too little value to drive rapid switching. That seemingly remains the case.

Security and privacy remain the top stated consumer concerns, though an argument might be made that the real reason is that the innovation simply does not yet add enough value to be worth the “bother.”

When asked about which forms of payment they find most secure, cash topped the list of responses to a survey conducted by Walker Sands. Some 46 percent indicated that was a concern.  Credit cards were cited by 27 percent as “most secure,” while debit cards were seen as most secure by 22 percent of respondents.

Mobile payments ranked last each of the past two years, at one percent, in terms of “preferred method of payment.”

The majority of consumers cite security (61 percent) and privacy (58 percent) as the two primary factors that make them hesitant to use mobile payment applications.

About14 percent of consumers say they have no hesitation to use mobile payment services. There are other issues, such the disparity of retailer terminals able to accept one or more mobile payments systems.

For some of us, those are real, but secondary issues. The key problem remains that value is not high enough to prompt massive behavior change.

source: Walker Sands

OTT ARPU Might Matter More than Number of Accounts

source: Chetan Sharma
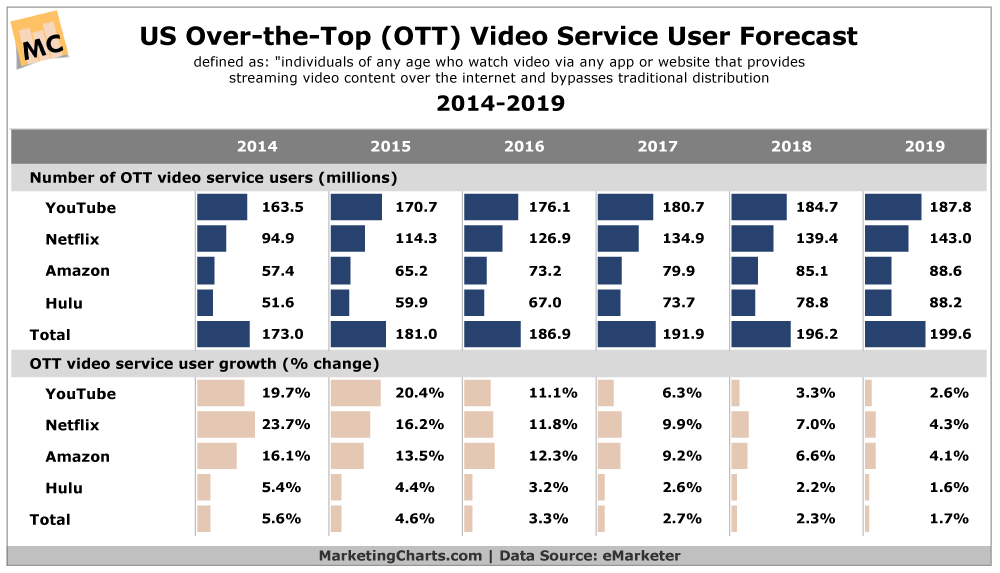
The decline of the U.S. linear subscription TV revenue might happen slower than you think, for a number of reasons. Between 2016 and 2019, for example, though the number of over-the-top subscriptions will grow--boosting the number of active accounts by perhaps 12.7 million units, according to eMarketer--revenue will not change as quickly.


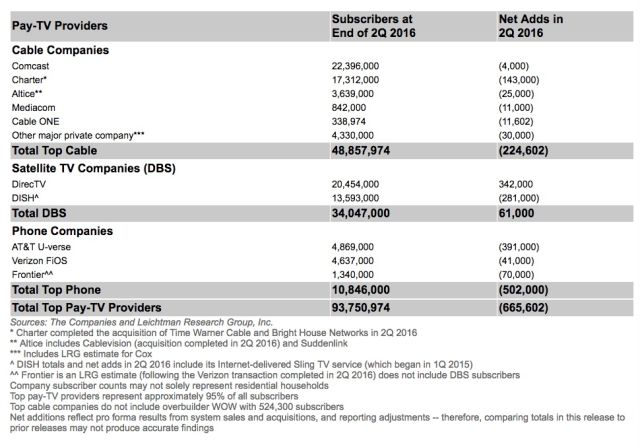
To be sure, OTT account volume already has surpassed linear account volume. U.S. linear subscriptions in 2016 represent about 93.8 million subscriptions. Assuming linear accounts do not grow, or decline too fast, that might mean OTT, already the share leader in terms of total accounts (93.8 million 2016 linear accounts and 187 million OTT accounts), will represent as much as 68 percent of all video entertainment subscriptions.


But average revenue per account is highly disparate. Where a U.S. linear around drives between $80 and $120 a month in revenue, an OTT subscription might drive $7 to $11 per account, per month. In other words, linear accounts can represent as much as an order of magnitude more revenue (10 times) as an OTT subscription.


In 2016, U.S. OTT video revenues might have represented $7 billion. Linear video produced $102 billion.


Were OTT subscription revenues (advertising or transaction revenues also will be generated) to grow 10 times, that would still directly displace a bit less than the current value of linear subscription revenue.  


source: Strategy Analytics
One way of looking at the market is that a customer contemplating purchase of an entertainment video service can buy a single linear subscription, or perhaps 10 OTT accounts, and spend the same amount of money per month.


If one assumes that over-the-air broadcast TV can be gotten using an off-air antenna, for no monthly subscription price, and pre-recorded material from OTT, then the third bucket of content is “live sports” and, for a small number of customers, 24-hour news.


So the issue, long term, is which bundles of purchases allow a potential consumer to replicate all--or enough--of the wanted content using OTT sources only (and assuming over-the-air TV can be gotten at no incremental cost), and what that implies for total monthly spending.


Linear services are adding more features (including OTT or on-demand access), so the issue is not a simple “linear versus on-demand” dynamic.” Also, more linear content is being packaged in OTT form. And few customers want “all” the programming currently offered in big linear bundles. Relatively few want any of the highly-specialized channels, many do not want sports, most do not want news and off-air is an alternative for traditional broadcast network fare.


Logic suggests consumers will evaluate value against price, suggesting a workable set of OTT replacements, for most consumers, will offer “most” of what a linear subscription features, at lower price.


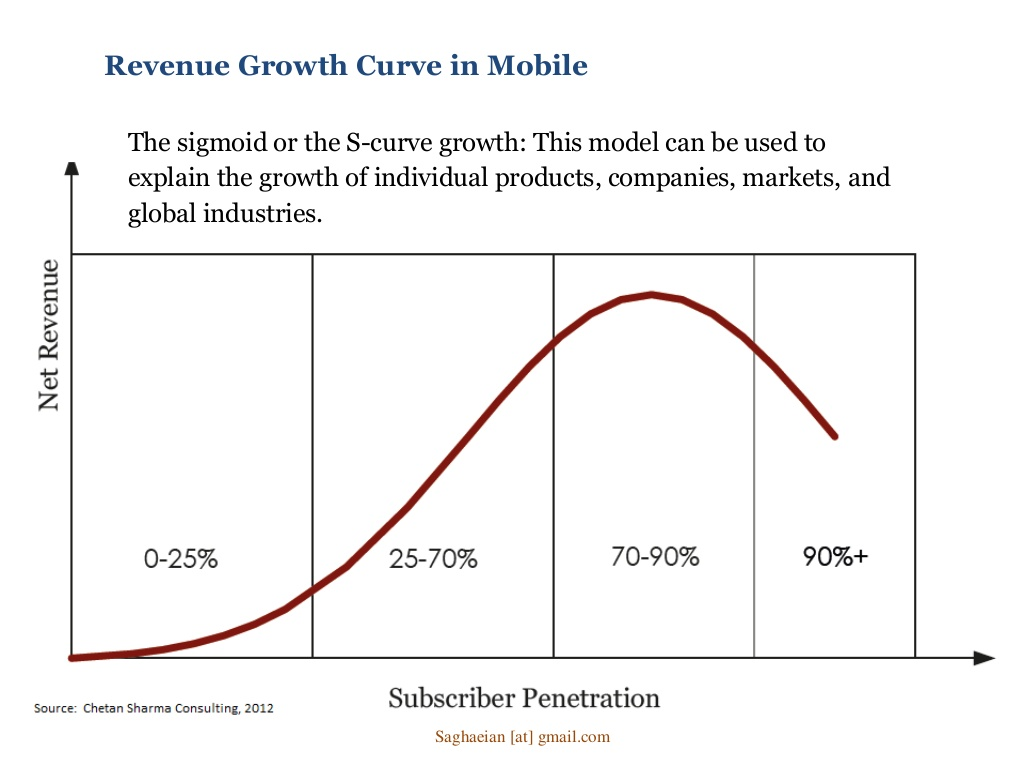
That implies lower revenue per account, and likely lower total monthly spending per user or per household. The reason is what happens in a typical product lifecycle. At some point, every popular product saturates, and revenue per account, as well as industry revenue, falls. Some might argue that OTT is a “new” industry with a “new” growth curve. Others might see OTT as the replacement product for linear delivery.


Both points of view can be correct, simultaneously. One other observation likely is germane. The internet tends to create product replacements that produce less revenue than the legacy business model. The phrase “trading digital dimes for analog dollars” illustrates the notion.


Since most of the primary underlying cost of content is driven directly by content rights access (perhaps 40 percent of total cost in the linear model), and since owners will act to protect those revenue streams, we might surmise that content costs are unlikely to fall much, in the transition from linear to OTT delivery.


source: eMarketer

AI Will Improve Productivity, But That is Not the Biggest Possible Change

Many would note that the internet impact on content media has been profound, boosting social and online media at the expense of linear form...