Monday, July 23, 2018

Headline Numbers on Linear Video Hide Other Trends

By now, nobody is surprised to hear that linear video subscriptions continue to drop or that over the top subscriptions are growing. In aggregate, there are more U.S. paid streaming accounts than linear accounts in service.

Net changes in revenue and accounts are harder to describe, as every quarter and year, some new accounts are added on both linear and streaming ledgers, partly because of churn (customers switching providers), sometimes because of moves (accounts are cancelled at one location but possibly added at another location), temporary suspensions.

In fact, linear revenue might actually be growing, even as accounts dwindle.

Netflix has some 55 million U.S. accounts, while Amazon Prime has some 90 million subscribers. All the largest linear video providers together have about 92.2 million accounts.

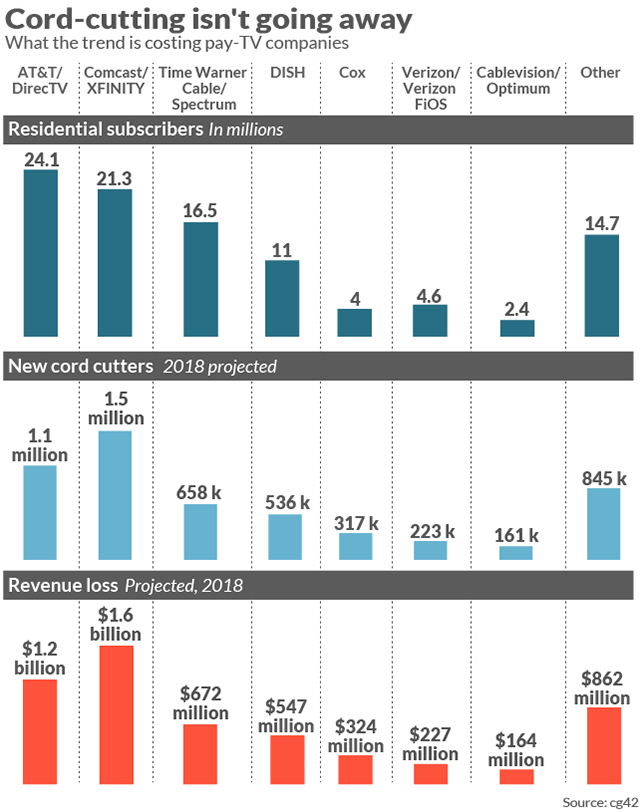
But since linear subscriptions represent many times more revenue than a typical linear video subscription, revenue losses are happening, even for firms such as AT&T that sell both linear and streaming video, and even when the net change in streaming accounts offsets the loss from linear accounts.


Total revenue is another story, as monthly subscription revenue earned by a linear account can be an order of magnitude greater than the revenue from any single OTT streaming account.

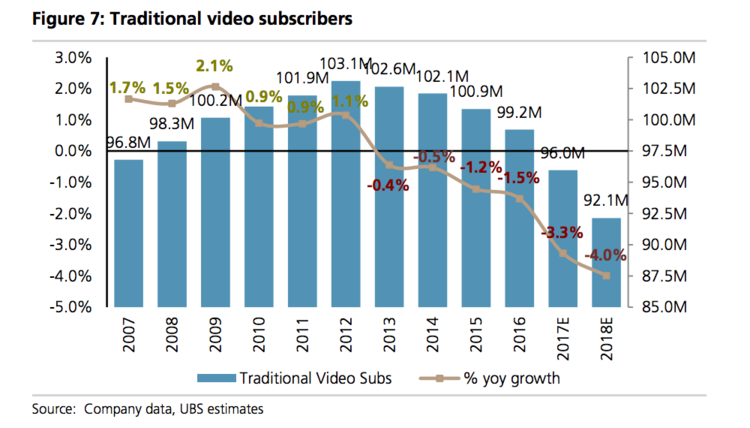
Among the bigger issues is the rate of decline of linear subscriptions, which seems to be accelerating. Net changes (including new accounts and customers switching providers) typically mean the gross losses are less than headline numbers might indicate.

In 2017, for example, the major U.S. providers lost about 1.5 million accounts, up from some 760,000 in 2016, according to Leichtman Research Group.

The big swing was that streaming services owned by the linear providers gained 1.5 million accounts, nearly the amount lost by the two satellite services.

In that case, the net losses by linear providers were about zero, even if the switch was from higher-revenue linear to lower-revenue streaming accounts.  


source: UBS

For Regulators and Suppliers, Competition and Investment are Inversely Related

Communications regulators and service providers always face a cruel tradeoff: over the long term, investment that boosts revenue tends to be inversely related to the amount of competition.

So regulators always face policy tradeoffs. Regulators can emphasize investment or competition, but arguably not both--at high levels--equally and simultaneously. Up to a point, competition creates incentives for investment. But only up to a point.

The reasons are obvious enough. If regulators take a wholesale-based approach, with one network serving all retail providers, the facilities provider’s incentives to invest are limited by government policy. By definition, all retail providers get access at the same rates and terms and conditions. So, as competition increases, incumbents who generally build the wholesale facilities lose ever more market share.

Facilities-based competitors find that incentives to invest increase as the number of competitors is effectively limited (by merger, less wholesale market entry), since contestant market share increases. And that means higher gross revenues and generally higher profit margins.

Also, investment in internet access facilities is something of a zero-sum game.

Internet access providers long have known that there is no linear relationship between data consumption and revenue earned for providing that access. On the other hand, there is a somewhat linear relationship between cost per bit and data consumption.

New data from the U.K. Department for Digital, Culture, Media & Sport shows that although mobile customer spending on mobile internet access is roughly flat between 2012 and 2016, data consumption and cost per bit show a relatively inverse and linear relationship.

As mobile data consumption increased by an order of magnitude over those years, the cost per bit dropped by an order of magnitude.

The business model implication is clear: increasing end user data consumption does not lead to revenue increase.

source: Department for Digital, Culture, Media & Sport

How Many Gigabit Networks in U.K. Market?

Where facilities-based fixed communication networks compete, business models always are contingent on market share. Where just two equally-skilled and financially-endowed contestants face each other, it is reasonable for each competitor to expect take rates of 50 percent, on a network that passes every location.

That strands half the invested capital in the access network. In practice, since adoption is never 100 percent, the addressable market theoretically is less than 50 percent for each supplier.

Additional competition reduces the potential market share yet further. In the U.S. market, some 20 to 30 percent of households already are mobile-only for internet access, reducing the potential share for two competitors to no more than 40 percent each.


Mobile substitution also will, in the 5G era, vastly complicate the fixed network business model. “The distinction between fixed networks and mobile networks is increasingly being eroded,” the report says. “In some places 5G could provide a more cost effective way of providing ultra-fast connectivity to homes and businesses.”

Such substitution already has happened for consumer voice, and consumer internet access and subscription video are the next big areas of potential shift.

That poses further threats to the fixed network business model, as potential market share will will even further in the direction of mobile platforms.

In the U.K. market, for example, BT’s network passes nearly every location, but BT itself has about 37 percent market share, according to a new report by the U.K. Department for Digital, Culture, Media & Sport.

Wholesale customers on the Openreach network include Sky (24 percent share), TalkTalk (12 percent) and smaller providers. There also are some facilities-based providers operating on a localized basis.  

Virgin Media is the primary facilities-based competitor and has 20 percent market share, while passing a bit more than half of U.K. households. It might not be unreasonable to argue that Virgin will be the first operator to offer gigabit internet access at scale, as a disproportionate share of UK. customers with faster speeds are on the Virgin network.

Housing density is the other key variable. About a third of U.K. households are in areas dense enough that as many as three competing gigabit networks can be built. That logically includes the Openreach, Virgin Media and one additional competitor on a local basis.

Perhaps half of U.K. households might be in areas dense enough that two gigabit network providers can survive.

About 20 percent of homes are in low-density areas where only a single network is likely to be possible (subsidized or not).

So the study sees three basic deployment scenarios. In areas representing 80 percent of U.K. homes, two or more gigabit-capable networks are possible. That includes larger cities and towns.

Other, less dense areas might support only a single network. That might include about 10 percent of all U.K. homes.

Very rural areas, representing about 10 percent of homes, will need subsidies to support building of a single new network.  

The big unknown is the degree of mobile substitution, which will make the business case for fixed networks tougher.

Saturday, July 21, 2018

35% of U.S. Hispanic Households are Mobile Only for Internet Access

Mobile substitution, long a feature for voice services, now is a growing reality for internet access. According to CTIA data, 20 percent of U.S. households rely exclusively on their mobile devices for internet access, up about 54 percent from 2015 levels.

That trend is even more pronounced in Hispanic households, where 35 percent of smartphone users rely solely on mobility for internet access; lower-income households and younger households.

source: CTIA

Wednesday, July 18, 2018

Bundling or Tying is at Heart of EC Charge Against Google (Always Is)

The European Commission argues that by tying use of the Android OS and Google Play to a phone supplier's offering of Google's search engine and browser, Google quashed potential competition. 

But many would argue Android is not a monopoly. There are other choices, aside from Android and the iPhone OS. But few end users or phone manufacturers have chosen to use those alternatives. Tying or bundling always raises issues, though. 

Infographic: Google's European Dominance | Statista
source: Statista 

Tuesday, July 17, 2018

Will Autonomous Vehicles Increase Video Consumption?

Executives at AT&T seem certain that new video screens are going to emerge as passengers start spending more time in autonomous vehicles. The argument is that if people are riding, but not required to drive, then video viewing time might well increase beyond present levels.

The biggest potential changes might come from people with long commutes, though even users of autonomous or even ridesharing vehicles for shorter trips around town would logically become potential new audiences.

Consumer behavior still is a barrier for subscription-based or pay-per-view approaches. Consider an airliner a ridesharing vehicle. How many passengers do you notice buying a video entertainment service during the flight? Not many.

Ad-supported content obviously will have a bigger potential audience, and especially for ridesharing services, rather than auto owners. The immediate problem is that the economics of substituting ridesharing for auto ownership, in most parts of the United States, do not exist.

Using Uber or Lyft (or a taxi) for episodic travel often makes more sense than renting a car. What is not yet clear is whether it will soon make sense to use ridesharing instead of owning a car, in some instances.

It probably is easy enough to argue that car ownership still makes more sense, financially, than full time ridesharing for most families and individuals, in most areas of the United States.

Some attempt to include “cost of your time” in calculating the benefits of ridesharing, compared to car ownership, but most of us cannot name another individual who really would consider that value in trying to assess ridesharing versus auto ownership.

Assume the cost of most Uber or Lyft rides is about $2 a mile. Assume you really need to move about 12,000 miles a year. The ridesharing might then cost about $24,000 a year. The Internal Revenue Service uses a figure of $0.545 per mile for use of autos for business purposes.

So owning a vehicle and using it 12,000 miles a year represents about $6,540 a year (including depreciation of the vehicle, insurance and operating expenses, but not parking).

At such rates, ridesharing represents out of pocket costs about four times higher than owning a vehicle.

So while many of us would consider ridesharing as a full alternative to auto ownership, the economics do not yet work, for people who live in suburban areas, or even in many urban areas other than New York or San Francisco.

Saturday, July 14, 2018

There are Limits to How Much Mobile Data People Want to Consume

As much as connectivity is untethered and mobile; as important as internet apps now are in the mobile value proposition; as much as consumers keep increasing their data consumption, we tend to vastly underestimate consumer behavior as a moderating influence on mobile data consumption.

An analysis of mobile tariffs and mobile data consumption by Tefficient found only a weak correlation between average revenue per user and data usage, for example.

That is not what one might expect. The analysis shows that, in most countries, mobile data consumption is 3 Gbytes per month, or less, no matter whether overall recurring charges are high or low.

That seems to fly in the face of both economics and the Tefficient data, which also shows that mobile data prices and usage are directly correlated (high price leads to low usage; low prices lead to high usage). So something else is at work.


Among the logical explanations for those findings are that mobile subscriptions represent a bundle of features, including messaging, voice, device rental, plus possible bundling with other services (fixed network voice, fixed network internet access, mobile or fixed video subscriptions) that affect unit cost. So mobile data is one of many determinants of retail recurring costs.

Also, Wi-Fi offload plays a role, representing a majority of mobile device data access in many markets. End user behavior also matters, as it seems people use mobile data in different ways than data used while stationary (at home or at work).

Still, the Tefficient data suggests even at low prices, people only want to do so many things, or spend so much time, on mobile internet apps. And that is reflected in mobile data usage.

Ironically, the one development that changes the overall usage curve is the use of 5G platforms to supply fixed access.

AI Will Improve Productivity, But That is Not the Biggest Possible Change

Many would note that the internet impact on content media has been profound, boosting social and online media at the expense of linear form...