Tuesday, December 11, 2018

IoT Devices Already Half of Global Connected Devices

Most observers might agree that the internet of things is a future opportunity for most participants. But at least by the measure of “devices in use,” IoT already constitutes a huge share of connected devices. In fact, IoT devices might already represent half of all global connected devices, far outstripping mobile phones, according to StorageNewsletter.


Monday, December 10, 2018

Appliance-Based SD-WAN Market Perhaps $2 Billion in 2019

Appliance-based SD-WAN suppliers sold about $284 million in the third quarter of 2018, according to IHS Markit, implying an annual market in excess of $2 billion in 2019.

If managed SD-WAN services are about half the market, that also implies a service provider SD-WAN market of about $2 billion in 2019.

If the U.S. market accounts for about a third of global activity, then U.S. service providers might expect 2019 sales of perhaps $667 billion.

source: IHS Markit

Sunday, December 9, 2018

8% of U.K. Customers Buy Fastest Internet Services

Supply is different from demand. Though perhaps obvious, it is an often-confused principle when looking at the ways people buy and use internet access services. This illustration of actual fixed network internet access take rates in the United Kingdom, sorted by speed tiers, provides an example of the demand picture.

In every market, it seems, the percentage of customers who buy the fastest tier of service--typically the most expensive as well--is a small percentage of total buyers. In the U.K. market, about eight percent of buyers choose the fastest tier of service, perhaps 14 percent buying the fastest tiers.

Still, 42 percent buy the slowest tiers of service, with 21 percent paying for 10 Mbps or slower service, while another 21 percent buy speeds between 10 Mbps and 20 Mbps.

In the U.S. market, those 42 percent of customers, though buying internet access service, are not buying “broadband” service, defined as a minimum of 25 Mbps. About 44 percent of U.K. customers buy services with speeds ranging from 20 Mbps up to 100 Mbps.

The point is that, to the extent speed and price are directly related, customers generally do not buy the most-expensive product, but instead other products are are deemed good enough (enough value for the price).

Increasingly supply of the most-expensive product does not necessarily translate into an equivalent amount of buying, especially as speeds tend to increase over time, while price declines or remains the same.

How Big a Deal is Video in 5G Era?

Just how big a revenue driver mobile video will be for mobile operators in the 5G era is an open question.

That video will drive mobile data consumption seems not to be contentious. By perhaps 2024, 75 percent of mobile data consumption will be video, most would agree. Of course, consumption and revenue for various participants in the ecosystem is not the same thing.

Connectivity providers learned long ago that though a symbiotic relationship exists between demand for use of internet apps creates demand for internet access services, there is no necessary and direct relationship between use of the internet and revenue generated by provided connectivity.

Quite the reverse, in fact, is most often the case: supply has to be increased without incremental revenue being earned.

Still, many service providers have found that the most-tangible new sources of significant present revenue--troublesome as growth trends might be--come from video subscription services. There simply are not many new revenue sources capable of generating $1 billion or more in incremental revenue for any tier-one service provider.

The problems are compounded for suppliers of fixed-network communications, as voice revenues are falling, while in most developing nations, internet access is slow growing, as nearly all the growth of internet access occurs on the mobile networks.

As Ovum analysts have outlined it, linear (SLIN) and on-demand (SVOD) accounts continue to grow, even if there are gross revenue and profit margin implications from faster SVOD growth.


As this graph indicates, in developed nations, fixed internet access is saturated, or nearly saturated, implying slow future growth. Mobile broadband is reaching high levels in developed and now even in some developing markets.

Also, though it would seem that subscription video is fairly well adopted in many markets, total market statistics can mask the market share held by different suppliers. In some markets, most of the video share is gotten by cable TV operators, not telcos.

So where video is a big revenue stream, and mostly earned by cable TV, telcos can grow their own revenues by taking market share, as cable TV operators were able to grow in saturated voice markets or business services by taking share from telcos.


The bottom line is that there are few “new” revenue streams as immediately large as subscription video (both linear and fixed) that have mass market demand and drive subscription or advertising revenue at high levels.

So though much remains to be seen, prospects for mobile subscription video, given the significant and growing consumption of video on mobile devices, is an obvious place to look for future growth.


Saturday, December 8, 2018

Denver, 1863 and Now

Denver in 1863, at the confluence of Cherry Creek and the South Platte River, looking west. 


The same area today, where Cherry Creek meets the South Platte, looking east:

Confluence Park on the South Platte River bustles with river enthusiasts.

Without Subsidies, Tough or No Business Model for Internet Access in Rural Areas

It often is easy to forget the low density of most places in the United States, defined as places where there are fewer than 15 locations (business and residential) per road mile, according to Steve Parsons, Parsons Applied Economics president and James Stegeman, CostQuest Associates president.

Such places cover nearly 86 percent of the area of the lower 48 U.S. states and most of Alaska. Those 86 percent of areas contain 12 percent of U.S. locations.

The implications for building any sort of cabled communications network are stark. In such areas it can cost $17,400 per location to build a cabled communications network using standard telecom industry platforms.

If half the locations actually buy service, the network cost per customer is as much as $34,800.

Beyond the capital investment are the ongoing costs to operate the business. The bottom line is that, in rural areas, there is no sustainable business case without subsidies.

Capital investment per customer location, for conduit and poles, is approximately 5.6 times higher in rural areas as in suburban areas, the consultants say. For fiber optic cable, the capital investment is approximately 4.2 times higher in rural areas as in suburban areas.                                 

The other issue is that across the U.S. west, there are many areas that are not populated (shown in grey). Areas shown in green (metro areas) are where terrestrial cabled networks have the lowest costs. Areas in yellow are medium cost, while areas shown in orange have high costs. Areas in red have very high cost.


Such realities are why TV white spaces, unlicensed and shared spectrum, low earth orbit satellite constellations and 5G are viewed as possible solutions for rural internet access and other services.   


There are, of course, possible business implications for existing service providers (cable, telco, satellite, fixed wireless) in rural areas.

Friday, December 7, 2018

$773 Billion in 2018 IoT Spending on Hardware, Software, Services

Global spending on Internet of Things sensors, software and services will reach $772.5 billion in 2018, an increase of 14.6 percent over the $674 billion that will be spent in 2017, Gartner predicts.

IoT hardware will be the largest technology category in 2018 with $239 billion going largely toward modules and sensors along with some spending on infrastructure and security.

Software will be the fastest growing technology segment with a five-year CAGR of 16.1 percent. Services spending will also grow at a faster rate than overall spending with a CAGR of 15.1 percent and will nearly equal hardware spending by the end of the forecast.

"By 2021, more than 55 percent of spending on IoT projects will be for software and services,” said Carrie MacGillivray, IDC VP.

Global IoT spending will grow at a 14.4 percent compound annual growth rate through 2021, Gartner predicts.

Asia/Pacific (excluding Japan) will be the geographic region with the most IoT spending in 2018 ($312 billion) followed by North America (the United States and Canada) at $203 billion and Europe, the Middle East, and Africa (EMEA) at $171 billion.

China will be the country with the largest IoT spending total in 2018 ($209 billion), driven by investments from manufacturing, utilities, and government.

IoT spending in the United States will total $194 billion in 2018, led by manufacturing, transportation, and the consumer segment.

Japan ($68 billion) and Korea ($29 billion) will be the third and fourth largest countries in 2018, with IoT spending largely driven by the manufacturing industry.

Latin America will deliver the fastest overall growth in IoT spending with a five-year CAGR of 28.3 percent.

The industries that are expected to spend the most on IoT solutions in 2018 are manufacturing ($189 billion), transportation ($85 billion), and utilities ($73 billion). IoT spending among manufacturers will be largely focused on solutions that support manufacturing operations and production asset management, IDC said.

In transportation, two thirds of IoT spending will go toward freight monitoring, followed by fleet management. IoT spending in the utilities industry will be dominated by smart grids for electricity, gas, and water.

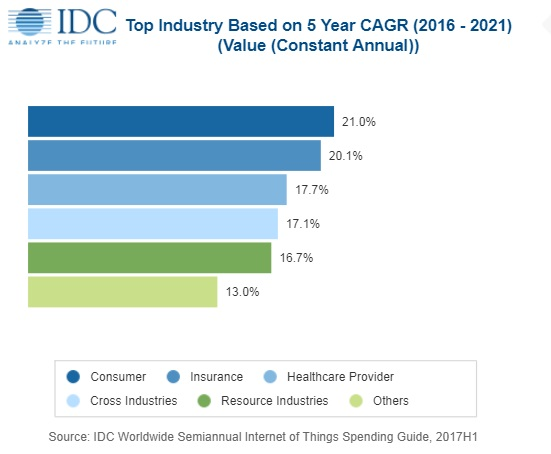
Cross-Industry IoT spending, which represent use cases common to all industries, such as connected vehicles and smart buildings, will be nearly $92 billion in 2018 and rank among the top areas of spending.

Consumer IoT spending will reach $62 billion in 2018, making it the fourth largest industry segment. The leading consumer use cases will be related to the smart home, including home automation, security, and smart appliances.

Fixed Wireless Platforms Make Sense for Rural Markets--Including the U.S.

It might seem obvious that fixed wireless access--though important in many countries where fixed network infrastructure is hard to create an...