Wednesday, December 26, 2018

What is Relationship Between Network Slicing, SDN, NFV?

New platforms in the networking business often are hard to classify and categorize. So there is criticism of “fake 5G” or 5G Evolution as AT&T calls it  (advanced 4G using infrastructure that will be shared with 5G) in some quarters, even if networking professionals all agree 5G will be built in large part on advanced 4G infrastructure.

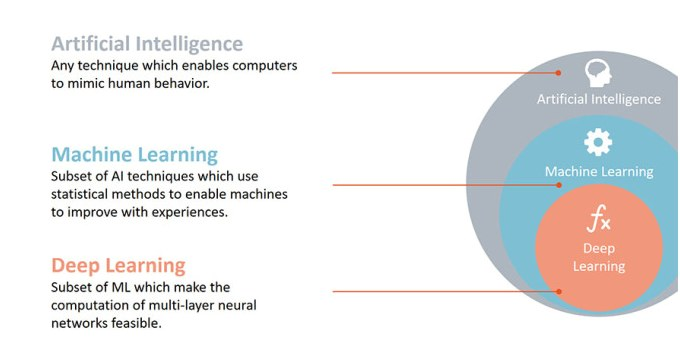
In the same way, we might not all agree on how network slicing, network functions virtualization and software defined networks relate to each other. Some might argue they are nested subdomains. Others might see them as related but distinct domains. Eventually that all will be sorted out. The point is that common understanding has yet to develop fully.

Network slicing is the ability to create multiple customized networks operating on a common physical infrastructure.

Network slicing often is said to be an outcome of network functions virtualization, and many would agree that NFV underpins and enables network slicing. But network slicing (creation of customized private networks) perhaps is more-properly viewed as an application of software defined networks, in the same way that a software-defined wide area network is an SDN-enabled product.  

There probably also is dispute about the business value of platform innovations. Is upside primarily on the operating or capex reduction fronts, new revenue creation areas, or a combination of all those elements? The answers might be somewhat subtle.


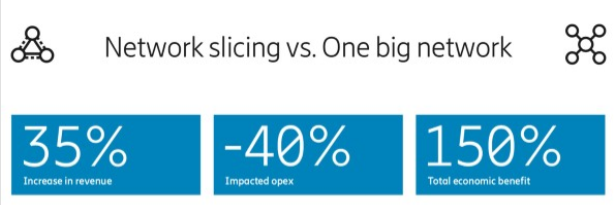
Network slicing should enable new revenue generation through market stimulation, faster time to market and opportunities from smaller niche services, Ericsson argues.

Market stimulation will come from offering of new customized service level agreements and self-service opportunities, Ericsson believes. But the upside is going to hard to quantify, relying on the value of better service performance, customer experience and customer satisfaction.

Smaller niche service opportunities will become economically viable for operators to explore, providing value through “sandboxing, temporary events and tailored business models,”  Ericsson argues.

Shortened service delivery cycles and simplified, tailored operations will be possible because processes are streamlined.

Capex efficiency Infrastructure efficiency - Network optimizations can be made with slicing, due to the implementation of an efficient traffic model with service type segregation.

Functions in network slices are dynamically scaled according to traffic or service demand, so network resources are more-efficiently used.

Monday, December 24, 2018

Customer Experience Might be Twice as Hard as You Think

“Bothersome experiences” and “shopping delights” are thought by most people to be drivers of retailer abandonment, in the former case, or customer loyalty, in the latter case. Most of us tend to think of the full range of things a supplier does, or fails to do, that can move buyer perceptions in either direction.

Applied to the connectivity business, outages, incorrect billing, long waits for customer service, high perceived prices and low perceived quality of service are seen as drivers of churn. The logical thought is that high availability, correct bills, prompt customer service, reasonable prices and high value are seen as drivers of customer loyalty.

But an argument can be made that the bothersome and delightful dimensions of experience are not linear, on a single scale, but perhaps even two different categories: things that bother customers and need to be avoided, as well as things that delight customers, and have to be created.

In that view, you cannot delight customers by removing irritation: one only removes the bother and the risk of customer abandonment. In other words, no retailer creates delight simply by removing sources of unhappiness. Consider the results of studies by Qualtrics.

In-store irritants (complaints) include rude employees, high prices, items not in stock and long checkout lines. Online irritants include shipments that do not arrive, fake product reviews or misleading or inaccurate descriptions and depictions.

Say any given retailer has all those problems. Say those problems, at significant effort and expense, get fixed.

So now customers in stores encounter courteous employees, reasonable prices, items always in stock and fast checkout. Is that enough to produce “delight?” Maybe not. Maybe that is what customers shopping in stores simply expect. So the reasons to avoid shopping are removed.

The single exception is price, in the in-store context. Shopping are irritated by high prices, and report enjoying unexpectedly low prices. With that exception, the irritant issues and enjoyment values do not overlap.

In an online context, say a retailer fixes irritants by improving logistics, the quality and accuracy of product reviews and descriptions. Again, the question is whether doing so creates a sense of buyer delight, or simply removes a reason not to use the site.

Now consider feedback from shoppers about what they most enjoy about particular retail or online shopping experiences. In-store, the ability to try on a garment, being able to “get out of the house,” unexpectedly-low prices, doing something with friends or family, and serendipitous exposure to products are positives.

Online, shoppers value larger product selection, free shipping, the ability to shop from anywhere and avoiding checkout lines as drivers of enjoyment. None of the major online “enjoyment” drivers are directly related to the complaints.

In-Store and Online Complaint and Enjoyment Drivers
In-Store irritant
In-Store enjoy
Online irritant
Online enjoy
Employee rudeness
Try on garment
Item did not  arrive
Product selection
High prices
Low prices
Fake reviews
Shop anywhere
Merchandise unavailable
Get out of house
Misleading description
Free shipping
Long checkout
Be with friends
Low quality
No checkout line

Serendipity
Shopping cart
No need to leave house


The point is that it is perhaps not so clear that all consumer interaction issues are on a single scale: high to low, good to bad, irritant or enjoyment.

Instead, there are at least two different scales: presence or absence of “things that irritate consumers,” and presence or absence of “things that delight customers.”

With the possible exception of an expectation of high in-store prices and unexpectedly low store prices, irritants and pleasures do not seem to be on the same scales. They appear to be different dimensions of experience.

Sunday, December 23, 2018

AI in Everyday Life: More Common Than You Think

People routinely use electricity and think nothing of it. Artificial intelligence, machine learning and deep learning are likely going to be experienced the same way. Few people can explain how electricity works, but it already powers many parts of modern life.

Equally few are probably aware of how they already use machine learning in everyday life.

Amazon recommends books; Netflix suggests a film or TV show; your email app filters spam using machine learning. Machine learning underlies consumer interactions with Siri, Alexa, Google Assistant.

Personal assistant apps on smartphones use machine learning. Portrait mode cameras use machine learning.

Social media feeds use machine learning to customize your content. Video games sometimes incorporate machine learning to vary app responses based on player actions.   

Machine learning helps Uber estimate how long a trip will take. ML also helps Uber estimate how much you are willing to pay for any particular trip. Riders are matched with drivers using machine learning.

Machine learning powers GMail’s auto-response features. LinkedIn uses machine learning to match jobs with jobseekers. Pinterest uses ML to classify photographs and visual images.

Your bank and credit and debit card providers use machine learning to monitor your accounts for fraudulent activity. ML also powers their reminder and alert systems.

Airliners use machine learning when autopilots are engaged. By some estimates, a typical flight on a Boeing 777 is on autopilot for all but 3.5 to seven minutes in the air.

Customer interaction software uses ML to answer questions and resolve problems at inbound call centers. Search engines use ML when you seek information.

Amazon makes product recommendations for you using ML. Spotify uses ML to make music recommendations. Online ads often are served up with the assistance of ML.

Google Maps uses ML to predict the fastest routes to a destination. Smart thermostats use ML to alter thermostat behavior based on how a user has acted in the past.

ML powers workforce analysis systems that make deductions from email and other written text. Machine learning increasingly can be used to assess organizational risk.  

How AI in general, or machine and deep learning will work to enhance or create products and features are subjects likely of little immediate and compelling interest for most people, whose job responsibilities or life routines do not require any specific knowledge about AI.

AI, almost by definition, works in the background. People use computers, apps and smartphones, but few have any need to understand what happens at the component layer, inside computer rooms or servers. People do not need to understand particular coding languages to use software built with such languages.

Friday, December 21, 2018

You Might be Surprised at the Number of Gigabit Connections Small Rural Telcos Supply

Causes, industries, organizations and policies do not get support at any level of government unless there is a “crisis” or “big problem” to address. And, to be sure, rural internet access or communications services of any type are less robust than in cities, for all sorts of good reasons.

But a balanced assessment would also include the contributions thousands of small rural telcos  and internet service providers already make--in rural areas--to supply internet access under most-difficult conditions. We are talking about service providers in areas where there are 10 or fewer residences per square mile, and many operating in areas where there are but two homes per square mile.

The latest survey of 194 small telcos that are members of the NTCA rural broadband association is instructive. The average (“mean”) respondent organization has 4,355 residential voice lines; 1,493 business lines; 4,455 residential broadband connections in service and 530 business internet connections in service.

You might be surprised to learn that 23 percent of all connections made available by these rural service providers offer at least a 1,000-Mbps connection. Another 34 percent of connections offer speeds from 100 Mbps to about 999 Mbps. In other words, 57 percent of available connections operate at 100 Mbps or faster.

As typically is the case, that does not mean most customers buy the fastest services. They do not. Actual buying clusters in the range between 4 Mbps and 100 Mbps minimums.
Source: NTCA data, IP Carrier analysis  

The service area covered by such telcos is approximately 2,244 square miles. Some 60 percent of respondents have service areas 500 square miles or larger and 27 percent were at least 2,000 square miles.

Thursday, December 20, 2018

Consumer Connectivity Wallets are the Constraint on Revenue Growth

Some will lament the fact that even when gigabit (or any other very-fast) internet access service is available, most consumers do not seem to buy them, when there also are choices of other services that cost less, but are not as fast. In other words, there typically is some gap between the availability of a service and consumer willingness to buy.

In the United Kingdom, for example, 94 percent of U.K. homes and businesses are in areas where fixed network broadband operating at 30 Mbps or faster is available, according to Ofcom. In such areas, just 45 percent of homes buy a service operating at 30 Mbps or faster.

According to Ofcom, perhaps six percent of U.K., homes can buy a service operating at speeds in three or four digits (300 Mbps to 1,000 Mbps, for example). If take rates resemble those of the United States, single digits are the take rates where gigabit services are available.

And such data underscores an “iron law” of the consumer connectivity business. People are only going to spend so much for connectivity services.

Average monthly U.K. household spend on telecom services fell in 2017, down by one percent in real terms to £87, equivalent to 3.5 percent of total household spend, even as households were upgrading to faster fixed network services with higher recurring prices.

That is a typical spending pattern for consumers in developed markets. Australian consumers spend about 3.5 percent of disposable income on connectivity services, for example. That same pattern can be seen in entertainment spending as well: households will only spend so much on communications or entertainment.  

Wallets are only so big, and get bigger only about as fast as overall income increases.

Average monthly spend on communications services fell by 1.2 percent from £126.18 in 2016 to £124.62 in 2017, an annual decrease of £18.72 in real terms, Ofcom notes.

Average U.K. monthly household spend on mobile voice and data services has decreased by eight percent (£4.02) since 2012, to £45.99 per month in 2017, Ofcom says.

In contrast, average monthly spend on fixed voice and internet services increased by 14.3 percent over the same period to £41.13. This is largely because consumers have migrated to faster broadband services, which tend to be more expensive than standard broadband services.

Mobile voice and data spending fell by 98p (2.1 percent), Ofcom says.  


The number of landlines fell by one percent to 33.1 million as a result of businesses switching to mobile and VoIP-based voice services. The fall in business lines was partly offset by a one-percent increase in the number of residential landlines, attributed to growing fixed broadband take-up, as most households in the United KIngdom need to buy a landline service to use fixed broadband services.

The main casualty of growing smartphone take-up has been traditional messaging (i.e. SMS and MMS), as users switch to more feature-rich internet-based messaging services, such as WhatsApp and Facebook Messenger, and the messaging services offered on other social networking sites.

By 2017, average outgoing messages (including SMS and MMS) per mobile phone subscription had fallen to 82 per month, having peaked in 2012 at 162 per month. And while average outgoing mobile call volumes per subscription have risen since 2007, reaching 157 minutes per month in 2017, this was two minutes per month less than in 2016, Ofcom says.

Tuesday, December 18, 2018

Global Service Provider Revenue to Grow, Free Cash Flow to Shrink

There is modestly good news for global connectivity service providers on the revenue front, through 2022: revenue growth rates are going to tick up modestly. The bad news is that free cash flow is going to dip about two percent on higher capex and opex.

And while mobile internet access can be counted on to boost revenue in developing markets, developed markets will have to rely on revenues from new 5G use cases. So there is more risk in the latter; less risk in the former.


According to a forecast by Arthur D. Little consultants, the North American, Latin American and Middle East and Africa regions will experience service provider revenue growth above global averages.

Global service provider revenue growth will average three percent per year from 2017 to 2022, a slight uptick from growth rates between 2014 and 2016.  

“In North America, we expect total revenue CAGR of 4.6 percent from 2017 to 2022,” A.D. Little says. Latin America will see 5.2 percent CAGR, while MEA will a 4.9 percent CAGR.

The revenue growth can be attributed primarily to increased high-speed wireless data coverage in emerging markets, higher revenue from fixed infrastructure required to support aggressive increases in data consumption and new use cases enabled by 5G deployments in more mature markets.

“New revenues from 5G are expected to arise from new B2B and B2B2X use cases, as significant incremental revenues are not immediately expected from consumer 5G services,” the consultants say.  


The baseline forecast predicts global telecoms capex growing at a CAGR of seven percent from 2017 to 2022, a rate that is more than double the historical CAGR and also outpaces the forecast growth in global telecoms revenue for the same period.

As a result, free cash flow will dip about 1.7 percent

Friday, December 14, 2018

Vodafone Upgrades 1 Million Berlin Homes to Gigabit in 3 Months

Vodafone has upgraded--in just three months--one million Berlin households to gigabit internet access speeds. Already having upgraded six million German household passings, Vodafone expects to reach 11 million gigabit passings by the end of 2019 and more than 12 million households passed by 2021.

That the gigabit upgrade is happening so fast is testament to the use of hybrid fiber coax cable TV facilities, among whose advantages has been lower cost and faster upgrades than switching from copper telephone networks to fiber-to-home.

Liberty Global has estimated the cost to upgrade to gigabit speeds at about €20 ($22) per passing.


AI Will Improve Productivity, But That is Not the Biggest Possible Change

Many would note that the internet impact on content media has been profound, boosting social and online media at the expense of linear form...