Monday, March 2, 2020

EIU Finds U.S. Internet Access Prices Lowest Globally, When Compared to Incomes

Many observers believe that fixed network internet access in the United States is expensive and slow. According to the Inclusive Internet Index produced by the Economist Intelligence Unit, the U.S. market in fact has the most affordable internet access, based on retail price in relation to income. 


Adjusting for local purchasing power, fixed network internet access costs around $50 a month in almost every country. Adjusting for purchasing power parity normalizes internet access prices for general price level differences across countries. 

Doing so is revealing: In most countries, prices hover around a $50 a month level, after the PPP adjustments. 

The Inclusive Internet Index (3i), produced annually since 2017 by The Economist Intelligence Unit and commissioned by Facebook, benchmarks countries on the Internet’s availability, affordability, relevance and the readiness of people to use it. 

Among high-income nations, the United States ranks third. 

Spanish Internet Tends to be Symmetrical, U.S. Services are Mostly Asymmetrical

Compared to the way fixed network consumer internet access is supplied in the United States, Spanish fixed network access tends to be symmetrical. Uploading of 4K video is the most-obvious driver of need for higher upstream bandwidth. Uploading of HDTV quality video normally requires only single-digit upstream speeds.  

Videoconferencing is another consumer app that generally requires more symmetrical bandwidth as well. Gaming and e-learning applications using video arguably also increase the need for more-symmetrical bandwidth. 


That noted, downstream entertainment video is the overwhelming driver of bandwidth globally, and arguably drives the primary need for downstream bandwidth. The other issue is that access platforms traditionally have been asymetrical. Newer optical fiber to premises networks tend to feature symmetrical bandwidth. So much hinges on what sort of platform--hybrid fiber coax, mobile network or which generation of optical fiber access is deployed.


5G Use Cases Mostly Will be Enterprise Driven

Enterprise applications--not consumer use cases--will drive the value of 5G, many, including Marcus Weldon, Nokia Bell Labs president, believe. He speaks about this in this Futurithmic Podcast episode 13: Waves of innovation with Marcus Weldon

There are both consumer and enterprise use cases, of course, but most are likely to be found in enterprise segments of the business. Consumers will in some cases benefit from faster internet access speeds or virtual reality or augmented reality. 

But except for “faster access,” most of the AR/VR use cases will be supported by enterprise business models, though consumers will be end users in many cases, as Facebook is used by consumers, but has a business-to-business revenue model. 


Fixed wireless, for example, will be used to deliver consumer internet access, but provides revenue upside for service providers because it allows them to compete with cable operator services at lower cost than building fiber-to-premises networks. 

Immersive experiences will be provided by AR/VR that is a feature of some other product. 

Sunday, March 1, 2020

How Fast Might Private 5G Networks be Adopted?

Some believe private 5G someday might be as common as Wi-Fi is today, the reason being that millimeter wave 5G signals will not generally be able to penetrate building walls and energy-efficient glass. 

“Buildings will have to create their own internal 5G networks because they won’t be able to get it from the outside network,” Arie Barendrecht, WiredScore CEO says. “Low-E glass is one of the best insulators from the 5G coverage, and if a building is over 15 stories, it gets worse.” 

Barendrecht thinks that in two to three years there will be an expectation from tenants that their buildings will support 5G service and speeds. 

One might suspect his forecast is too aggressive. By some estimates, Wi-Fi, which was commercially introduced in September 1999, had reached adoption of about half of U.S. homes by about 2005. The other half used Ethernet cable networks. 

Also, offloading in-building access to Wi-Fi will still be possible. And the voice default might still be to 4G, which does have (compared to 5G) much better inside signal strength. And carriers will have more incentives to support VoIP as well, taking advantage of Wi-Fi offload.

The displacement of Ethernet cabled networks by Wi-Fi, in enterprises, took at least a decade. 

Not until about 2010 or 2011 were there as many as one million public Wi-Fi hotspots globally. Some say public hotspots reached five million locations by 2013. Some argue that, by 2015,  there were 70 million public Wi-Fi hotspots in operation. 


That history suggests some circumspection about the pace at which most buildings will have private 5G networks.

Actress Hedy Lamarr was Awarded a Key Patent in 1942 Paving Way for Wi-Fi


Actress Hedy Lamarr was familiar with both radio technology and the weapons industry. She had the idea of using multiple, changing frequencies to make signal sabotage harder, and referred to it as frequency hopping. We now call this spread spectrum .

Hedy Lamarr (1914-2000)
Hedy Lamarr
Composer Antheil had extensive experience with the synchronization of player pianos, or pianolas. The two took inspiration from this to develop a secret communication system for the remote control of torpedoes, based on a frequency hopping mechanism that switched between 88 different frequencies. In 1942, they received a patent for this system. 

U.S. and World Internet Access Prices Have Dropped Continuously Since 2008

U.S. prices for mobile service and internet access have been dropping virtually continuously since 2000, something also a trend in the rest of the world. Since 2010 alone, U.S. fixed network internet access prices dropped 45 percent to the end of 2019, for example. 


One analysis of the costs of fixed network internet access conducted by the International Telecommunications Union, using the purchasing power parity method, shows that by 2016, internet access prices--adjusted for differences in local prices--actually were quite consistent across nations.

In all countries, prices hovered around a $50 a month level, after PPP adjustments. 

The point is that, even if nominal retail posted prices in the U.S. market seem higher than in Western Europe, Japan, South Korea or China, PPP prices in all countries are about the same. 

Policymakers typically want their citizens to have quality broadband access at affordable prices, but have the luxury of setting policy without consequences. Internet service providers face very real consequences if they guess wrong about competitor supply and consumer demand. 

As recently as 2016, for example, there were eight facilities-based mobile operators in India. In early 2020, there are just three, and many expect just two are expected to be in operation by 2021, as Vodafone Idea might simply go bankrupt. Sustainability therefore is a real ISP issue, and prices matter. But it is harder than one initially believes to determine what “price” is, in any market. 

Real Internet Access Prices are about $50 a Month, Globally

Some argue U.S. consumers suffer from high prices for internet access. It is a highly-nuanced matter, though. Some issues are methodological. To make a valid price comparison, any researcher has to choose a method--picking plans that are widespread enough to be comparable across many or most nations.


Then one has to adjust prices using some measure of currency conversion that accounts for relative price differences for all manner of goods and services in any particular country. The reason is that general price levels for the same products are higher or lower in different countries, across the board. 

Add to that cases where half of all purchases occur in bundles that obscure the “price” of service. 

Then there is the matter of value. Price is one thing, while typical speeds and service quality or(outage performance) are different. There is no convenient way to adjust prices to incorporate quality differences (cost per Mbps, for example).

Also, customers in different countries buy different plans. As always, the method of determining “average” matters. Median (half higher, half lower) prices can be quite different from “mean” prices (average of all plans) when plans cover a high range (high to low). 

It matters greatly which plans are most-often purchased, in other words. In the U.S. market, 60 percent to 75 percent of internet access plans are bought in a bundle, so there is no way to directly state the internet access price. Price has to be inferred. 

To my knowledge, nobody actually uses bundle prices to compare internet access prices across nations. So comparisons are made on the basis of published retail prices for stand-alone internet access. By definition, up to 75 percent of U.S. consumers do not buy internet access that way. 

So the price comparisons are made on the basis of retail tariffs alone, without considering the frequency of plan purchase. Under such conditions, all one can say is that published retail tariffs are at certain levels. That tells us nothing about which products customers actually buy, at what volume, and therefore the effective or actual purchase price.

The further nuance is that posted retail prices often are not “final prices” paid by consumers, since taxes, fees, equipment charges and so forth are included. No comparison of retail prices captures the final price. 

In the U.S. market, where 60 percent to 75 percent of all purchases are on bundle plans where price cannot be determined, prices are inferred based on allocations. The easy method is to take the total price of the bundle and then divide by the number of services in the bundle to derive an “average” price. 

There are obvious methodological issues. Video service tends to be twice as expensive as internet access. And internet access tends to be twice as expensive as voice service. So some method of weighting is required. So the cost pattern is 4:2:1. 

Consider a bundle costing $175 a month. The simple “divide total cost by number of services” method gives you a mean cost of $58 a month for each service.

That ignores the retail price differential for each service, however. Retail prices might have a pattern something like $90 for video, $50 for internet access and $30 for voice (after including taxes, fees, customer equipment rentals). So the $175-per-month bundle has video at 53 percent of total cost, internet access at about 29 percent of total cost, and voice at about 18 percent of total cost. 

So in a $175 a month package, internet access might cost about $50 a month (including taxes, fees, CPE). That is just an allocation, though. One could argue for a higher or lower price, making different assumptions about the cost of the other components. Video often represents a higher cost, voice arguably a lower cost, in many packages. 

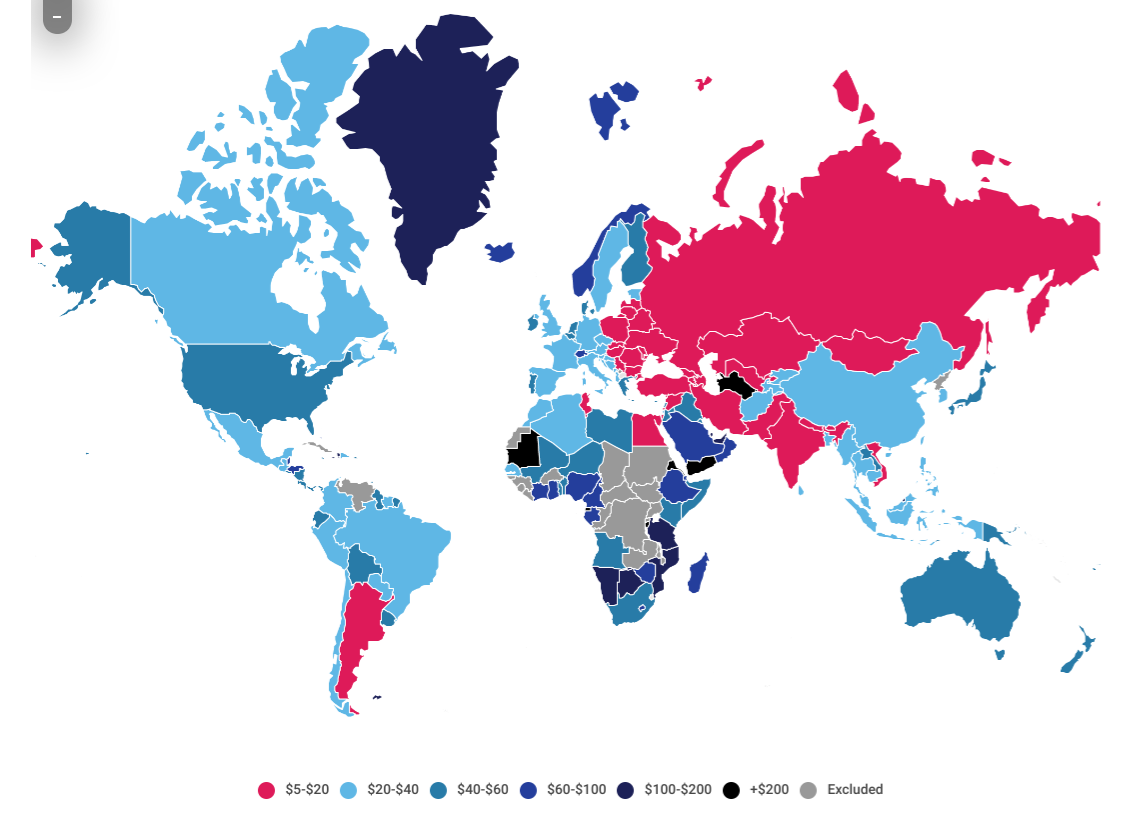
And then one has to adjust for internet access price tiers, since faster service costs more than slower service. This deconstruction of bundle prices actually agrees with the cable.co.uk estimates. 

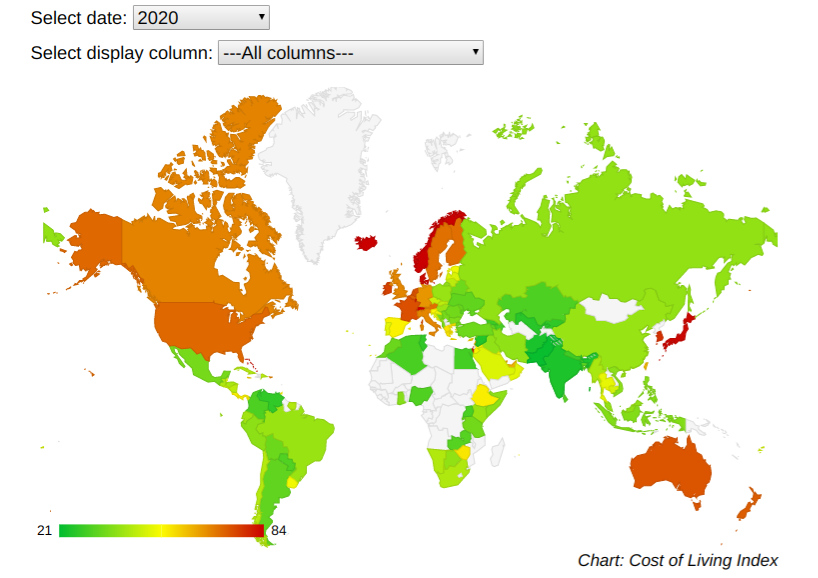
Those prices are not adjusted for price levels in each country, however. So comparisons often adjust for purchasing power parity, normalizing for general price level differences across countries. This look at country cost of living indexes, for example, shows areas in red that have higher living costs generally. So all prices would normally be expected to be higher in those areas. Note that these comparisons are not adjusted for purchasing power parity, though. 


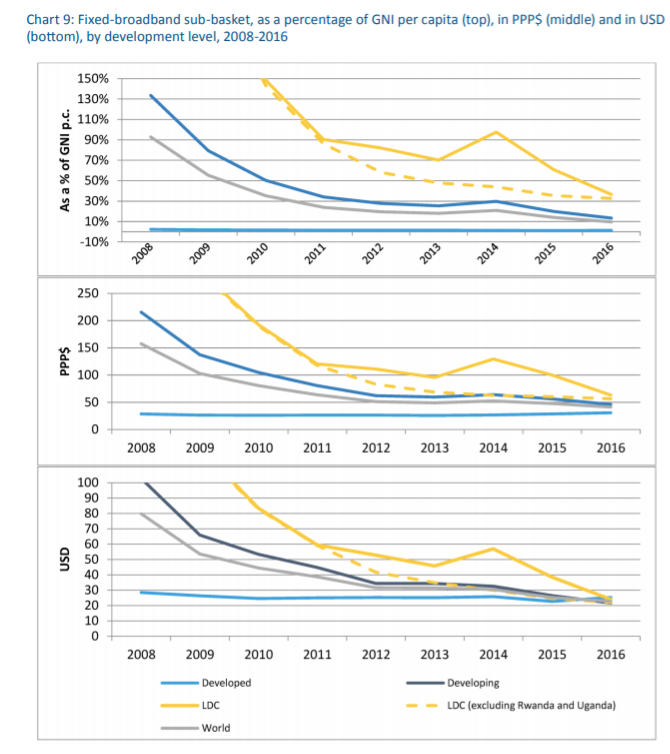
One analysis of the costs of fixed network internet access, using the purchasing power parity method, shows that by 2016, internet access prices--adjusted for differences in local prices--actually were quite consistent across nations.

In all countries, prices hovered around a $50 a month level, after PPP adjustments. 

The point is that, even if nominal retail posted prices in the U.S. market seem higher than in Western Europe, Japan, South Korea or China, PPP prices in all countries are about the same.

How Much Revenue Do AWS, Azure, Google Cloud Make from AI?

Aside from Nvidia, perhaps only the hyperscale cloud computing as a service suppliers already are making money from artificial intelligence ...