Saturday, February 20, 2021

How fast Will Fixed Networks Be, by 2050?

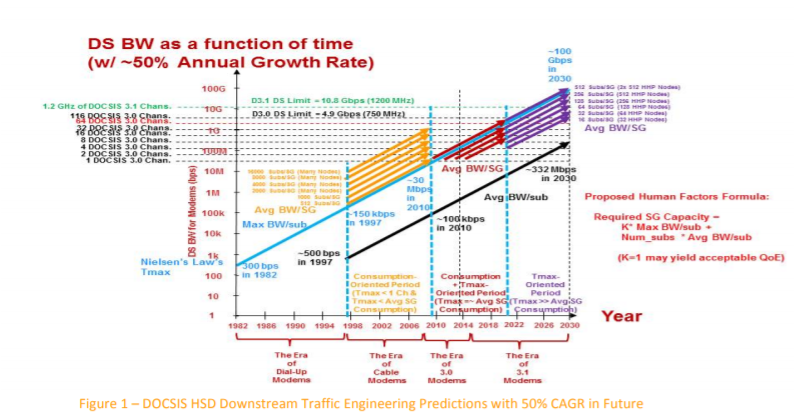
How fast will the headline speed be in most countries by 2050? Terabits per second is the logical conclusion, even if the present pace of speed increases is not sustained. Though the average or typical consumer does not buy the “fastest possible” tier of service, the steady growth of headline tier speed since the time of dial-up access is quite linear. 


And the growth trend--50 percent per year speed increases--known as Nielsen’s Law--has operated since the days of dial-up internet access. Even if the “typical” consumer buys speeds an order of magnitude less than the headline speed, that still suggests the typical consumer--at a time when the fastest-possible speed is 100 Gbps to 1,000 Gbps--still will be buying service operating at speeds not less than 1 Gbps to 10 Gbps. 


Though typical internet access speeds in Europe and other regions at the moment are not yet routinely in the 300-Mbps range, gigabit per second speeds eventually will be the norm, globally, as crazy as that might seem, by perhaps 2050. 


The reason is simply that the historical growth of retail internet bandwidth suggests that will happen. Over any decade period, internet speeds have grown 57 times. Since 2050 is three decades off, headline speeds of tens to hundreds of terabits per second are easy to predict. 

source: FuturistSpeaker 


Some will argue that Nielsen’s Law cannot continue indefinitely, as most would agree Moore’s Law cannot continue unchanged, either. Even with some significant tapering of the rate of progress, the point is that headline speeds in the hundreds of gigabits per second still are feasible by 2050. And if the typical buyer still prefers services an order of magnitude less fast, that still indicates typical speeds of 10 Gbps 30 Gbps or so. 


Speeds of a gigabit per second might be the “economy” tier as early as 2030, when headline speed might be 100 Gbps and the typical consumer buys a 10-Gbps service. 


source: Nielsen Norman Group 


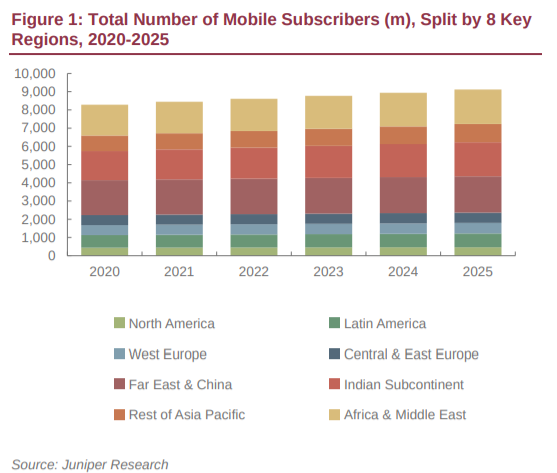
If consumers on every continent purchased service at equivalent rates, in 2050 one would expect Asia to represent nearly 60 percent of demand, Africa nearly 20 percent. Europe would represent seven percent of demand, South America nine percent, North America four percent. 


source: Chegg 


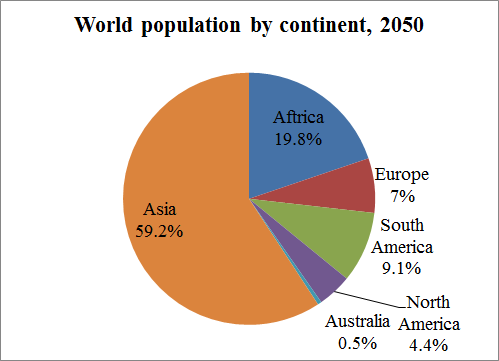
Most observers would guess Asia will do about that well, while Africa lags. Europe and North America likely will over index, while South America might do about what the population alone would predict. 


Though the correlation might be less than one might expect, fiber to home deployment should correlate with terabit take rates in 2050. The wild card is 8G mobile access. As mobile speeds likewise continue to increase, most consumers might prefer wireless access to any fixed connection. 


In mobility as in the fixed network, the theoretical headline speed is not matched by mass market commercial experience. Still, the pattern has been that each next-generation mobile network features data speeds an order of magnitude higher than the prior generation. 

source: Voyager8 


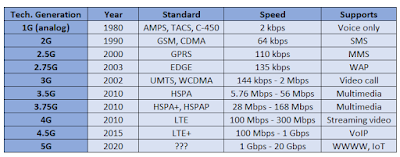
Assume that in its last release, 5G offers a top speed of 20 Gbps. The last iteration of 6G should support 200 Gbps. The last upgrade of 7G should support 2 Tbps. The last version of 8G should run at a top speed of 20 Tbps.


At that point, the whole rationale of fixed network access will have been challenged, in many use cases, by mobility, as early as 6G. By about that point, average mobile speeds might be so high that most users can easily substitute mobile for fixed access.


Friday, February 19, 2021

When Will Travel Approach Pre-Covid Levels, and What Does it Mean for Telecom Revenue?

Travel behavior has had a significant impact on mobile revenues globally, primarily in the form of reduced roaming revenues, though some reduced upgrade or new account activity might also be an issue. By definition, a return to pre-pandemic travel is key to restoring roaming revenue volume. 


Some believe recovery will take a few years. 


Global spending on business travel is expected to show a 52 percent decrease for all of 2020 (to $694 billion), down from $1.4 trillion in 2019, according to the Global Business Travel Association, an “unprecedented” decline. 


“The magnitude of these losses and their impact on travel suppliers is unprecedented: the 2020 business travel spending losses are expected to be 10 times larger than the impact of either 9/11 or the Great Recession of 2008,” says GBTA. 


More significantly, GBTA expects a 21-percent increase in business travel spending is projected in 2021, mostly at the end of 2021. A full recovery to pre-pandemic levels is not expected until 2025.


Consumer travel demand also matters. In that regard, one analysis suggests travel tops the list of things U.S. residents want to do after they get vaccinated, a survey by Ipsos finds. And there appears to be significant pent-up demand. 


About 40 percent of respondents say they’re saving more now than they were before the pandemic, and most people who have plans for the money say they’re saving it for travel.


About 19 percent of survey respondents say they’re saving for a domestic trip by plane, while 16 percent say they’re saving for a domestic road trip. About 15 percent say they’re saving for an international trip.


source: Ipsos 


So 2021 might still be a challenging year for mobile operators, in terms of revenue growth.


Thursday, February 18, 2021

Small Business a "Big" Opportunity?

Some might criticize connectivity service providers for ignoring the "small business opportunity." But that opportunity is smaller than one might think, not because there are few such firms, but because their buying patterns often are not so different than those of consumers.


Also, profit margins are slim enough that not much personalization or customization is possible.


Since perhaps 99 percent of global businesses are “small,” many would note, while the enterprise market is the “less than one percent,” it sounds logical enough that small business effort would pay off. Or not. 


The traditional problem connectivity providers have serving the small and mid-sized business market (depending on which definitions are used) is profitability. No retail service provider serving the mass market can afford to sell using the same channels as dedicated to an enterprise account.


Most U.S. “small” businesses, for example, have zero employees. A small percentage have between 20 and 499 employees. At the high end, many would consider an organization to be “mid size.”


source: Small Business Trends 


In Canada, for example, any organization with 100 to 499 employees is considered a “medium-sized” business. About 70 percent of businesses have one to 99 employees. 


source: Govt. of Canada


Of some 5.7 million U.S. companies in 2012, 90 percent had fewer than 20 employees


source: U.S. Census, DB Global Markets 


U.S. firms with at least 500 employees, which we might all agree is the lower end of the enterprise market, represent a fraction of one percent of all firms. Even including firms with 100 to 499 employees, such firms represent just 1.6 percent of U.S. establishments. 


The point is that the enterprise market is highly concentrated and operates at a scale vastly different than the typical firm. 


source: Census Bureau, Advance Iowa 


That is why channel partners--interconnects for enterprise phone systems; system integrators for local area networks; managed service providers for apps; distributors for LAN gear--historically have served the needs of smaller businesses and organizations. 


In the same way, specialized business phone companies have served the needs of business and organization customers who want to “create their own voice services” using phone switches or key systems. 


In other words, connectivity providers are never so good at serving the needs of either enterprise, mid-market or small business customers. That is why all the other channel organizations exist. 


source: U.S. Census Bureau, The Conversation


The phrase “mass  markets” illustrates the issue. As a practical matter, a retail connectivity provider cannot afford to market and sell to a small business in any way too different from the way it markets and sells to consumers, because the gross revenue and profit constraints are quite similar. 


Enterprises are supported by a direct sales force. Other mid-sized organizations are supported indirectly, using channel partners. Consumers are reached using advertising and retail stores. And small business is supported the same way as the consumer segment. 


As service providers have sought on-demand control for decades, so customers will benefit from on-demand provisioning and configuration, if possible. 


Still, most of the value small businesses will seek is provided by apps, not connections. The ability to order, provision and change bandwidth levels on demand, while helpful, is not as helpful as the ability to add, drop and reconfigure apps. 


Yes, there are many small firms, but the cost of marketing, selling and fulfillment does not leave very much room for personalized attention or customization, at least not the traditional way. 


Beyond that, connectivity providers typically do not own the actual business apps customers want to buy. 


The “small business opportunity, in other words, is smaller than many would hope.

Has Innovation Suffered from "Work from Home?"

It is hard to measure either the innovation or productivity of office or knowledge work. But one study of European workers and managers suggests innovation might not be faring so well under mass work-from-home conditions. At least, that is what people believe. 


Such “where do we work?” issues shape the fortunes of enterprise application, infrastructure and connectivity service provider revenue expectations. But the ultimate balance of work locations is yet to be settled. 


Employees often like working from home. “However, the cost seems to be a loss of sense of purpose, which at work, is largely driven through strong and cohesive relationships and seeing how your tasks have impact on others,” says Dr. Michael Parke, professor at the Wharton School of University of the Pennsylvania, and leader of the study team.  “Both of these are more easily accomplished when people work co-located and are more challenging when working virtually.”

source: Microsoft 


Most respondents and managers do not believe productivity is the biggest risk of mass scale work from home policies. 


When asked about the biggest challenges associated with working remotely, the top responses among employees were 

  • maintaining company culture

  • maintaining team cohesion

  • coping with increased silos 


Among leaders, 39 percent say they struggle to maintain a strong and unified team culture. In 2019, some 56 percent of leaders said their companies are highly innovative. Just 40 percent believe that is true in 2020. 


“It’s only logical to expect to see a drop in innovation, as it’s hard for new ideas to thrive in an environment where people feel more disconnected from their employer and their teams,” says Microsoft. 


“The key takeaway from all of this is that the success of teamwork in a more hybrid world goes beyond just having the right technology tools. Innovation is fueled when people feel empowered to connect with colleagues, take smart risks and speak up when they have new ideas,” Microsoft says. 


As almost always is the case, leaders fare better than laggards. “We also found that organizations with innovative cultures see more of the benefits and less of the costs with remote or hybrid work,” said Parke. 


Employees say WFH means they are wasting less time than they did in the office, but not as much as you might think. 


In 2019, survey respondents reported that 52 percent  of their working day was wasted because of interruptions; meetings and calls with no clear agenda; and searching for information.In 2020, remote workers said 41 percent of the day was wasted.


One might ask whether productivity and innovation can be clearly separated, though one might say productivity is simply a measure of efficiency, while innovation is more a measure of effectiveness, in any industry where “creating new things matters.” On the other hand, innovation also can be process innovation, which contributes to efficiency.


In the end, it might be nearly impossible to separate innovation from productivity.


Tuesday, February 16, 2021

Business Voice Market is Substantial, "Lines" Less So

If the cloud-based PBX or hosted voice market grows as much as many expect, it will easily eclipse the value of the business phone system market. That could well be the case even if the number of new sales is roughly half owned switches and half managed services. 


On the other hand, hosted voice and PBX switch sales are likely to remain a small part of the overall unified communications market, now dominated by messaging and conferencing, and should remain a small part of the overall business voice market as well. 


It might seem logical that cloud voice services would displace nearly all premises switches and “do it yourself” business voice. But the key fact about hosted voice services is that they are more expensive, at scale, than use of a premises switch. 


In other words, large enterprises often save money by owning their own switches, rather than buying hosted services. 


source: Technavio 


In 2020, hosted PBX might have claimed 40 percent of all PBX services acquired by mid-market companies and 20 percent of new seats added by enterprises, according to Eastern Management Group. In 2010, hosted PBX was only four percent of all phone systems shipped. Now it’s 28 percent, Eastern Management says. 


source: Eastern Management Group 


A reasonable estimate of potential PBX and hosted voice market value is that the global business phone system market, plus UCaaS alternatives, in 2014, was less than $2 billion. Assume that is all fixed network related and represents “phone line” services. 


If every premises switch customer switched to UCaaS, that might suggest a potential global fixed network business phone line market between $2 billion and $3 billion, including both UCaaS and infrastructure (business phone system) purchases. 


The mobility business, and business fixed voice overall, arguably are far bigger revenue streams. 


Total global voice public network service revenue might be in the range of $175 billion a year, including consumer and business users. Mobile might represent about $115 billion of that, with fixed network voice contributing $59 billion. 


Assume business voice revenue is 30 percent of total. That implies global fixed network business voice recurring revenue of about $18 billion, with business mobile service revenue of about $35 billion. 


Contrast that with the estimated unified communications market--which includes those expenditures-- estimated at between $16 billion and $48 billion a year in revenues, or even total business and government spending on communications. 

source: Forrester Research 


The issue for communications service providers is that much of UC is a feature of an app, not a recurring service. 


Some might quibble about whether there is a difference between unified communications as a service and communications platform as a service, which includes a range of features or services including messaging technologies (text messaging or SMS, RCS (Rich Communication Services) and OTT messaging), push notifications, voice services and email, and represents service provider UCaaS. 


CPaaS generally is defined as cloud-based way of creating and delivering communication services, as opposed to a premises business switch, for example. Juniper Research argues that “the value of the individual services CPaaS offers is quite low, however.”


The specific value of business voice likewise arguably also is low, though a required feature of business communications. 


Indeed, email use is possible at almost zero incremental charge for enterprises, and often at zero incremental charge for consumers. Over the top messaging likewise often is available for no incremental charge for any consumer user, with some possible incremental charges for business messaging apps. 


Voice services might be available for use at zero incremental cost, negligible cost or relatively small cost. Many mobile service providers, for example, offer unlimited messaging and voice use in domestic markets, with affordable roaming charges. 


Voice assistants, including smart speakers, also increasingly are able to connect callers to public networks. In that instance, voice-enabled speakers simply operate as any other voice device able to connect with the public network and telephone numbers. 


Juniper suggests higher value--and implicitly higher service provider revenues--can be generated if the functions are bundled. Some will question the premise.


Unified communications have become “more unified,” adding more functions, over the last few decades. But most of the revenue still is earned by app providers or switch providers, not connectivity providers. 


Mobile video calling is mostly dominated by third party app suppliers such as Zoom, or enterprise calling services running over the top of standard internet connections. As always is the case, those apps, use cases and revenues do not flow to the access provider, but to the app provider. 


It arguably is the case that simple mobile service is a bigger revenue driver than UCaaS for connectivity providers. 

source: Juniper Research 


Voice is a Small Part of Unified Communications

Value and competition pose major problems for public network unified communications service providers, in part because voice services contribute relatively little to overall unified communications value and revenue.


And, historically, much of the demand is supplied by third party application, managed service or infrastructure providers. 


Business UCaaS often is provided by third parties and the market potential is bounded by the number of firms that can justify a UCaaS solution rather than owning their own switches. The other complication is that UCaaS includes both a “do it yourself” and a “services” segment, as enterprises often own their phone switches while smaller entities buy a managed service.


Consider the conferencing segment of unified communications. Audio conferencing arguably has been led by third party managed service providers, not telcos. 


A reasonable estimate of potential market value is that the global business phone system market, plus UCaaS alternatives, in 2014, was less than $2 billion. If every customer switched to UCaaS, that might suggest a potential global business voice market between $2 billion and $3 billion.


source: Global Market Insights 


So all the rest of UC revenue is something else: conferencing services and gear, access connections, messaging services or systems. The voice function, as such, is a small part of the overall UC market. 


Though historically dominated by enterprise DIY deployments and small business managed services, the big boom in video conferencing has been captured by third party services such as Zoom not traditional communications service providers. 


By some estimates, UCaas revenues in 2020 are about $16 billion. Others estimate revenue at $48 billion or higher amounts.  


Estimates often vary because different products are included in the definition. Some analysts consider access services used to support UCaaS--such as SIP trunks--as within the category. Others do not. 


The clear takeaway is that business voice revenues are a small part of overall unified communications demand, value and spending.


Saturday, February 13, 2021

How Cloonan's Curve Suggests Cable Operators Can Extend the Life of HFC

Nielsen’s Law of Internet Bandwidth states that a high-end user’s connection speed grows by 50 percent each year, doubling roughly every 21 months. That suggests a top-end internet access connection in 2025 will offer 10 Gbps speeds in the downstream. 


But it is reasonable to assume Nielsen’s growth rates cannot continue forever, as 50 percent compounded growth without end has some physical limits (time, physics, cost, demand, substitutes). At some point, as was true with personal computer processors, parallel processing becomes the method for boosting performance, while raw processing itself loses relevance as a product differentiator. 


In the consumer internet access space, that suggests both new ways of supplying bandwidth, less value produced by ever-increasing speed offers and a shift to other forms of value. 


Nielsen’s Law only predicts the top speed available for purchase, however, not the average or typical speed a consumer might buy. It has taken quite some time for customer uptake of gigabit internet access services to reach as much as eight percent share of total, for example. 


Keep in mind that the first U.S. gigabit services began commercialization in 2013. It has taken seven years for adoption to reach eight percent of the installed base, in part because that grade of service is not universally available in the U.S. market, for example. 


Cloonan's Curve provides a way of estimating bandwidth speeds purchased by cable modem customers, in relation to the headline speed (Nielsen rate). Most customers do not typically buy the fastest-available service, as that also is typically the most-expensive tier of service. Instead, they tend to buy the mid-level service. 


The caveat is that Cloonan’s Curve obviously does not apply to service providers that sell only a single tier of service, at the advertised headline rate (“gigabit only,” for example). 

source: Commscope


This illustration of downstream bandwidth plans actually purchased by customers suggests that although both Nielsen and Cloonan rates increase at about 50 percent per year, most customers buy services that offer six times to 20 times less speed than the fastest-available service tier. 


Think of the fastest tier of service (1 Gbps, for example) as the “billboard tier” that is featured in service provider advertising as the “speeds as fast as X” rate. Then consider the “common or popular tiers” as those in the middle of the offered speed ranges. Then there is an “economy tier” for customers with light usage patterns, limited app requirements or willingness to pay profiles. 


That has implications for network planning, bandwidth upgrades and marketing. Internet service providers can advertise the headline speed knowing that a small percentage of customers are going to buy it. 

source: Commscope


Networks obviously must be designed to deliver the headline rate. But total bandwidth consumption, which affects the capabilities of the rest of the network, does not assume that every customer buys the headline rate service. Instead, the variable portions of the network can be designed on the assumption that most customers will, in fact, not buy the headline service. 


Since speed and data consumption tend to be correlated, that affects capacity planning for backhaul, for example. Simply, the Cloonan Curve informs thinking about how much capacity must grow to support the actual mix of demand from the full set of customers, based on their actual buying patterns. 


That is important to match capital investment as much as possible to the variable demands placed on the network by various customer groups. 


For a cable ISP, there are other implications. At some point, it will make sense to migrate the highest-usage customers--often identical with those buying the headline service--off the hybrid fiber coax network and onto a parallel access network using fiber to the home instead. 


It is common to find that the top one percent of customers generate as much as 15 percent of total network usage, for example. So moving those customers off the core network frees up considerable capacity for the rest of the customers, 90 percent of whom might be supported on the legacy access network. 


That allows a longer useful life for the HFC network, as most customers will continue to buy the popular and economy tiers of service that still can be supported using HFC. 


Nielsen’s Law does not account for upstream bandwidth, however. Upstream capacity tends to grow at about half the rate of downstream bandwidth, or about 25 percent per year. 


Customer behavior also varies. On cable networks, the heaviest users (one percent) of customers generate as much as 47 percent of upstream bandwidth. And it often is the case that 80 percent of total upstream capacity demand is generated by just 10 percent of total users. 


ISPs using telecom platforms also will confront that same general issue of bandwidth growth, and the differential demand for tiers of service. Fiber to home platforms keep increasing performance as well, and some suggest future performance will be boosted economically based on use in the local loop of components originally commercialized to support data center optics. 


That is why 25 Gbps passive optical networks initially deployed for business-to-business applications in the local loop will be powered by commercial availability of data center optical components, Nokia argues. Commercialization for B2B use cases should then be leveraged for B2C applications as well. 


Nielsen’s Law and Cloonan’s Curve also suggest the potential limits of HFC as a platform. If consumer usage patterns do not change; if ISP usage policies do not change; if app usage patterns do not change; if pricing patterns do not change, then there is a point in time where HFC fails to support cable operator business models. 


The point of overlaying FTTH for the heaviest users is that, all other things being equal, the useful life of HFC is extended, with a more-gradual shift of cable platforms to FTTH over time. 


The issue is to avoid the stranded capital problem and immediate higher capital investment implications of a jump cut to FTTH. That would be as difficult for cable operators has it has proven to be for telcos.


How Much Revenue Do AWS, Azure, Google Cloud Make from AI?

Aside from Nvidia, perhaps only the hyperscale cloud computing as a service suppliers already are making money from artificial intelligence ...