Tuesday, January 3, 2023

What Speed Tests Might, and Might Not, Indicate

What does this plot of speed tests conducted by U.K. consumers tell us? In principle, it only tells us that there are fewer tests on copper connections; about the same number of tests on hybrid fiber coax networks; declining tests on fiber-to-curb networks; while fiber-to-home customers conduct more tests.


Presumably, the number of tests is related to the number of accounts. But the number of tests also could be related to the number of trouble tickets or network issues. Most of us are prompted to test only when there is some obvious connectivity issue. 


But it also is possible that users on some of the latest networks (FTTH) are testing for other reasons, such as verifying that speeds are really faster than on the older networks. 

source: Think Broadband 


Also, since most such tests appear to be conducted from Wi-Fi-connected devices, the number of tests also likely reflects Wi-Fi issues that users are having, and that is more a reflection of indoor Wi-Fi issues than a reflection of the access network connection. 


Actual internet service provider delivered speed is going to be higher than what a Wi-Fi test shows, and also could be lower if multiple other apps or multiple users are active during the test period.


Testing algorithms also vary, which is why the same device, on the same network, yields different test results when different testing services are used. All this data appears to be from the ThinkBroadband test, so results should be comparable.

The point is that historical data on "speed" is shaped by the testing methodology: users mostly test on Wi-Fi, which almost always is slower than the ISP's "to the home" speed.

Monday, January 2, 2023

Which Path for Video Streaming?

It is not yet clear whether video entertainment facing internet disruption will follow the path of the music and print media industries, or somehow can evolve in a way similar to retailing. In other words, will the future video entertainment business be bigger or smaller than the linear business it displaces?


It is conventional wisdom these days that video streaming has failed to replace losses from linear TV subscription declines. In some ways, the comparison is a bit unfair. Streaming is a new business, which means development costs and investments are high, compared to customers and revenue, as generally is true for most new lines of business being created for the first time. 


Linear video subscriptions are a declining line of business, but can be harvested for revenue without undue investments. So we are comparing a declining business with a growing and new line of business. One can harvest revenues from a legacy business. One has to invest to grow a new one. 


Also, in a linear video model, content providers can spend less on delivery infrastructure, as the distributor takes care of that. In a streaming model, the delivery infrastructure has to be built. 


In the linear model, content provider marketing costs are lower, as the distributor takes primary charge of that function and absorbs the cost. In a direct-to-customer streaming model, the content provider has to spend more on marketing and sales. 


There are other differences as well. Customer churn--which increases operating costs--for streaming services is higher than for linear TV services. One big reason is that customers can binge watch a hot new series and then churn off once they are finished. 


Also, a linear video package is itself a bundle, with economy of scope advantages. Most buyers are aware that buying in bulk correlates with lower cost per unit. Unbundling content eliminates much of that advantage. To be sure, any single streaming service remains a bundle of content. 


If you think about one of the main complaints about linear TV, which is that customers pay for products they do not use, you get the idea. The linear bundle increases profits for the whole ecosystem because customers are forced to buy products they do not want, do not use, do not value. 


The economic argument is quite similar to that the industry debated a couple of decades ago: whether unbundled, a la carte network access would at least be revenue neutral compared to the existing cable TV bundle. A la carte sales models imply lower ad revenues, lower subscriber counts and therefore lower subscription revenues. 


In principle, ability to buy content “by the piece or by the episode”  allows customers to buy only what they want. And consumers resonate with that idea. The issue is whether content suppliers can afford to grant access at sustainable prices. Consumers almost always value a bit of content less highly than the content owners selling it. 


Most consumers already have discovered they need more than one streaming service to satisfy their needs. Ironically, that defeats the purported value of “lower prices” for any single streaming service. 


But content scope never is as great as with a linear package, which delivers many networks. Each streaming service is, in essence, a single network. Today, most content providers make most of their money selling content rights to cable TV providers. As that revenue stream shrinks, it is poised to shrink faster than streaming revenues can replace the losses.


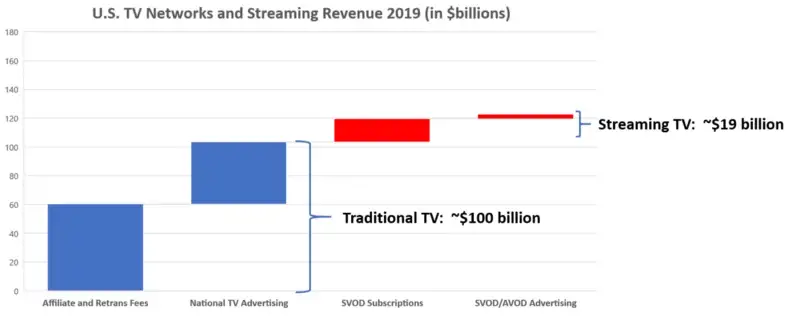
source: MoffettNathanson


Of course, the linear video model has gotten more precarious for lots of reasons beyond the existence of video streaming alternatives. As content prices have kept climbing, it was inevitable that the cable TV bundle would reach a level where the value-cost relationship would be seen as unfavorable by a growing number of consumers.


Unbundling video content access almost inevitably leads to higher costs per unit, for suppliers and consumers. It is possible a smaller industry therefore results, as less-popular networks get squeezed out. 


Of course, under some circumstances, unbundling also might allow some niche content to thrive. As has become the case in the music industry, where consumers now buy “songs” a la carte rather than “albums” (a bundle), some niche formats might find a way to survive. 


But that survival also likely will hinge on creation of new revenue and monetization mechanisms, as most bands now make their money from concerts, not selling pre-recorded music. 


For programming “networks” (streaming services as well as broadcast TV or cable networks), survival might require expanded business models where the networks themselves are not required to generate high profits, but enable some other revenue model to to flourish. One thinks of Amazon Prime, where the revenue comes from memberships and higher e-commerce transaction volumes. 


Streaming has not, so far, proven able to replace lost linear video losses. Whether that always will be the case is the issue. 


E-commerce arguably has not led to a smaller retail industry, as much as it has reshaped the fortunes of legacy suppliers. But most would likely agree that newspaper/magazine (print) industry revenues are lower than before the online disruption.


The music industry might arguably also be smaller than before online music distribution. Whether video content follows the path of print media and music, or the pattern of retailing, is not yet clear.

Sunday, January 1, 2023

Methodology Always Matters When Measuring Price Changes for Home Broadband

When tracking any market, one has to be clear about what constitutes “the market.” If one wanted to track home broadband prices, for example, the inclusion of a huge amount of non-related services would skew the data. 


The U.S. Bureau of Labor Statistics, for example, includes “landline, telephone and TV services bundled with residential internet service; mobile internet access” in the definition. 


The BLS uses the same approach for “cable TV service.” The big problem, in the U.S. market, is that most consumers buy their services (home broadband, subscription video, fixed network and mobile voice) as a bundle. By some estimates, in the U.S. market, 60 percent to 75 percent of internet access plans are bought in a bundle. 


The same is true for European Union markets, where over a third of all consumer services--both fixed and mobile--are bought in a bundle.  


In some markets more than 90 percent of services are purchased as part of a bundle.  


So one has to make assumptions about how to apportion the “cost” of each bundle element. It is not clear that the BLS has a procedure for doing so, and if it does have a methodology, it does not publish the assumptions. 


What BLS does say is that “when selecting samples in either the residential telephone services, internet services, or cable and satellite televisions services categories, if a bundled service is selected, it is assumed the customer’s primary intent is purchasing the service defined by the CPI category,” says BLS. 


For example, phone service must be included in the service bundle along with either internet or television services when selecting the sample in the residential telephone services category, says BLS.


To be sure, in principle, it should not matter what the stated rates are. Only the cost differential matters. The issue is that if bundle elements change at different rates, or in different directions (up or down), the bundle price changes only partially reflect price changes for the “lead” service. 


In other words, if home broadband prices decline, but video and voice charges climb, there is some distortion. Prices could have risen or dropped based on implied price movements for the other components of the bundle. 


That is particularly the case when video prices are part of a home internet bundle. 


source: BLS 


The point is that when large percentages of consumers buy services in a bundle, BLS attributes all of the bundle cost to one service selected by survey respondents. The time series data, in principle, should then not be affected, as the only metric tracked is degree of change for the bundle. 


In practice, it might matter which of the bundle components are selected, as price change rates vary for each major bundle element. Video prices increase the most, followed by voice service. Home broadband prices decline. 


In other words, if a survey respondent chooses “home broadband” as the anchor bundle service, then the cost of TV and voice, when applicable, are said to be part of “home broadband” cost. In principle, home broadband costs then are inflated. 


The reverse is true when “video” is selected as the anchor service. Then the lower price of home broadband understates video price changes. 


Separately, the BLS now uses a hedonic method to account for changes in product quality. In other words, BLS accounts for qualitative changes to existing products (computers, home broadband, for example) where performance changes dramatically for a class of product, over time. 


source: BLS 


As always, when measuring price changes, the details and methodology do matter. 

---------------------------


Saturday, December 31, 2022

TCP/IP Choice Also was a Business Model Choice

Every now and then, when trying to explain to regular people how networks support the internet, one also realizes how much networks have changed over the last 50 years. Diagrams back then would have emphasized switches more than transmission; local loop more than wide area network; fixed network to the exclusion of mobile; hierarchical call flows more than horizontal data routing. 


To some extent it remains true that we can diagram traffic flows separately from switching operations, only routers and servers are the nodes. 


Computer networking including X.25 featured much flatter networks based on peering relationships between switches. Details of the transport and access networks were relatively immaterial. 


So these days we routinely abstract the details of the WAN when diagramming local networking. There are edge devices and users and servers located somewhere “in the cloud.” One might argue that details of the network always are hidden from end users. These days, even network architects routinely abstract those details, spending most of their time on the edge devices (servers and client devices). 

source: Researchgate 


One might still argue that most of the complexity remains at the edge and in the local or “last mile” networks. It remains true that the bulk of total network cost resides in the local or access networks, not the wide area transport network. 

source: Asian Development Bank 


Functionally, all public communications networks now are data networks. That has enormous business model ramifications as well. Where is the value in a data network? At the edge: end user devices; servers; software and solutions. Data transport is a cost and necessity: it must be present, but beyond that, value lies in the devices, software and business problems solved. 


Physical media choices have changed quite a lot. Fixed networks now include hybrid fiber coax networks, mobile access and Wi-Fi as building blocks for local connectivity. 


But the biggest change is that all networks now are essentially open (though governments still can block traffic), not closed. Use of networks is permissionless. No business relationship has to exist between any application and the network resources that app uses. No business relationship has to exist between a user’s choice of apps and the network, beyond access to the network itself. 


Most of the business model issues connectivity providers now face can be traced back to the switch in network architecture. In choosing data network protocols, and choosing to become data networks, connectivity providers also opened the door to “dumb pipe” value propositions.


Friday, December 30, 2022

FTTH Does Not Predict Gigabit Take Rates

The latest data on United Kingdom fiber to home coverage shows that FTTH availability  is not the same thing as “homes that actually buy FTTH service.” First of all, there are alternative cable hybrid fiber coax networks that seem to represent the majority of U.K. accounts buying service at gigabit-per-second rates. 


source: ThinkBroadband 


That is not to deny FTTH adoption rates will climb over time. But FTTH availability does not highly correlate with consumer demand. Nor does FTTH availability highly correlate with “speed tier purchased.”


In the U.S. market, for example, AT&T says that about 30 percent of customers in areas where FTTH is available buy a speed tier of 1 Gbps. The rest buy some other lower speed tier. 


The implication is that FTTH enables faster speeds, but customer demand does not highly correlate with uptake of service tiers at the highest advertised available rate. FTTH might be “necessary” for some internet service providers, but it is not “sufficient” to drive gigabit service tier take rates. 


Customers tend to buy service plans that offer neither the slowest speeds nor the fastest, but someplace in the middle that offers a value proposition that is “good enough quality for a reasonable price.”


In markets with competitors using their own facilities, take rates for the fastest tiers of service might always be limited, as competent competitors will get a significant share of what demand exists. 


In two-provider markets, that share could range from 40 percent to perhaps 50 percent. In markets with multiple providers operating at scale, it is conceivable that take rates could dip into the 20ish-percent range. 


That degree of market share is likely sustainable for firms with low operating cost structures. Others might find they are not profitable at levels below about 30 percent.


Monday, December 26, 2022

FTX is Like Enron Broadband, WorldCom: Fraud Amidst the Hype--and Ultimate Reality--of Big Next Things

Most commentators have likened the scandal over FTX  to the Ponzi scheme run by Bernie Madoff. 


Some of us see more analogies to Enron Broadband and WorldCom. In both those cases, promising and hyped technology-based businesses mixed with hyper-aggressive accounting and outright fraud, ultimately leading to bankruptcy that was a contagion spreading to the rest of the industries they touched. 


Enron’s collapse, along with that of Worldcom, led to jail terms for CEOs and exposed other inflated oversupply issues that took a good decade to work off. Doubtless, the FTX scandal has caused some spillover in the blockchain and cryptocurrency spheres that likewise will take some time to work off, as excess capacity roiled the transport business for years.  


But Enron, Worldcom and FTX also illustrate the excessive optimism that often accompanies big shifts of business and technology revenue opportunities. For Enron and Worldcom, the driver was the emergence of the internet. For FTX, it was cryptocurrency (not blockchain, per se). 


Back in 1999, broadband was among the hyped phrases that excited investors. Enron also traded on the promise of video streaming, which would fundamentally alter capacity demand. Enron was essentially right about that, if too early. 


Enron arguably was right about other things as well: edge data, interconnection points, content delivery networks and the massive change in global traffic entertainment video would bring. 


But it was wrong about immediate demand for bandwidth trading and streaming revenues, as well as the ability of partners to participate and trading platforms robust enough to handle such trades. 


Enron might also have missed the ability to use interconnection as a substitute for trading. These days, it is perhaps not so much capacity that is important as interconnection. And the domains that need to be interconnected are hyperscale app provider data centers and other data centers. 


As it turns out, the source of value is the interconnections, not the capacity as such, even if those two are related. 


Worldcom likewise grew on the back of a furious acquisition spree and ultimately fraudulent financial reporting as demand simply did not exist for the supply being built. 


Still, Enron was perhaps several decades ahead of the curve in wanting to create capacity trading mechanisms similar to energy trading.


Enron Broadband hoped to create a true trading platform for capacity, a business model where it would make nearly all its money from fees generated by trading, not sales of capacity, as was and remains the connectivity provider model. 


As a business model, that remains an essential foundation for any connectivity business model that is built on “being a platform.” Though the term gets thrown around casually, the platform business model is not the same as the use of the term “platform” in computing. 


For computing ecosystem participants, a platform is simply hardware or software upon which other software can run. By that definition, virtually every internet service provider is a “platform” upon which applications run. 


That does not mean ISPs have platform business models. In a platform business model, revenue is earned by facilitating transactions. Think Amazon or any other e-commerce platform, which enables buyers and sellers to conduct transactions. 


It remains to be seen whether the trading platform operations Enron Broadband envisioned will emerge. To the extent a “platform business model” requires such an exchange, it will have to do so. 


The point is that big frauds in the connectivity business or in any other business have happened at times of fervor over a “big new thing” such as the internet, video streaming or cryptocurrency. 


One has to separate the fraud from the fact and the future.


Value Add, or Core-Plus, Will Get More Attention in Digital Infra

Eventually, in virtually all phases of the computing, connectivity and software businesses, competition for any product or service eventually shifts to value add. The reason is simply that in highly-competitive markets, value-added benefits are one way to create distinctiveness while counteracting the pressure to compete on price.


Value-add also is a strategy used by firms to boost valuations. And we are likely to see more efforts in that regard in the digital infrastructure business. Investors call that a "Core-plus" strategy.


Even as digital infrastructure continues to gain a place in alternative asset portfolios built around infrastructure, the near term climate is challenging. 


In some parts of the digital infra investing business, the emphasis already has shifted to value creation, driven by near-term headwinds that put pressure on both financial returns and limit exit opportunities. 


Multiple compression also is slowing deal volume, as buyers and sellers cannot agree on valuations. 


source: BCG


Private equity markets have gotten tougher, squeezed by higher interest rates and inflation. That should apply to digital infrastructure as well, translating into fewer deals, smaller deals, some distress sales and more consolidation within the industry. Fewer exits also will happen, in some part because the initial public offering window has closed, eliminating a possible exit path. 


And, as always, rising interest rates have an inverse relationship to asset prices. Just as the costs of financing have risen, asset values have plunged along with financial returns. 


So it’s a buyer’s market, once sellers have adjusted to multiple compression and buyers have prepared for volatility. 


source: PwC


As happens with other markets, a shift in asset multiples leads to disagreements over valuation that mean fewer deals. Some believe reduced deal flow and assets under management for infrastructure could still grow by 2025, suggesting that a rough period is likely in store for 2023. As has already been the case, profits likely will be harder to come by, in the meantime. 


Value-creation mechanisms should differentiate above-average and average returns, says PwC.


AI Will Improve Productivity, But That is Not the Biggest Possible Change

Many would note that the internet impact on content media has been profound, boosting social and online media at the expense of linear form...