Monday, February 27, 2023

Will APIs Boost Mobile Operator Revenue?

Mobile operators always are on the lookout for new revenue sources, and many now hope application programming interfaces can boost revenue. 


GSMA Open Gateway is a new framework of universal network application programming interfaces (APIs) designed to provide developers with access to operator network features, starting with eight features:


  • SIM Swap, 

  • QoD

  • Device Status (Connected or Roaming Status)

  • Number Verify

  • Edge Site Selection and Routing

  • Number Verification (SMS 2FA)

  • Carrier Billing – Check Out

  • Device Location (Verify Location). 


Additional APIs are expected, and GSMA touts the move as similar in potential impact to voice roaming, in terms of enabling global access in a consistent manner. 


Edge Site Selection and Routing supports autonomous vehicles. Verify Location is expected to support  fleet management and incident reporting.


SIM Swap is intended to deter financial crime. “Quality on demand” (QoD) is expected to support low-latency applications such as drone control, robotics, extended reality and immersive online gaming, GSMA says. 


Designed to expose mobile operators’ network capabilities, the effort initially is supported by 21 mobile network operators, 


GSMA itself says the move “represents a paradigm shift.” 


Participants include America Movil, AT&T, Axiata, Bharti Airtel, China Mobile, Deutsche Telekom, e& Group, KDDI, KT, Liberty Global, MTN, Orange, Singtel, Swisscom, STC, Telefónica, Telenor, Telstra, TIM, Verizon and Vodafone.


The level of success might ultimately be determined by developer interest in using those network features and whether and how much mobile operators can create revenue models around the APIs. 


source: Yalantis 


The GSMA Open Gateway has mobile operators in the role of API Provider, while developers are API Consumers. 

source: Yalantis 


The unstated assumption is that developers will find the APIs so compelling they will pay to use them, rather than attempting to create access to those features themselves. The extent of value also hinges on whether a desired value can be sourced in some other way, or does not add enough value to warrant payment of fees.


Sunday, February 26, 2023

What does "Communications" Mean, These Days?

Words have meaning, so changes in words also can have meaning. Consider the “communications” segment of the Standard and Poors 500 index.


The "communications" sector of the S&P 500 includes companies involved in advertising, media, internet services, and telecommunications. Each of those segments operates in different parts of the internet ecosystem, with distinct roles and valuation profiles. Lumping them all together might obscure more than it reveals. 


The firms tracked as part of the S&P 500 “communications index include: 


  1. Alphabet Inc. Class A (GOOGL)

  2. Alphabet Inc. Class C (GOOG)

  3. AT&T Inc. (T)

  4. Charter Communications Inc. Class A (CHTR)

  5. Comcast Corporation Class A (CMCSA)

  6. DISH Network Corporation Class A (DISH)

  7. Meta (META)

  8. Netflix Inc. (NFLX)

  9. Omnicom Group Inc. (OMC)

  10. The Interpublic Group of Companies Inc. (IPG)

  11. Twitter Inc. (TWTR)

  12. Verizon Communications Inc. (VZ)

  13. Walt Disney Company (DIS)


I don’t know about you, but I evaluate asset-light advertising firms quite differently from capital-intensive connectivity firms, and media content owners different from both those other segments. Likewise, I would not consider Alphabet, Twitter and Meta in the same category as advertising, connectivity or content ownership firms. And even if other firms in the index have some streaming exposure, they are not pure-play streamers like Netflix. 


The point is that knowing how the firms in the index have performed financially does not really tell you much about how each of the sectors performed; what their growth rates are or how they should be valued relative to their “peers.” 


Charter, Comcast, Verizon, Dish and AT&T are in one valuation range. Alphabet, Meta, Twitter are in another range. Mobile firms recently have featured EBITDA multiples in the seven range. 


Advertising and marketing firms have had multiples in the 10.6 range. Cable TV companies have been valued at about 7.5 multiples. “Integrated telecommunications services: have a 6.8 multiple. “Online services” garner a multiple of 15.9. 


It does not necessarily illuminate our understanding that firms with such disparate multiples are considered to be in a single index. 


By some estimates, The average P/E ratio for U.S. telcos  was around 20 as of 2021.Online services provider average P/E ratio was around 50 in 2021. By other estimates the ratios were lower. 


Using TTM/GAAP metrics, Verizon’s early 2023 P/E ratio was about 7.7. Comcast in the same period had a 31 P/E while Charter had a 12 ratio. Netflix had a 35 P/E ratio. Alphabet and Meta had ratios close to 20. 


Omnicom had a ratio of about 14.4. Disney, meanwhile, traded at about 55 times earnings. Netflix traded at 34.7 times earnings. 


To be sure, ratios are affected by firm size, growth rates, firm efficiency, debt loads and investor sentiment. 


But you get the point: S&P assembles a single index including firms with wildly-different earnings or price ratios, producing an “average” performance index that might actually obscure more than it reveals.


"Communications" as Viewed by S&P Index Has Lost Meaning

Words have meaning, so changes in words also can have meaning. Consider the “communications” segment of the Standard and Poors 500 index.


The "communications" sector of the S&P 500 includes companies involved in advertising, media, internet services, and telecommunications. Each of those segments operates in different parts of the internet ecosystem, with distinct roles and valuation profiles. Lumping them all together might obscure more than it reveals. 


The firms tracked as part of the S&P 500 “communications index include: 


  1. Alphabet Inc. Class A (GOOGL)

  2. Alphabet Inc. Class C (GOOG)

  3. AT&T Inc. (T)

  4. Charter Communications Inc. Class A (CHTR)

  5. Comcast Corporation Class A (CMCSA)

  6. DISH Network Corporation Class A (DISH)

  7. Meta (META)

  8. Netflix Inc. (NFLX)

  9. Omnicom Group Inc. (OMC)

  10. The Interpublic Group of Companies Inc. (IPG)

  11. Twitter Inc. (TWTR)

  12. Verizon Communications Inc. (VZ)

  13. Walt Disney Company (DIS)


I don’t know about you, but I evaluate asset-light advertising firms quite differently from capital-intensive connectivity firms, and media content owners different from both those other segments. Likewise, I would not consider Alphabet, Twitter and Meta in the same category as advertising, connectivity or content ownership firms. And even if other firms in the index have some streaming exposure, they are not pure-play streamers like Netflix. 


The point is that knowing how the firms in the index have performed financially does not really tell you much about how each of the sectors performed; what their growth rates are or how they should be valued relative to their “peers.” 


Charter, Comcast, Verizon, Dish and AT&T are in one valuation range. Alphabet, Meta, Twitter are in another range. Mobile firms recently have featured EBITDA multiples in the seven range. 


Advertising and marketing firms have had multiples in the 10.6 range. Cable TV companies have been valued at about 7.5 multiples. “Integrated telecommunications services: have a 6.8 multiple. “Online services” garner a multiple of 15.9. 


It does not necessarily illuminate our understanding that firms with such disparate multiples are considered to be in a single index.


Which Came First: the Chicken or the Egg?

Technological determinism--the idea that technology shapes culture, society and history, independent of politics, economics, religion or other cultural forces--might mistakenly be applied in the connectivity and computing businesses. 


In other words, some might think we have the internet because of personal computers, because of Moore’s Law, because of TCP/IP, digital media, smartphones and tablets. One might think we have e-commerce, affordable video conferencing or social media because of broadband internet access, cloud computing or fiber to the home. 


That arguably gets it backwards, as we similarly contend that ubiquitous and high-quality broadband access creates economic growth. The causal relationship is likely the other way: wealth and high rates of economic growth create the demand for quality broadband access, use of smartphones, e-commerce and social media. 


Telco network architectures have undergone significant changes since 1970, looking at the basic switching function. But technology change does not seem to explain the revenue and business model shifts that have transformed the industry. Architecture, for example, does not explain the shift to mobile revenues and the decline of fixed network revenue.


In 2023, in most countries, mobile service represents 70 percent to 80 percent of total service provider revenues. At Verizon, for example, mobility represents no less than 55 percent of total revenues while consumer revenues drive 77 percent of revenue.  


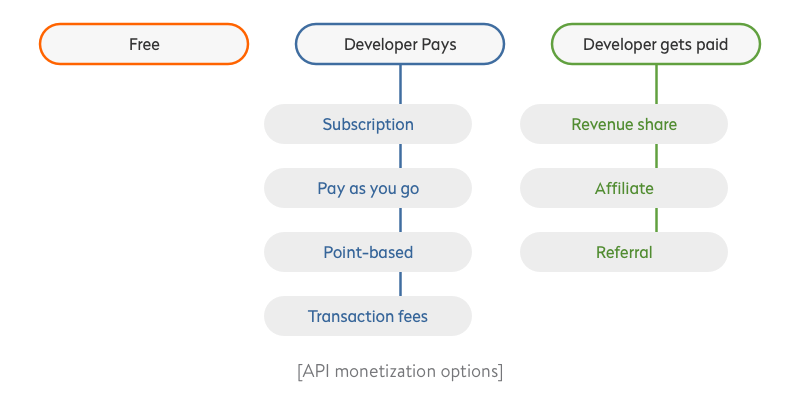
source: STL Partners 


Fixed network revenue as reported to the U.S. Federal Communications Commission and based on revenues contributing to the universal service fund. It is skewed downward because mobile service revenues do not contribute to USF at the same rate as do fixed network services. 


Instead, demand changes--accelerated by the introduction of competition; the value of mobility and the emergence of the internet--seem to explain the key business model changes. Architectural and physical media and switching evolutions seem less important drivers of business model change. 


In the 1970s, for example, telco revenues were dominated by voice services, with the bulk of profit coming from international and long distance calling by business customers.


That began to change a bit in the 1980s, as the conversion to digital switching and Signaling System 7 enabled touch tone dialing, call waiting, call forwarding and voice mail. Some incremental revenues also were generated by business customers using Integrated Services Digital Network. 


Business applications such as video conferencing, remote access, and digital phone systems generated new revenue based on use of ISDN. 


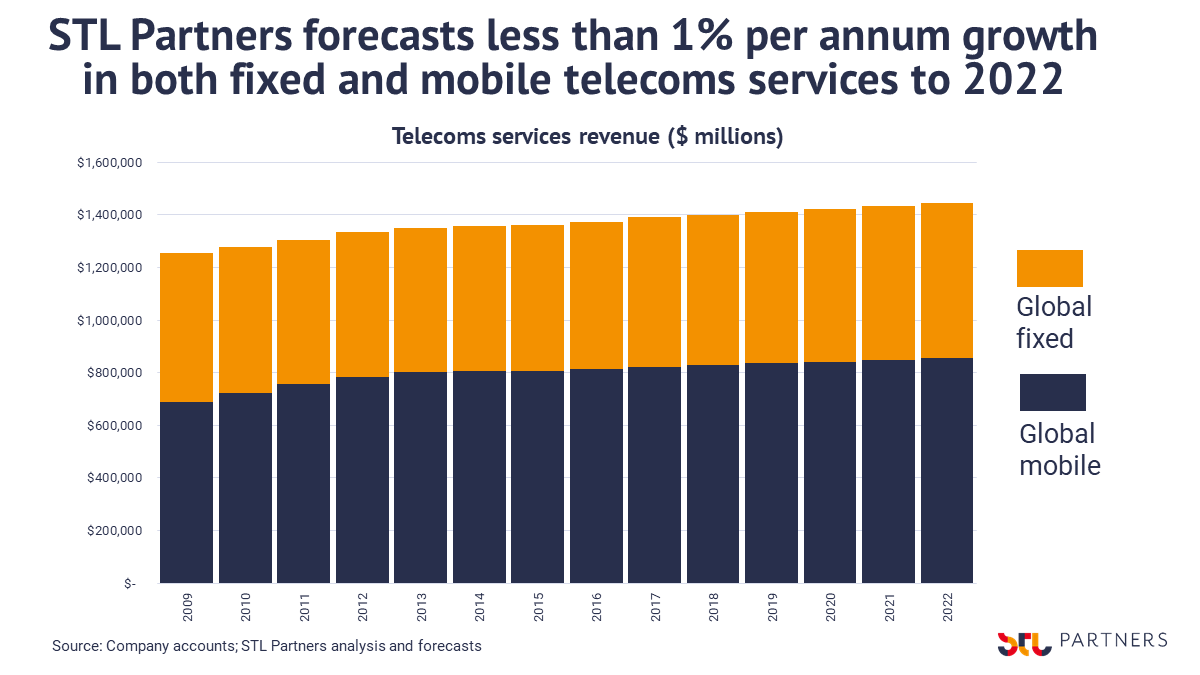
But the bigger change was the shift of revenue from fixed network services to mobile services in the later 1990s and 2000s. 


source: IDATE 


The emergence of demand for internet apps and services also displaced voice as the key driver of fixed network revenues. 


At least some connectivity providers also added significant revenues from entertainment video services. Cable TV companies always had done so, but added voice, then internet access and mobility services. 


Telcos added video to their menus of voice and internet access. By the second decade of the 2000s, mobility and broadband internet access had become the number-one and number-two biggest revenue sources for most access service providers. 


Demand changes explain more of the actual revenue shift in the access business since 1970 than the adoption of digital switching or optical fiber access media. 


Mobile services substantially displaced the fixed network as the preferred way people make phone calls and use messaging or social media. That, of course, requires use of new mobile networks, but the networks did not drive demand. Demand requires the networks. 


Likewise, one might argue that the emergence of the internet drives the demand for broadband access. It is worth noting that consumer demand drives both mobility and broadband access revenue. 


Historically, technology innovations or demand for “advanced” services came from business users. That was true for long-distance calling, ISDN and business phone systems, for example. 


That pattern held in the early days of mobility, but has reversed. Today, consumer users drive mobility revenue magnitudes. Also, internet access drivers were led, early on, by consumer demand. 


The point is that technology changes more often reflect demand changes than cause them. Demand changes, in turn, have been increasingly driven by new value consumers perceive in mobile phones and the internet, with declining value seen in fixed network voice services. 


Though one can document changes in network architectures, signaling methods or physical media changes, business model changes have happened for non-network reasons: competition, the value of the internet and mobility. 


Thursday, February 23, 2023

Home Broadband Should be Funded the Way Any Business Is

The debate over ffunding of home broadband networks by third parties essentially boils down to this argument by internet service providers: our customers use too much data and instead of charging them more, we will tax third parties to make up the difference. 


Some ISPs argue that half or more of the total data consumed by their own customers is because their customers are using a few popular hyperscaler apps. The demand, however, is created by ISP customers. 


If homeowners consume electricity, do we think to tax manufacturers of kitchen appliances or furnaces? Energy customers create the demand and cause the consumption.


Electrical suppliers have the right, perhaps the duty, to structure their tariffs in ways that promote responsible consumption. So do water suppliers or natural gas suppliers or home heating oil suppliers. 


Consumers, in turn, have the right (and again, perhaps a moral duty) to buy appliances that are more energy efficient. Manufacturers have similar pressures and opportunities. 


Governments, policymakers, public policy advocates and suppliers have the right to advocate for any number of funding mechanisms. That is why governments often offer financial inducements for building access networks, require physical facilities sharing and access or offer recurring cost subsidies to low-income consumers. 


Is it really asking too much of ISPs that they learn to structure their business models to support and shape their customers’ behavior?


Access Networks are Getting More Expensive

Like it or not, both mobile and fixed network operators are facing higher infrastructure costs. Fixed network operators must deploy optical fiber access networks. Mobile operators have to deploy dense small cell networks.


In each case, network architectures and investments are driven by physics: networks must support more bandwidth, which requires capacious physical media or small cells or both.


This is a good illustration of the reason why small cells are the future of mobile networks. It is just physics: the available radio frequencies we have added over time keep moving higher in the spectrum. Lower-frequency signals travel farther before they are attenuated.


Higher-frequency signals are attenuated quite quickly. The only available new spectrum we really can add is in the high-band areas. Those signals support lots of bandwidth, but will not travel very far, so cell sizes must necessarily be smaller. 

source: NTT, SKT 


And while small cells do not cost nearly what macrocells do (an order of magnitude less, at the very least), networks will need many more sites. The basics of cell geometry are that one quadruples the number of sites every time the cell radius shrinks by 50 percent. 


So shrinking from a 10-km radius to 50km radius requires four times as many cells. Shrinking again from 5 km to 2.5 km requires another quadrupling of sites, and so forth. By the time one moves to cell radii of 100 km or so, cell networks are quite dense. 


And optical fiber backhaul often is required to support such site. Ignoring the cost of many times more cells is the additional cost of fiber backhaul. 


So it should not be surprising that network cost is going up.


Competitors Worry About an End to EU Mandatory Wholesale Prices

European Union proposals to spur gigabit home broadband have gotten some opposition from non-dominant connectivity service providers, in large part because of feared changes in wholesale access rules viewed as boosting legacy provider revenues and raising those of new market entrants. 


That outcome is expected if the rules on mandatory wholesale pricing are removed or modified. 


To be sure, the proposed new rules would also focus on streamlining construction and permitting requirements, such as requiring publicly-owned physical infrastructure including ducts, poles and sewers to make access to those facilities available to service providers. 


When the Commission talks about the need to “incentivize network investments,” competitors are wary of new rules allowing wholesale rates to float free of mandatory prices. When the Commission talks about the need  to create“ economies of scale for operators” and a better climate for cross-border investment, that signals an intent to reduce facilities deployment cost that will help facilities providers the most. 


But it is the change in wholesale access pricing that will affect non-facilities-based competitors the most. 


In the U.S. market, for example, deregulation of the local access business entailed instituting generous wholesale discounts that incumbents were obligated to provide wholesale customers who wished to use their facilities. That created an immediate rush of service providers into the market able to buy end-to-end wholesale access at about a 30 percent discount, speeding market access but also eliminating the need to build facilities. 


When regulators decided to overturn those rules, and allow market-based pricing, the wholesale-based competitive industry promptly began to recede. Wholesale access still happens, but at market-based rates and generally for backhaul, trunking or service to support services for business customers.


AI Will Improve Productivity, But That is Not the Biggest Possible Change

Many would note that the internet impact on content media has been profound, boosting social and online media at the expense of linear form...