Sunday, December 10, 2023

LLMs are like GUIs

One might liken the emergence of generative artificial intelligence and large language models to the creation of the graphical user interface, the mouse and natural language interfaces. In other words, LLMs are to AI as GUIs, the mouse and natural language are to computing. 


From the command-line interfaces of early computers to the way we now speak or point to interact with computing devices, innovations such as LLM allow people to interact seamlessly and naturally with technology.


We sometimes take very much for granted the role “what you see is what you get” displays, touch interfaces, spoken input and output, icons, buttons and menus play when we are interacting with computing appliances. 


But there is an argument to be made that LLMs will have more impact than did GUIs
or the mouse, largely because LLMs use natural language and add conversational interaction in addition to a huge background of ingested knowledge. ------------------------------------


Feature

GUI

Mouse

NLI

Generative AI

Interface Type

Visual

Physical

Textual

Textual

Input Method

Clicking and dragging

Pointing and clicking

Text input

Text input

Output Method

Visual

Visual

Textual

Textual, multimedia

Accessibility

High

High

Moderate

Low (currently)

Learning Curve

Low

Low

Moderate

High

Flexibility

Moderate

High

High

Very high

Creativity

Low

Low

Low

Very high


Will AI Shake Up Advertising as the Internet Did?

Nobody yet knows whether artificial intelligence will mostly reinforce or disrupt advertising markets, much as nobody could have predicted huge shake ups in advance of Google or social media emerging. But it seems entirely possible that AI will assist some channels more than others in gaining or keeping their market share.


That already seems to be happening.


As use of third-party cookies dwindles, another shift in ad placement will follow, further boosting commitments to big retailers who possess actual first-party buyer data. And while internet app and content sites will continue to drive most of the spending, the biggest growth will be advertising on major retailer sites. 


By 2030, forecasters expect major retailers to be scooping up as much as 28 percent of all U.S. advertising spend. 


Channel/Venue

Estimated Spend (USD Billion)

Source

Internet Apps & Content Sites

520

Statista, eMarketer, Interactive Advertising Bureau (IAB)

Major Retailer Sites

290

Statista, eMarketer, Forrester

TV Broadcast Networks

35

Statista, Nielsen

Cable TV Networks

25

Statista, Nielsen

Out-of-Home Advertising

70

Statista, Out of Home Advertising Association of America (OAAA)

Radio & Podcast Advertising

30

Statista, IAB

Print Media

10

Statista, Pew Research Center

Other Channels

45

Industry reports, expert estimates


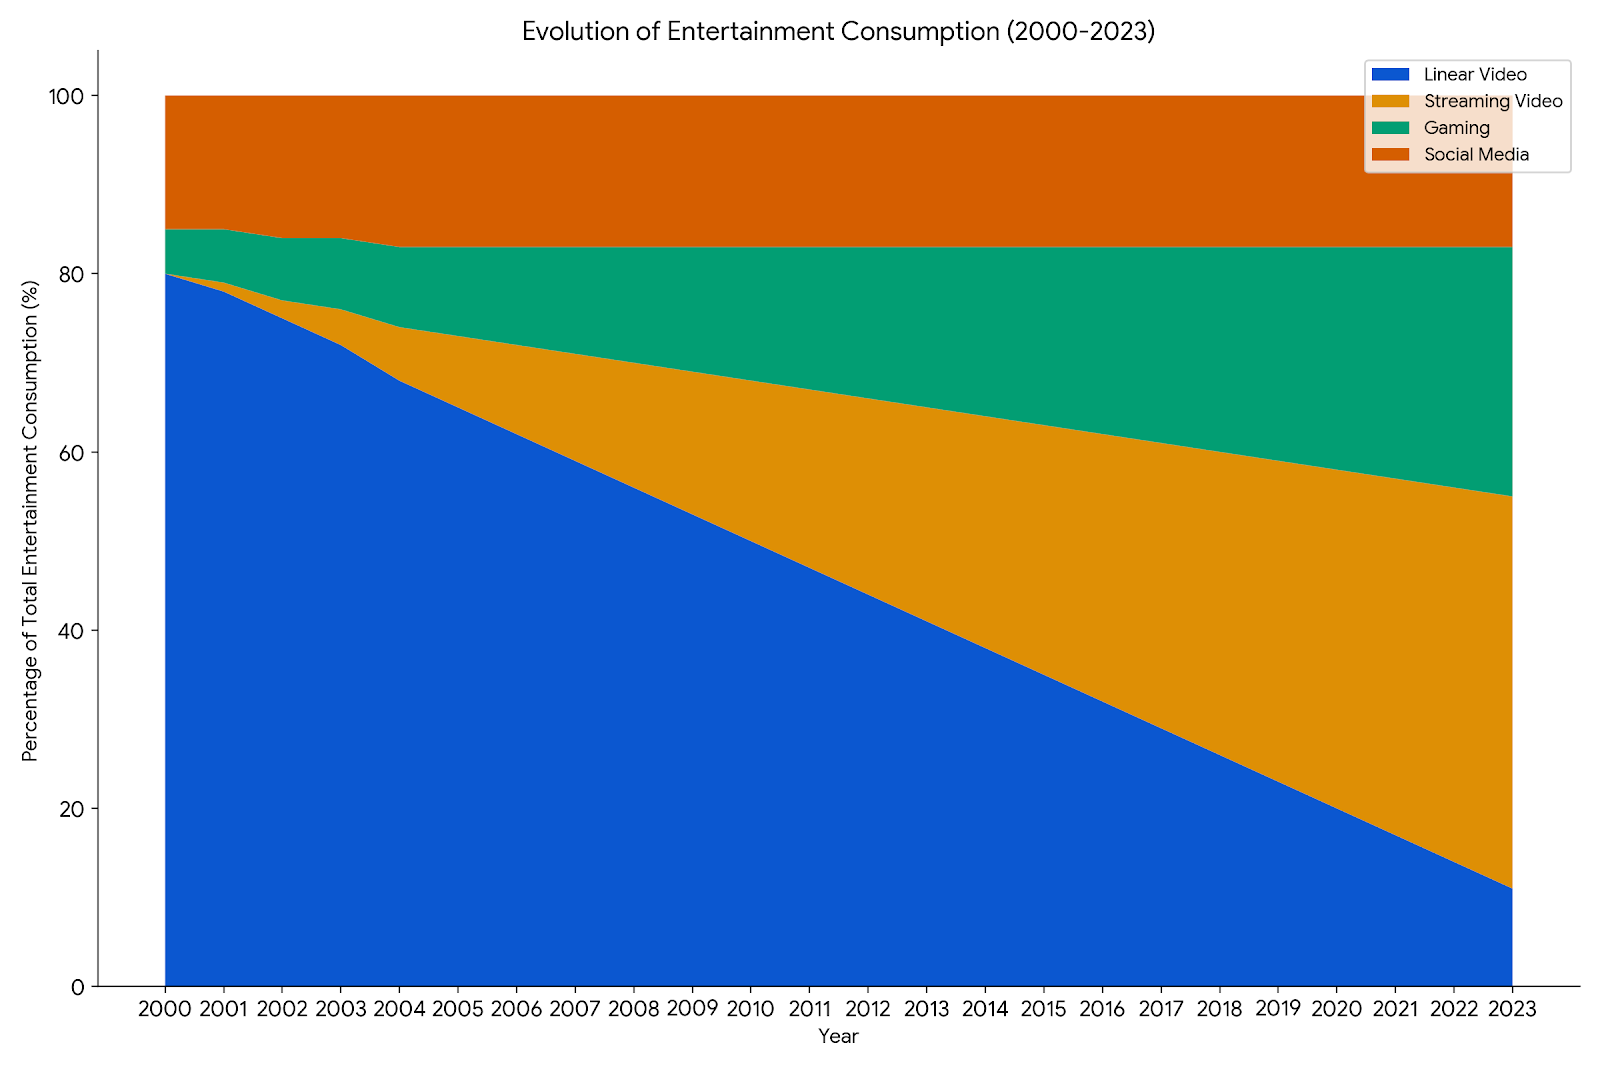
If one assumes ad revenue since 1995 was earned by different segments including print media, TV broadcasters, cable TV networks, cable TV operators, internet apps and content sites as well as major retailers, the general conclusions would be that print media commitments have shrunk, while revenues earned by the other (mostly electronic) segments have grown. 

Ad volume is dominated now by internet apps and content sites, as well as major retailer channels, which is a big change for advertisers accustomed to using formal media channels. In fact, for some of us, the growth of retailer channels is the biggest surprise. 


Media Channel

Annual Spending (USD Billion)

Percentage Share

Internet Apps & Content Sites

300

52.19%

Major Retailer Sites

120

21.04%

TV Broadcast Networks

49.2

8.55%

Cable TV Networks

32.5

5.65%

Out-of-Home Advertising

40

7.01%

Radio & Podcast Advertising

20

3.48%

Print Media

19.25

3.35%


Advertising at one time underpinned media business models. Today it underpins technology and retailer business models. By 2030, as much as 78 percent of advertising will be going to technology and major retailer firms, while media claims only about 16 percent, including outdoor media such as billboards and displays. 


All that assumes that artificial intelligence will only reinforce existing trends, and not disrupt them. In other words, if AI aids hyper-personalization, predictive targeting, dynamic content optimization or programmatic platforms, it might only reinforce existing trends. 


Likewise, voice interfaces, immersive venues or context awareness should only reinforce existing trends. 


Most observers likely see AI as driving more effectiveness for current methods (targeting, personalization, behavior-based inferences) than creating entirely new venues for placements. 


There is one major caveat. If AI somehow creates new venues, channels or platforms, we could be looking at vastly-different spending patterns in a couple of decades, much as the internet created alternative platforms and venues.


Friday, December 8, 2023

Linear Video Might be Dying, But it Still Throws Off Huge Profits, Compared to Steaming

Changing markets are very hard to track, as share in a t;raditionally-defined market often shifts to suppliers in “other” markets. Looking only at entertainment video, for example, one might see a “share pattern” that crosses industry boundaries. 


In this illustration, showing estimated time spent with video content, linear video is shown in blue, streaming video in orange, social media in green, gaming in orange. 


“Time spent” correlates with, but is not the same thing as “market share” measured by revenue. 


In the United States in 2023, for example, “video entertainment” still was led by traditional linear TV, but streaming services are displacing linear usage. Also, social media and gaming represent alternative uses of free time entertainment that arguably are substitutes and replacements for entertainment video consumption. 


Segment

Market Share (2023)

Traditional Linear Networks:

57%

New Suppliers (Streaming Platforms, On-Demand Content):

23%

Gaming:

10%

Social Media:

10%


Linear video arguably still “over indexes” as a revenue source, even if its consumption is down dramatically since 2000. 


Segment

Revenue (USD Billion)

Percentage

Traditional Linear TV:

68.8

28.4%

- Advertising:

49.2

20.3%

- Subscriptions:

19.6

8.1%

Streaming Services:

58.6

24.1%

- Subscriptions:

48.4

19.9%

- Advertising:

10.2

4.2%

Gaming:

56.2

23.2%

- Digital Games:

48.4

20.0%

- Hardware & Accessories:

7.8

3.2%

Social Media:

38.2

15.7%

- Advertising:

37.2

15.3%

- Other Revenue:

1.0

0.4%

Other Video Sources:

7.2

2.9%

Total:

241.0

100.0%


And, revenue is not the same as profit. 


Average profit margins for media companies typically range from 10- to 20 percent. Assuming a 15 percent margin on linear TV revenue of $68.8 billion, the profit would be approximately $10.32 billion.


Profit margins for streaming services vary significantly. Netflix, for example, had a profit margin of around 10 percent in 2022 while most services arguably were not yet profitable. Applying a conservative five-percent margin to streaming revenue of $58.6 billion would result in a profit of approximately $2.93 billion, all of it earned by Netflix, which in 2022 had around $5 billion in profits. In other words, except for Netflix, few, if any, streaming services were yet profitable in 2022. 


The average profit margin for video game companies is around 20 percent. If gaming revenue is $56.2 billion translates to a profit of approximately $11.24 billion.


Meta reported profit around 15 percent in 2022. Assuming a similar margin on social media video revenue of $38.2 billion, the profit would be approximately $5.73 billion.


So gaming and linear video generate 71 percent of all profits of the actual profit, with social media and video streaming contributing the balance.           


Will Video Content Industry Survive AI?

Virtually nobody in business ever wants to say that an industry or firm transition from an older business model to a newer model is doomed t...