Tuesday, March 19, 2024

Connectivity Service Provider Revenue Growth to 2025 is About What You'd Expect

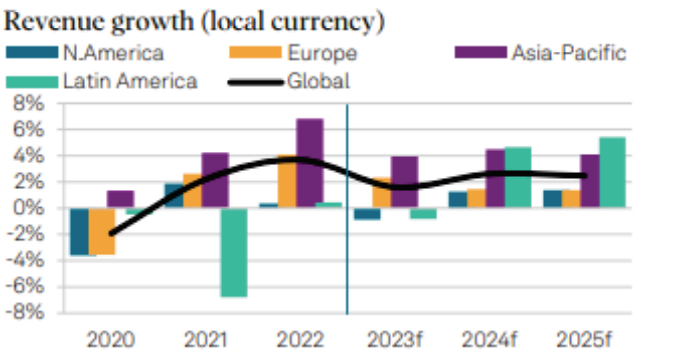
Connectivity provider revenue growth between 2024 and 2025 should be about as most would expect, with a global average of about three percent per year, with slower growth possibly in the one-percent range in North America and Europe, with higher growth in the four percent to 4.5 percent range in Asia-Pacific and Latin America, according to S&P Global Ratings.


source: S&P Global Ratings 


To be sure, executives might wish for faster growth rates, but growth rates in mature markets, especially in industries with “utility-type” characteristics, often are slow. 


Industry

Growth Rate (%)

Source

Telecom

3.2%

Deloitte

Passenger Airlines

7.4%

IATA

Seaborne Goods Transport

3.1%

World Maritime News

Retailing

4.1%

Statista

Retail Consumer Banking

2.7%

PwC

Electricity

4.8%

IEA

Natural Gas

2.1%

IEA

Wastewater Services

3.4%

Global Water Intelligence


Though growth rates in various utility-style industries vary over time, none of these industries are early in their adoption curves, when growth is much faster.

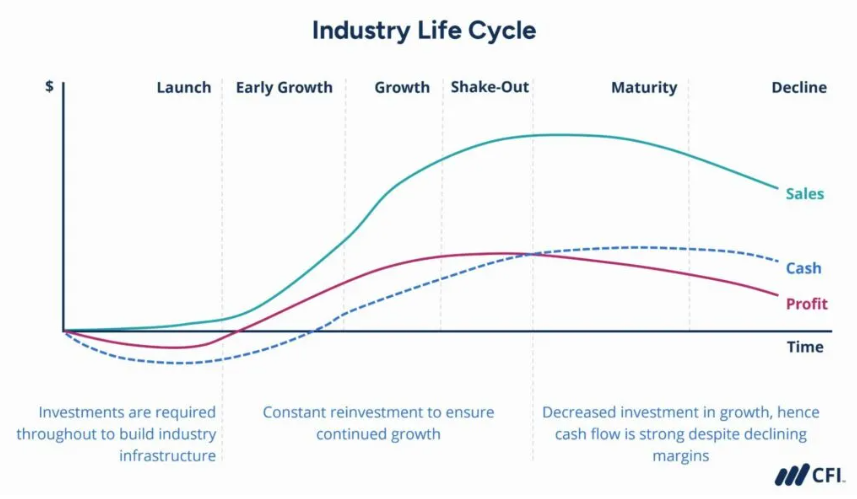
source: Corporate Finance Institute 


As the ILC applies to the connectivity service provider industry, while generally mature, segments within the industry that might be likened to “products” can be at different phases of their life cycles. 


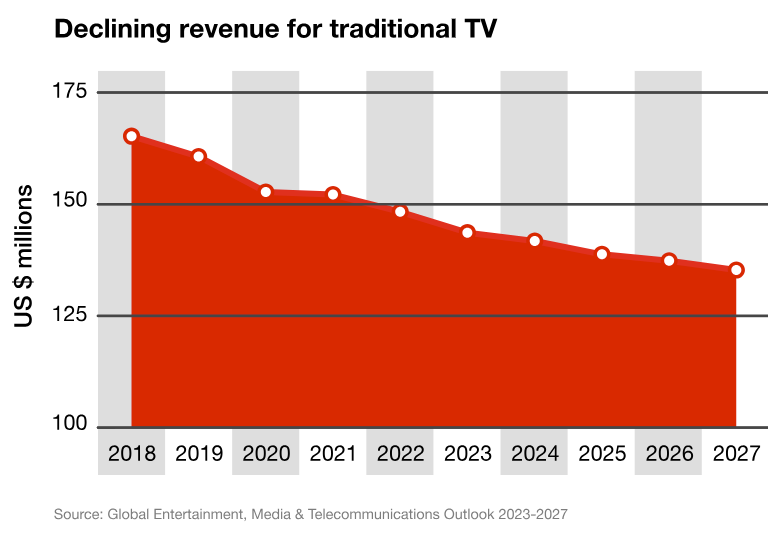
The fixed network voice portion of the industry clearly is declining; the home broadband segment growing. The mobile industry routinely introduced a new generation of mobile services every decade, while sunsetting the older legacy generations as that happens. 


Within the mobile industry, growth is fastest in Asia-Pacific and Latin America; slowest in Europe. 


Industry

2000-2005

2005-2010

2010-2015

2015-2020

2020-2023

Source

Telecom

6.5

4.1

2.8

2.3

3.2

Statista

Electricity

3.8

4.2

3.6

2.4

4.8

IEA

Railroad

4.2

5.1

3.8

2.1

2.7

Statista

Aviation

5.8

5.3

4.2

4.6

7.4

IATA


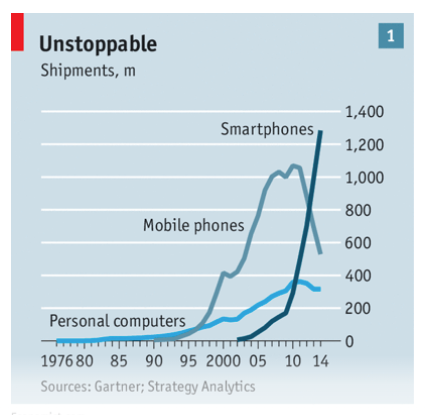
If one looks at computing devices, “personal computing” clearly has moved through a personal computer stage to a mobile phone stage to a smartphone stage. 

The Economist


At a high level, only fixed network voice is clearly in its “decline” phase. Mobile service is expected to continue replacing its lead platform every decade.


Service

Product Life Cycle Stage

Trends

Fixed Network Telecom Service (e.g., Landlines)

Decline

Facing declining use due to substitution by mobile services and internet communication options (e.g., VoIP).  Limited market growth potential.

Mobile Service

Maturity

Widespread adoption and high market penetration.  Focus on differentiation through network coverage, data plans, and value-added services.  Potential for continued growth in emerging markets.

Home Broadband

Maturity/Growth

High market penetration, particularly in developed economies.  Growth potential in developing economies and through offering higher speeds and bundled services.  

Virtual Private Networks (VPNs)

Maturity

Established technology with widespread adoption by businesses.  Potential growth in emerging markets and with increasing security concerns.

Managed Security Services

Growth

Growing demand for cybersecurity expertise and protection against evolving threats.

Data Center Services

Growth

Rising demand for cloud computing and data storage solutions.  Shift from on-premise infrastructure to cloud-based solutions.

Sunday, March 17, 2024

"Tokens" are the New "FLOPS," "MIPS" or "Gbps"

Modern computing has some virtually-universal reference metrics. For Gemini 1.5 and other large language models, tokens are a basic measure of capability. 


In the context of LLMs, a token is the basic unit of text (for example) that the model processes and generates, usually measured in “tokens per second.”


For a text-based model, tokens can include individual words; subwords (prefixes, suffixes or  characters) or special characters such as punctuation marks or spaces. 


For a multimodal LLM, where images and audio and video have to be processed, content is typically divided into smaller units like patches or regions, which are then processed by the LLM. Each patch or region can be considered a token.


Audio can be segmented into short time frames or frequency bands, with each segment serving as a token. Videos can be tokenized by dividing them into frames or sequences of frames, with each frame or sequence acting as a token.


Tokens are not the only metrics used by large- and small-language models, but tokens are among the few that are relatively easy to quantify. 


Metric

LLM

SLM

Tokens per second

Important for measuring processing speed

Might be less relevant for real-time applications

Perplexity

Indicates ability to predict next word

Less emphasized due to simpler architecture

Accuracy

Task-specific, measures correctness of outputs

Crucial for specific tasks like sentiment analysis

Fluency and Coherence

Essential for generating human-readable text

Still relevant, but might be less complex

Factual correctness

Important to avoid misinformation

Less emphasized due to potentially smaller training data

Diversity

Encourages creativity and avoids repetitive outputs

Might be less crucial depending on the application

Bias and fairness

Critical to address potential biases in outputs

Less emphasized due to simpler models and training data

Efficiency

Resource consumption and processing time are important

Especially crucial for real-time applications on resource-constrained devices

LLMs rely on various techniques to quantify their performance on attributes other than token processing rate. 


Perplexity is measured by calculating the inverse probability of the generated text sequence. Lower perplexity indicates better performance as it signifies the model's ability to accurately predict the next word in the sequence.


Accuracy might compare the LLM-generated output with a reference answer. That might include precision (percent of correct predictions); recall (proportion of actual correct answers identified by the model) or F1-score that combines precision and recall into a single metric.


Fluency and coherence is substantially a matter of human review for readability, grammatical correctness, and logical flow. 


But automated metrics such as BLEU score (compares the generated text with reference sentences, considering n-gram overlap); ROUGE score (similar to BLEU but focuses on recall of n-grams from reference summaries) or Meteor (considers synonyms and paraphrases alongside n-gram overlap). 


So get used to hearing about token rates, just as we hear about FLOPS, MIPS, Gbps, clock rates or bit error rates.


  • FLOPS (Floating-point operations per second): Measures the number of floating-point operations a processor can perform in one second.

  • MIPS (Millions of instructions per second): Similar to IPS, but expressed in millions.

  • Bits per second (bps): megabits per second (Mbps), and gigabits per second (Gbps).

  • Bit error rate (BER): Measures the percentage of bits that are transmitted incorrectly.


Token rates are likely to remain a relatively easy-to-understand measure of model performance, compared to the others, much as clock speed (cycles the processor can execute per second) often is the simplest way to describe a processor’s performance, even when there are other metrics. 


Other metrics, such as the number of cores and threads; cache size; instructions per second (IPS) or floating-point operations per second also are relevant, but unlikely to be as relatable, for normal consumers, as token rates.


Thursday, March 14, 2024

AI Productivity Gains Might be Hard to Measure

Proponents of applied artificial intelligence generally tout the productivity advantages AI will bring, and with reason. But productivity impact, assuming you believe we can measure it, if the result of many influences. 


The U.S. Bureau of Labor Statistics uses a measure called “Multifaceted Productivity.” It  includes information technology investment, but also advancements in business practices, workforce skills, and other capital investment.


Since 2000, IT investment growth has exceeded MFP growth. 


Year

MFP Growth (%)

IT Investment Growth (%)

2000

2.4

10.2

2005

1.3

7.8

2010

0.8

5.1

2015

0.6

3.4

2020

1.4

4.2

source: Bureau of Labor Statistics


The point is that AI contributions will be hard to identify, in terms of productivity gains.


Wednesday, March 13, 2024

For Most Firms, Sustainable AI Advantage Will Prove Illusory

Most of you are familiar with the concept of “first movers” in new markets. Many of you also are familiar with the notion of “sustainable competitive advantage” (“business moats protecting firms from competition). 


The long-term ability to sustain competitive advantage tends not to be so easy, as any new technology innovation--including artificial intelligence--propagates and becomes mainstream. 


Similar to past innovations like electricity, PCs, and the internet, early adopters arguably had an edge. 

Over time, as the technologies  became widely available and mainstream, the advantage was diminished or largely lost.


But perhaps not completely lost. Consider data centers with access to lots of low-cost electricity. In such cases, competitive advantage might still remain, even for a “commodity” such as power. 


The same might be noted for some manufacturers of products such as aluminum, which is highly energy-intensive as well. 


In similar ways, some firms in some industries might retain competitive advantages in use of computing hardware and software, even if use of computing software and platforms is virtually ubiquitous across all industries. 


High-performance computing, semiconductor design and manufacturing, software as a service and cybersecurity might provide relevant examples. 


The point is that competitive advantage for adopters of artificial intelligence will likely exist for early successful adopters. Over time, the magnitude of advantage, in most cases, will shrink, though still providing some amount of sustainable advantage in some industries, for some firms. 


A few firms in search and social media provide obvious examples. 


Still, most firms will eventually be using AI as a routine part of their businesses, even if, in many cases, such use will not produce sustainable competitive advantage, compared to their key competitors. 


New technologies offering business value will be quickly adopted and improved upon by competitors.


As technology becomes more widespread, it will become standardized, leading to price competition and eroding first-mover initial advantages.


Once the core technology becomes ubiquitous, competition will logically intensify in complementary areas such as service offerings, user experience, and business models. 


So unusual advantage tends to be eroded over time. Still, some firms will likely be able to gain a period of advantage by deploying AI more effectively than competitors, until everyone catches up.


Will Video Content Industry Survive AI?

Virtually nobody in business ever wants to say that an industry or firm transition from an older business model to a newer model is doomed t...