Monday, May 10, 2021

Service Provider Revenue Flat, Overall, During 2020

Global telecommunications service provider revenues totaled $1.53 trillion in 2020, representing flat year-over-year growth, according to the International Data Corporation. Asia/Pacific service provider revenue was flat, while revenue grew in the Americas region and declined in Europe and the Middle East region. 


IDC expects worldwide spending to increase by 0.7 percent in 2021 reaching a total of $1.54 trillion. 


IDC had predicted in May 2020 that Covid would wind up having little impact on service provider revenues. In past recessions, even severe recessions, though telecom service provider revenues have dipped a bit,  revenues tend to hold up better than for many other industries. Revenue also tends to bounce back quickly once a recovery begins.


Many will note the big jump in data usage during the pandemic. But usage and revenue do not correlate in a highly-linear fashion. In fact, many service providers essentially switched to “no extra charges” during the pandemic, which broke the possible connection between higher usage and higher revenue. 


Global Regional Services Revenue and Growth (revenues in $B)

Global Region

2020 Revenue

2019 Revenue

20/19 Growth

Americas

$583

$579

0.7%

Asia/Pacific

$482

$482

0.0%

EMEA

$467

$471

-0.8%

WW Total

$1,532

$1,532

0.0%

source: IDC 


Segment trends varied.  Consumer fixed network data services arguably got a boost as workers were forced to stay home and students were kept out of school.


Aggregate business fixed data demand likely was stable in the enterprise segment, but it seems almost inevitable that small business bankruptcies will reduce demand from the small business segment. Enterprise locations likely saw a fall in usage, but multi-year contracts likely preserved revenue generation. 


Fixed voice demand has been falling for a couple of decades and it is unlikely Covid-related changes in demand will change the direction or magnitude of demand. 


Mobile services spending declined slightly, partly because marketing suffered from retail store closing; in part because consumer lockdowns meant less need for out of home communications; and partly because roaming revenues fell. With workers and students at home, more data demand likely was shifted to Wi-Fi, and off the mobile networks. 


The more important long-term observation is that global revenue growth now is quite flat.


source: IDC


Black Swans in Action

The Covid pandemic was a vivid reminder to all of us who create models, build scenarios or make predictions that we are unable to accurately account for all possible influences and outcomes. By definition, we are unable to account for highly-improbable, very rare events that have high effect on whatever it is that we are modeling. 


The pandemic also was a reminder of how difficult it is to create organizations that respond better to unexpected stresses. One tactic for reducing fragility is to possess more cash. That is akin to reducing reliance on "just in time" supply chains, which, as the pandemic showed, increases risk and fragility.


Many businesses and non-profits assume there will be times when revenues slow or increase. Cash reserves or contingency funds are one way to create "antifragile" capabilities. But I know of no organization that prepared for a sudden and complete shutdown of all operations--and a virtual ban on customers buying--extending for months to nearly a year.


Though for many of us the Covid pandemic is the biggest black swan event we have ever seen. A black swan event is unpredictable and unprecedented in scale and retroactively explainable, according to Nassim Taleb


Nassim actually states the case more dramatically: "nothing in the past can convincingly point to its possibility.” By that standard, some argue Covid is not a black swan; perhaps neither is the Great Recession of 2008; nor the emergence of the internet. We have seen major pandemics in human history. We have experienced severe global recessions and seen the impact of computer technology on human life. 


Perhaps the definition does not matter much. After all, Talib’s whole point is resilience; the ability to create organizational ability to adapt to low-probability and high-consequence events. Whether one believes Covid, for example, is a black swan or not, what might we have done to prepare for it. More to the point, what should we be doing to prepare for some unknown future black swan?


Retroactively, we can put into place mechanisms to deal with pandemics. But we cannot spend unlimited amounts of resources doing so. Nor, as a practical matter, can we easily design better systems to account for threats we cannot presently imagine. Yet that is what Taleb counsels. He calls such resilience “antifragile.”


Exercise is one antifragile practice, he argues. Perhaps cash in the bank also is an antifragility measure. Some might say this is  “resilience.” Taleb rejects that notion. Antifragility as Taleb views it is a property of systems that get stronger in the face of stressors, shocks, volatility, noise, mistakes, faults, attacks, or failures. 


“Antifragility is beyond resilience or robustness,” he argues. “The resilient resists shocks and stays the same; the antifragile gets better.” Antifragility is the ability to demonstrate a non-linear response to events. 


“You have to avoid debt because debt makes the system more fragile,” he says. “You have to increase redundancies in some spaces. You have to avoid optimization.” In a real sense, Taleb says antifragility is enhanced by being deliberately less specialized and less structured. 


The concept was developed by Nassim Nicholas Taleb in his book, Antifragile, and in technical papers.[1][2] As Taleb explains in his book, antifragility is fundamentally different from the concepts of resiliency (i.e. the ability to recover from failure) and robustness (that is, the ability to resist failure).  


Others might say it is disaster preparedness.   


One might well argue that there is a normal human resistance to spending too much time, effort or money on preparing for unpredictable; low-probability events with massive impact. By definition, we cannot foresee the sort of event we are preparing for. 


No forecaster, therefore, can predict or model the impact of a black swan event: it is, by definition, unpredictable. 


 We simply assume that present trends will continue, within some zone of variation. 


A positive black swan might be the internet; a prior negative black swan was the global Great Recession of 2008. We can all agree that one essential element of a black swan event is that it has a sudden and unexpected magnitude outside our models. 
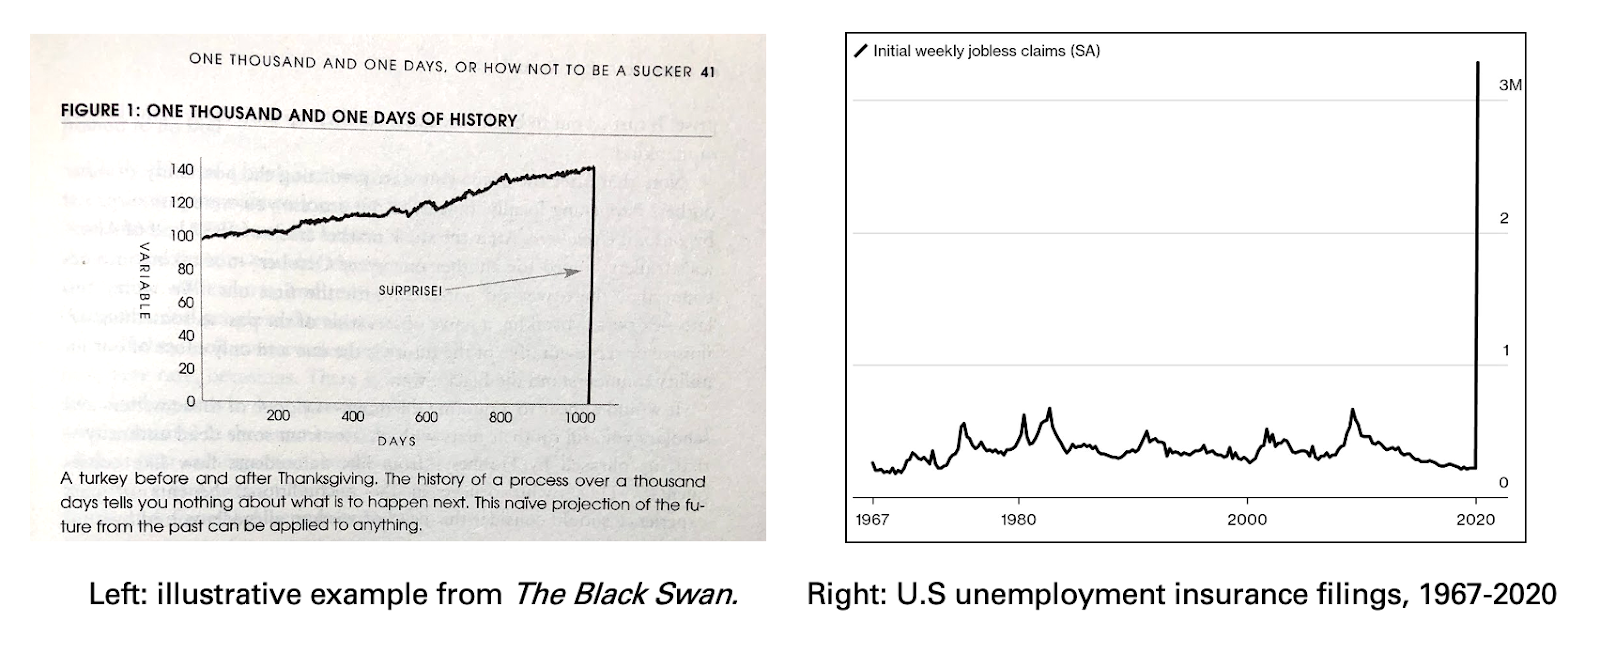
source: Alex Danco 


The main idea is that black swan events are extremely unpredictable and have massive impacts on society. 


A corollary might be that black swan events are “preemptively ruled out” in human mental models or forecaster predictions.


“For an event to really be a Black Swan event, it has to play out in a domain that we thought we understood fluently, and thought we knew the edge cases and boundary conditions for possible realm,” argues Alex Danco. 


Immediate "economic curtailment worse than the Great Recession of 2008" was outside the thinking of anybody I have encountered.


Sunday, May 9, 2021

Zero-Sum Games in Mature Markets

Mature connectivity services markets are very nearly zero-sum games. What one contestant gains is almost directly offset by losses incurred by some rival. Until recently, suppliers could count on rapid account and usage growth in core markets in much of the developing world. 


At some point, with slowing growth rates, growth strategies must switch from gaining new accounts to selling additional products for the same accounts, expanding out of region or taking market share from other contestants. 


One revenue component distinguishes mobile from fixed network revenue streams in the U.S. market: video entertainment. In 2017, voice communications was 11.8 percent of fixed segment industry revenues. Internet access services contributed 28 percent. Video entertainment  revenues represented 27 percent.


That same year, video entertainment represented zero percent of mobile segment revenues. 

Bureau of Labor Statistics 


Note also that 33 percent of fixed network segment  revenues consisted of private network services, customer premises equipment, internet telephony and all other services.


U.S. Telecom Revenue 2017, $ Billions

Industry

Telephony, all distances

Internet access

Television

Other services

Wired

37.3

88.7

85.5

104.9

Wireless

86.3

96.1

0

75.1

Source: U.S. Census Bureau


In the mobility segment, telephony represented 33.5 percent of revenues. Internet access accounted for another 37 percent of segment revenue. Other revenue sources contributed 29 percent, perhaps largely fueled by phone sales. 


The bigger problem for service providers is the collapse of revenue per consumer account. Between 2003 and 2013 alone, ARPA declined 69 percent, according to Rob Van Den Dam, 

IBM Institute for Business Value global telecommunications industry leader.

source: IBM 


Other studies confirm the trend of lower average revenue per user. Of course, lower revenue per account is equally important, which is what the IBM figures likely point to. 

source: GreyB 


But slow revenue growth in most global markets is another key issue, compounded in many markets by saturated customer upside. At some point, every prospect who wants to buy and use services has done so. 


Battles for market share then are characteristic of mature markets. 


Friday, May 7, 2021

Is "Digital Transformation" Really About "New Revenue Sources?"

 One issue perhaps many of us have is the fuzziness of the term “digital transformation.” It is never clear what precisely that means. One definition used by the Economist Intelligence Unit is that DX “is the process of using digital technologies to support capabilities to create new business models.”


Some might note that this still is rather vague, as a “business model” includes everything required to “make a profit.” That includes the value proposition, products, infrastructure, customers, competitors, marketing and distribution. In other words, the business model is more than the revenue model. The business model includes all the other elements and decisions required to identify a customer need and fill it. 


source: Harvard Business Review


Unfortunately, DX therefore includes all applications of technology to any part of the business model, which might be useful in some ways, but frustratingly imprecise in other ways. And emphasis can shift very quickly, that being the case.


According to the EIU, prior to the Covid pandemic, enterprise priorities focused on applied technology to improve efficiency, among other objectives. During the pandemic, emphasis shifted to supporting remote work. Post pandemic, cloud computing is seen as the top priority, among others. 


source: Economist Information Unit 


Digital transformation is the stated rationale for almost any applied technology these days. It helps modestly to refine the definition to emphasize “new business models.” We might operationalize that further by arguing DX is about “new revenue models.”


How Far will Virtualization Go?

It is no secret that profit margin pressures and little revenue growth in the telecom business have forced operators to reduce costs, turning to open source, outsourcing, leasing instead of owning infrastructure, headcount reductions and more reliance on online sales.  

source: Innosight


Some might go further and suggest that there are going to be fewer tier-one operators in the future, as additional scale and continual margin pressure will force smaller operators to sell themselves. 


Some also suggest that, in many countries, the experiment with connectivity provider competition could fail, leading regulators back to monopoly frameworks for connectivity services. 


The emergence of the internet and choice of internet protocol (TCP/IP) as the telco next generation network platform also has led to wide scale virtualization. Apps are now separated from access; network ownership from service ownership; computing devices from app operation. 


In fact, core network virtualization is a requirement for full standards-based 5G. In recent days telcos have begun to move in the direction of sourcing computing support from the hyperscale computing as a service suppliers. 


Sales of tower assets have been going on for years, telcos concluding there are other places to deploy capital. Some suggest wholesale sourcing of active radio elements will be next on the agenda. 


There are at least two strategic lines of thought conceivable here. The first is that virtualizing and outsourcing are simply the latest versions of the “build versus buy” decisions all firms make. The second is that competitive dynamics and participant roles could shift.


The former interpretation has few strategic consequences: firms simply spend their capital and operational budgets differently, while shifting employee responsibilities. The latter possibility could see tower asset owners emerging as wholesale suppliers to much of the industry.


If so, the additional possibility could arise of potential future emergence in retail roles as well. Few wholesale business models in telecom ever remain completely that way. Over time, some creep into retail tends to happen. 


To be sure, channel conflict is a real barrier to such migration. As the saying goes, “do not compete with your customers.” 


Still, unless huge new revenue sources are discovered, declining profit margins and flat revenue growth will eventually force more margin-supporting actions. Virtualization, consolidation and retrenchment are among the logical business choices for consumer-facing and business-customer-facing telcos.


Wednesday, May 5, 2021

Terabits Per Second by 2050?

Broadband deployment is more a process than an end state, more a picture of a river than a finished product. 


Even if 77 percent of Americans now have access to a low-priced wired broadband plan, compared to just 50 percent one year ago, that can change in an instant when we change the definitions, and we do that.


A “low-priced broadband plan” is defined as a service that costs $60 per month or less (excluding promotional pricing), and has minimum speeds of 25 Mbps download with 3 Mbps upload.


As always, top speeds are another matter. While few consumers buy the budget tier of service, relatively few buy the fastest available tier, either. About 31 percent of U.S. residents have access to a low-priced plan that supports 100 Mbps download with 25 Mbps upload. 


About half of all U.S. customers buy services operating between 100 Mbps and 200 Mbps. In the United Kingdom  , about half of customers buy services operating between 30 Mbps and 100 Mbps. 


Back before the internet existed, “broadband” was defined as any data rate faster than 1.544 Mbps. So a T-1 line was broadband. My first internet access service faster than dial-up was a 756 kbps service costing something like $300 a month. 


Fiber to the home systems of the mid-1990s supported speeds of 10 Mbps. These days definitions vary. But the definitions will change; they always do.  

source: BroadbandNow 


In 2050, access speeds should be in the terabit per second range.  How fast will the headline speed be in most countries by 2050? Terabits per second is the logical conclusion, even if the present pace of speed increases is not sustained. Though the average or typical consumer does not buy the “fastest possible” tier of service, the steady growth of headline tier speed since the time of dial-up access is quite linear. 


And the growth trend--50 percent per year speed increases--known as Nielsen’s Law--has operated since the days of dial-up internet access. Even if the “typical” consumer buys speeds an order of magnitude less than the headline speed, that still suggests the typical consumer--at a time when the fastest-possible speed is 100 Gbps to 1,000 Gbps--still will be buying service operating at speeds not less than 1 Gbps to 10 Gbps. 


Though typical internet access speeds in Europe and other regions at the moment are not yet routinely in the 300-Mbps range, gigabit per second speeds eventually will be the norm, globally, as crazy as that might seem, by perhaps 2050. 


The reason is simply that the historical growth of retail internet bandwidth suggests that will happen. Over any decade period, internet speeds have grown 57 times. Since 2050 is three decades off, headline speeds of tens to hundreds of terabits per second are easy to predict. 

source: FuturistSpeaker 


Some will argue that Nielsen’s Law cannot continue indefinitely, as most would agree Moore’s Law cannot continue unchanged, either. Even with some significant tapering of the rate of progress, the point is that headline speeds in the hundreds of gigabits per second still are feasible by 2050. And if the typical buyer still prefers services an order of magnitude less fast, that still indicates typical speeds of 10 Gbps 30 Gbps or so. 


Speeds of a gigabit per second might be the “economy” tier as early as 2030, when headline speed might be 100 Gbps and the typical consumer buys a 10-Gbps service. 


source: Nielsen Norman Group 


Tuesday, May 4, 2021

Europe-East Asia Traffic Demand is Different from Other Routes

Europe-East Asia capacity has been growing sharply since about 2018, according to TeleGeography. But there is a significant difference. On intra-Asia, trans-Pacific and trans-Atlantic routes, content drives demand. Not so on the Europe-East Asia routes, where internet capacity supplied by the major internet backbones drives traffic. 


source: TeleGeography 


source: TeleGeography


Directv-Dish Merger Fails

Directv’’s termination of its deal to merge with EchoStar, apparently because EchoStar bondholders did not approve, means EchoStar continue...