Asset valuation in the digital infrastructure space gets more complicated as firms start to embrace functions across two or more ecosystem roles.
Even within a single category, valuation often requires understanding which "type" of asset is involved.
Infrastructure investors sometimes debate whether “core plus” is a “real” category, but there is no doubt new asset classes that might once have been considered “core plus” now are either “core” assets or, in some cases, “supercore.” The original categories come from the real estate business, and now also are the framework for infrastructure investing generally.
Those who use the “supercore” appellation essentially move “core” assets to the “supercore” category, while the former “core plus” becomes core. The value-add category then becomes “core plus.” Some add an additional “opportunistic” category including assets in emerging markets and assets whose primary value is asset appreciation rather than operating income.

source: Mercer
“Supercore” has in the past referred to assets with regulated prices and rates of return, such as electrical utilities. “Core” assets might be considered those with business moats, pricing power and predictable demand. Toll roads, railroads, energy distribution companies. airports or mobile network towers provide examples.
Generally speaking, supercore assets are perceived as having the lowest risk, core-plus as having higher risk, greater variability but also higher growth rates or profit margins.
Key valuation metrics arguably also vary between the asset classes.
Supercore assets--the most predictable assets, with the highest business moats--often rely on earnings (EBITDA) and pierce-earnings multiples.
Core-plus assets often require injections of new capital, so often rely on internal rate of return metrics. Optical fiber networks often are in this category.
Core assets might more often be evaluated using net operating income or discounted cash flow analyses. These are considered mature and stable categories. Mobile towers and data centers often are in this category.
------------------
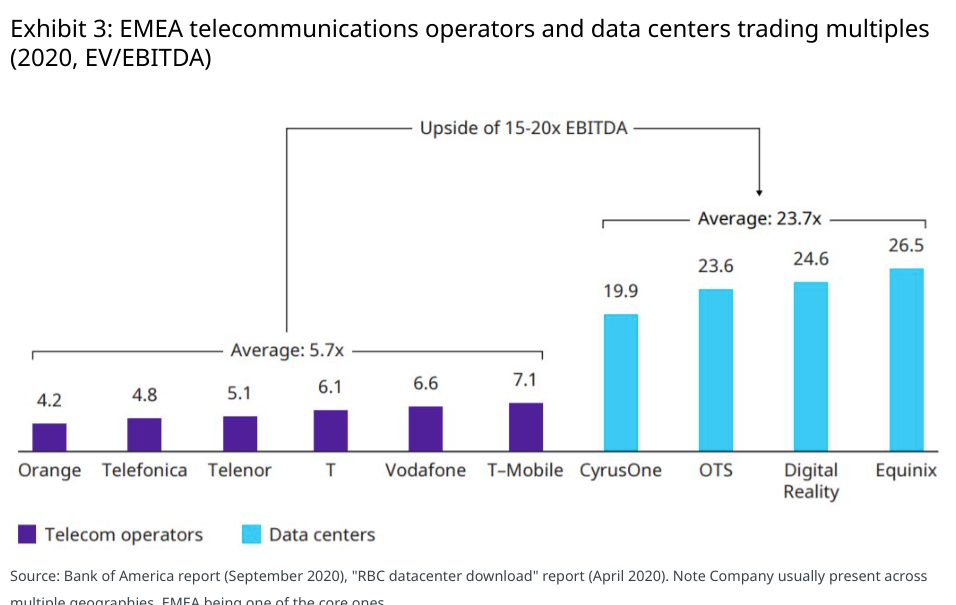
Virtually all observers would agree that valuation multiples for assets such as data centers are different from valuations of connectivity providers, and that valuations for other assets also will differ from either of those types of assets.

sources: Oliver Wyman, Bank of America
Industrial technology, which includes industrial process control, industrial software, vision technology, robots and motion sensing, can feature EV/EBITDA multiples somewhere between “connectivity providers” and data centers.


source: Capitalmind

source: Adventis Advisors
To be sure, valuation multiples change over time, and already seems to be true in 2023 for public software companies.

source: Microcap.co
Multiple compression from the robust financial markets of 2020 is obvious in every vertical category.
GICS Sector | 12/31/2022 | 6/30/2022 | 12/31/2021 | 6/30/2021 | 12/31/2020 |
Communications | 8.57 | 9.27 | 12.96 | 14.78 | 14.14 |
Consumer Discretionary | 14.44 | 14.98 | 21.88 | 23.02 | 26.09 |
Consumer Staples | 16.42 | 14.92 | 17.53 | 16.53 | 16.92 |
Energy | 5.37 | 6.98 | 8.97 | 22.52 | - |
Health Care | 16.24 | 14.93 | 18.18 | 19.73 | 17.36 |
Industrials | 15.06 | 13.89 | 17.62 | 25.12 | 20.61 |
Information Technology | 15.96 | 15.91 | 23.45 | 22.87 | 22.65 |
Materials | 9.14 | 9.05 | 11.91 | 15.25 | 18.18 |
Real Estate | 16.61 | 17.83 | 24.48 | 25.27 | 21.30 |
Utilities | 13.75 | 14.35 | 14.23 | 13.59 | 13.63 |
source: Siblis Research
The whole point is that industries have different sorts of multiples. And valuation becomes much more complicated when firms start embracing multiple roles within the ecosystem. “Sum of the parts” evaluations then must be conducted to figure out what an asset ought to be worth.
