Friday, July 12, 2024

Is GenAI Value Prop the Opposite of Internet?

The answers to questions about financial return from generative artificial intelligence might not have clear answers at the moment, which is worrisome for some observers, especially financial analysts, as well as a relative handful of cloud computing as a service providers who are making huge investments in computing infrastructure. 


One way of illustrating the problem is to compare the costs and benefits. Some would argue that the internet succeeded because it was either a low-cost or moderate-cost platform used to solve multiple significant problems for its users. 


It was, in other words, a tool that produced significant benefits (cost, value, revenue, ease of use, speed, user experience, comprehensiveness) at reasonable cost. 


The internet allowed firms to operate globally at costs not much different than operating locally. It reduced overhead costs; some forms of capital investment; distribution and marketing costs; allowed personalization and customization of products at a higher level. 


Used in conjunction with smartphones, it enabled all sorts of peer-to-peer business opportunities in transportation; lodging and so forth.  


The issue with generative AI is that it appears to be a high-cost solution that so far addresses relatively lower-cost problems (customer service, content generation). 


The best case would be its evolution to become a low-cost solution solving high-cost, high-value problems, or at least a solution for moderate-impact problems at moderate cost. 


In many ways, today’s generative AI data infrastructure requirements for startups pose different cost issues for startups and the cloud computing services that undoubtedly will power most of those operations for clients. 


As with the earlier development of cloud computing, the burden of GenAI infrastructure capex is shifted from individual firms to the cloud computing outfits. 


In 1999, a typical internet startup might spend $500,000 to $2 million on initial infrastructure setup, with ongoing costs of $50,000 to $200,000 per month.


Today, a comparable startup using cloud computing as a service might spend $0 to $10,000 on initial setup, with ongoing costs starting as low as a few hundred dollars per month and scaling with usage. 


For most startups, use of a cloud computing service is generally going to be the approach to using large language models.


At a high level, the strategic problem for a cloud services platform is simply earning a financial return on the huge capital investment to create AI compute capabilities requiring huge investments in graphics processor units and other acceleration hardware. 


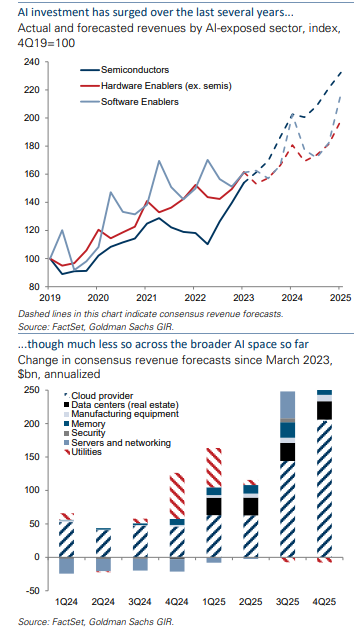
By some estimates, 70 percent  of global corporate investment in AI is spent on infrastructure, representing a global spend of about $64.4 billion in computing in 2022 alone.


Dylan Patel and Afzal Ahmad of SemiAnalysis have argued that “deploying current ChatGPT into every search done by Google would require 512,820 A100 HGX servers with a total of 4,102,568 A100 GPUs.” 


“The total cost of these servers and networking exceeds $100 billion of capex alone,” they estimate. They also estimate the costs of running ChatGPT inference operations at about $700,000 per day.  


So the payback for a cloud computing services provider includes the number of customers buying GenAI as a service; spending by account and the capex and opex to support those operations. 


The longer-term issue is development of attractive payback models for firms that use GenAI. If GenAI remains a relatively-costly type of infrastructure, it will be pushed to solve higher-value problems for firms using it. 


if GenAi winds up being a relatively-costly platform that can only be used to solve lower-cost problems, success is imperiled. If GenAI does not eventually support solutions that materially increase revenue, success is endangered. 


Of course, the payback from infra to support GenAI is not limited to that one use case. The compute platform can be used to support other AI use cases including machine learning as well, one might argue. 


So, over time, the infra payback is going to be leveraged in other ways, not merely gains from using GenAI. 


Assuming AI in general emerges as the next general-purpose technology, how does the payback model compare to the internet, for example, considering both long-term impact and near-term payback on investments? 


Some believe the AI impact on gross domestic product will be hard to measure, for example. 


A general-purpose technology (GPT) is a technological advancement that has the potential to significantly impact a society and its economy on a large scale. These technologies are often foundational; have widespread impact; produce long-lasting changes; are broadly applicable and support continued advances.


Past GPTs include the steam engine, electricity and many information technology platforms. 


GPT

Timeframe of Emergence

Impact Areas

Steam Engine

18th Century

Transportation, Manufacturing, Agriculture

Electricity

19th Century

Manufacturing, Communication, Daily Life

Internal Combustion Engine

19th Century

Transportation, Manufacturing, Warfare

Assembly Line

Early 20th Century

Manufacturing, Production Efficiency

Computers

Mid-20th Century

Communication, Information Processing, Automation

The Internet

Late 20th Century

Communication, Commerce, Information Sharing

Semiconductors

Mid-20th Century

Electronics, Computers, Communication

Materials Science

Ongoing

Manufacturing, Construction, Energy

Biotechnology

Ongoing

Medicine, Agriculture, Materials

Artificial Intelligence (potential)

Ongoing

Automation, Decision-Making, Various Industries


Today, GenAI solves problems of content creation. That might represent a relatively lower-value solution for customer care or marketing. But it might drive lots of value for research-driven endeavors such as pharmaceutical products, such as new drug therapies. 


The internet reduced real estate requirements, some other forms of capex (multi-purpose networks instead of single-purpose); distribution and marketing costs; collaboration costs and many forms of latency (email or instant messaging delivery times compared to postal service). 


In a similar way, GenAI will have disparate impact on firm functions, and on firms in different industries, depending on how much GenAI can reduce costs or create value for various value chain functions. For example, to the extent that GenAI can affect the new drug discovery process for pharmaceutical firms, which might spend as much as half their effort on research, the impact could be significant. 


GenAI could have the greatest impact if it can help the manufacturing process for industrial firms, if possible. It might be logical to conclude that machine vision or machine learning will have more impact than GenAI in industrial processes. 


For most industries, impact is likely to come in sales or fulfillment. 


Industry

Research & Development

Manufacturing

Distribution & Logistics

Sales & Fulfillment

Pharmaceuticals

30-50%

15-25%

10-15%

15-20%

Consumer Retail

5-10%

10-20%

20-30%

30-40%

Aviation

5-10%

20-30%

15-20%

35-45%

Industrial Manufacturing

10-20%

30-40%

15-20%

20-25%

Finance

15-25%

N/A

10-15%

50-60%

Agriculture

5-10%

30-40%

20-25%

20-30%


So identifiable financial returns from AI will be difficult, for many, in the near term. 


Thursday, July 11, 2024

Amazon Claims 100-Percent Renewable Goal Reached 7 Years Early


Wednesday, July 10, 2024

Will Generative AI Capex Pay Off, and When?

About $1 trillion in expected spending on generative AI capital investment in data centers, chips and servers, the power grid and connectivity might not produce the anticipated benefits in the short term, say Goldman Sachs equity analysts Ashley Rhodes, Jenny Grimberg and Allison Nathan. 


But much of the disparity in views about AI is in the timing of benefits, not ultimate value. 


The key phrase might be “in the short term.” Among the “pessimists” cited is Daron Acemoglu, MIT Institute professor. 


Acemoglu forecasts about a 0.5 percent increase in productivity and about a one percent increase in gross domestic product  in the next 10 years, compared with Goldman Sachs estimates of a nine percent increase in productivity and 6.1 percent increase in GDP.


“The forecast differences seem to revolve more around the timing of AI’s economic impacts than the

ultimate promise of the technology,” he argues. 


And much could hinge on “how” generative AI develops and what it replaces. For example, if GenAI winds up replacing low-wage jobs with costly technology, without producing other value, then the investments might be wasted. 


One might argue that the opposite has been the case for some successful technology transitions of the past, including the internet, where relatively low-cost technology replaced costly incumbent solutions. 


Seen in that light, a potential problem with generative AI is that it is a costly investment that almost has to displace complex problems to provide value. And that might take time to develop. 


Impact might also vary across the ecosystem. Suppliers of “picks and shovels” might profit in the short term even if “gold seekers” do not uniformly benefit.


Also, even if value does not appear in GDP statistics, it still is possible that revenue and profits earned by at least some companies in the AI value chain will show positive changes. Think Nvidia and other graphics processing unit suppliers, or possibly “AI as a service” revenues earned by cloud computing as a service providers such as Amazon Web Services. 


As providers of infrastructure, such firms might profit even if others who purchase products and services from infra suppliers do not show revenue or profit gains in the short term. 


In other words, there might be infrastructure supplier winners in the short term, even if many other entities make big investments in generative AI that do now show revenue or profit impact in the near term. 


And even some who are skeptical about the magnitude of positive impact in the short term might well concede that the long term impact is going to be evident. 


By way of perspective, about $5 trillion in information technology investments are made every year, according to researchers at Gartner. 


source: Goldman Sachs Global Investment Research 


“Generative AI has the potential to fundamentally change the process of scientific discovery, research and development, innovation, new product and material testing an so forth, as well as create new products and

Platforms,” he notes. “But given the focus and architecture of generative AI technology today, these truly transformative changes won’t happen quickly and few—if any—will likely occur within the

next 10 years.”


Again, the key phrase might be “today.” Generative AI is expected by some to achieve human-level performance in most technical capabilities by the end of this decade, and compete with the top 25 percent of human performance in all tasks before 2040, according to McKinsey.


If so, both optimists and pessimists have a valid point. In the short term, gains might be muted; in the long term just the opposite could occur. 


One study suggests “that around 80 percent of the U.S. workforce could have at least 10 percent of their work tasks affected by the introduction of LLMs (large language models), while approximately 19 percent of workers may see at least 50 percent of their tasks impacted,” the authors estimate. 


Significantly, though, they do not speculate about the amount of time those changes will take, and when they will be realized. Again, there is a cost-benefit issue. To provide lots of value, generative AI has to prove it can address complex problems that displace high-priced labor or create other sources of value that drive growth, new products or markets. 


McKinsey suggests a longer time frame as well. For specific capabilities, the timeline for achieving human-level performance has been pulled forward, compared to earlier forecasts. They suggest human level performance happening perhaps two decades earlier than previously seen:


  • Creativity: from around 2048 to 2023

  • Logical reasoning and problem solving: from around 2043 to 2023

  • Natural language understanding: from around 2055 to 2025

  • Social and emotional reasoning: from around 2050 to 2033


Still, all those developments are far outside the financial return window for capital investments to be made over the next several years, which might be expected to produce breakeven results on investment in three to five years, with gains thereafter. 


The point is that operating profits from large capex programs typically are not seen in a matter of a few quarters. Granted, software firms might often expect capital investment “breakeven” points to be reached in two years or less. More capital-intensive “utility-type” firms might expect capex breakeven in two to five years. 


Measurable generative AI returns should not take five years, as cost savings should be quantifiable, for some use cases, within a year or so. Measurable returns for other use cases might not be so easy, or so swift. 


The ultimate results may well turn on how fast generative AI is able to prove useful for complex tasks. As always, much hinges on the assumptions we make. How much benefit will accrue from automation, and how much from faster rates of innovation? 


For example, Acemoglu assumes that generative AI will automate only 4.6 percent of total work tasks, while Goldman Sachs economists estimate that generative AI will automate 25 percent of all work tasks

following the technology’s full adoption.


source: Goldman Sachs Global Investment Research 


“Acemoglu’s framework assumes that the primary driver of cost savings will be workers completing existing tasks more efficiently and ignores productivity gains from labor reallocation or the creation of new tasks,” say Goldman Sachs economists. “In contrast, our productivity estimates incorporate both worker reallocation—via displacement and subsequent reemployment in new occupations made possible by AI-related technological advancement—and new task creation that expands nondisplaced workers’ production potential.”


“Differences in these assumptions explain over 80 percent of the discrepancy between our 9.2 percent and Acemoglu’s 0.53 percent estimates of increases in total factor productivity over the next decade,” the Goldman Sachs authors say. 


As always with forecasts, the assumptions are key. How much value, and when that value is obtained, all vary based on the assumptions.


Tuesday, July 9, 2024

6G Bandwidth: More, Says NextG Alliance

Discussing spectrum and capacity needs for 6G networks, the NextG Alliance suggests that the highest requirements will be for business-to-business or business-to-consumer applications such as extended reality, which might require 500 Mbps or more. 


Other relatively-high-bandwidth use cases include entertainment (100 Mbps to 500 Mbps) and robotics and autonomous systems. 

source: NextG Alliance 


That noted, most use cases will require far less bandwidth. 


Monday, July 8, 2024

What History Suggests about Generative AI Markets

Lots of people now are required to make estimates of the size of the generative artificial inatelligence and other AI market s, if only to analyze the value of companies that should be affected, for better or worse.


One might not believe history is very useful for market forecasting exercises, but I’ve always found history a form of data-driven analysis. Past patterns often exist and can be used to establish a range of possible outcomes in various industries. 


For example, past general-purpose technologies often have initially favored suppliers of infrastructure. Think Nvidia, graphics processors or memory, for example.


Internet accerss providers and data transport companies were early beneficiaries of the internet. Railroad and electrical generation and transmissions firms were early winners for the railroad and electricity GPTs.


Beyond, that, once activity spreads to industries that can take advantage of the GPT infrastructure, some industries historically grow fast; some slowly. Some industries are highly-concentrated; others less so.


So one early assumption is that any industry (young or old; physical or virtual products) has to be categorized as akin to others: fast-growing or slow-growing; susceptible to fragmentation or not. 


Then one can examine historical adoption rates for various types of business and consumer products, to get an idea of possible faster or slower adoption (growth) rates. That tends to establish a reasonable upper and lower bound for potential growth patterns. 


In the early days of telecom deregulation in the United States (in the wake of the 1986 Bell system breakup; followed by the Telecommunications Act of 1996, competition and fragmentation momentarily reigned, but rather quickly resulted in high concentration again. 


Many software-driven industries start out highly fragmented but consolidate into moderately- to highly-concentrated structures, based on market shares. And, sometimes, high concentration, where markets are led by three or so leaders (share), also coexists with a fair amount of fragmentation among small firms serving niches. 


Industry

Concentration Level

Notable Characteristics

Search Engines

Very High

Google dominates with over 90% market share

Commercial Aircraft

High

Duopoly between Airbus (>50%) and Boeing

Automobiles

Moderate to High

Concentrated but with weak pricing power due to competition

Telecom

High

Oligopoly is the rule

Oil Refining

Moderate to High

Capital intensive, high barriers to entry/exit

Software

Moderate to High

Some software segments have a few dominant players, while others are more fragmented. Generative AI is moderately concentrated, but almost certainly will become highly concentrated over time. 

Chip Industry

Moderate

Oligopoly within segments; somewhat fragmented across the full industry

Content

Moderate to High

High concentration for video streaming; studios; TV broadcasting, newspapers. Less concentrated in support services, radio broadcasting, online media, “magazine” content

Biotechnology

Moderate

Top 4 firms hold 84% market share (oligopoly)

Retail

Low to Moderate

Many players, but some large chains dominate certain segments

Restaurants

Low

Fragmented market with many local and chain options

Professional Services

Low

Legal, accounting, engineering and other services typically are highly fragmented

Agriculture

Low

Numerous small farms and producers

Retail

Low

Fragmented generally, but more concentrated in segments such as grocery


Think about mobile service, where a few U.S. firms hold as much as 97 percent share, while dozens of firms make up the remaining three percent to six percent of accounts or revenue, for example. Three firms control about 95 percent of the branded account volume. Mobile Virtual Network providers hold perhaps five percent share, but that must be qualified since the larger MVNOs are owned by the top-three mobile operators. 


Mobile Service Provider

Estimated Market Share (%)

Verizon

~35

AT&T

~35

T-Mobile

~25

MVNOs (Mobile Virtual Network Operators)

~5


For example, it is estimated that U.S. MVNOs book about $13.7 billion in annual revenue. Assume an average account revenue of $300 per year ($25 a month). But assume about half those accounts are offered by MVNOs owned by the big three providers. 


That implies the independent, non-affiliated MVNOs book about $6.8 billion annually, representing about 22.8 million accounts. Against a total market of 372.7 million accounts, that suggests a share of about six percent for independent providers. 


So, yes, the U.S. mobile services market is highly concentrated, but also features a fragmented independent MVNO pattern as well. 


As a practical matter, for analysts of market dynamics in the mobile service provider space, that means paying attention to the three firms holding perhaps 94 percent to 95 percent share, on the clear assumption that the overall market is driven by the leaders. On the other hand, even when the market is not driven by the MVNOs, many still exist. 


Roughly the same dynamics happen in the U.S. home broadband market, again driven by a handful of firms, but with a growing number of small independent providers. Just two service providers claim 55 percent market share, according to Leichtman Research Group. 


source: Leichtman Research Group


The point is that even when total market dynamics are dictated by the few leading firms, there also can exist a fragmented set of small providers coexisting with the leaders. Analytically, one can understand market dynamics by understanding outcomes of a relatively few firms with scale, even when a fragmented base of contenders also operate. 


In other words, studying the dynamics of the leaders (Amazon, Walmart and a few others) tells us most of what the market is doing, even when a huge fragmented market of retailers also operates.


For analytical purposes, past retail behavior (history) are good starting points for future projections about markets, even when restricting the analysis to just a few firms. So, yes, history can be a useful tool for predicting future developments. 


Why Marginal Cost of Content Creation is Generative AI's Superpower

Virtually every observer might agree that artificial intelligence will automate laborious tasks and therefore increase process efficiency. A...