Sunday, August 4, 2024

Hyperscaler AI Capex Disruption is Nothing Compared to Cable Operator FTTH Challenge

Technology discontinuities can be very disruptive of business models, in areas such as capital investment burdens, for example. For cloud data centers, we might ponder how accelerated spending on graphics processor units could affect more-routine updates of servers supporting traditional operations. 


Researchers at Omdia estimate that AI server capex will be 66 percent of total data center capex in 2024, for example. And cloud computing giants tend to increase capex spending substantially, year over year, in any case.  


Between 2018 and 2022, annual cloud computing hyperscaler capex has grown about 30 percent a year, according to researchers at Costar. Omdia thinks that rate will be exceeded in 2024. 


Of course, not all observers think the increases will be that high. Some think the increase could be closer to 10 percent, overall, with the caveat that some spending could be shifted from other areas of infrastructure to server purchases. 


Also, since the spring of 2024, most of the hyperscalers have announced increases above the level noted by Dgtl Infra at that time. 


source: DgtlInfra 


Still, most observers would tend to agree that hyperscale cloud computing capex will increase in 2024 between 15 percent and 35 percent. 


Estimate

Publication Date

Publishing Venue

Cloud Provider

Increase

Cloud Capex in a Time of Uncertainty

July 24, 2024

Gartner Research

All

15-20%

The Public Cloud Race: 2024 and Beyond

June 10, 2024

Synergy Research Group

Amazon Web Services (AWS)

22-25%

Capital Intensity in Hyperscale Data Centers: A 2024 Update

May 15, 2024

McKinsey & Company

Meta, Alphabet (Google Cloud)

30-35%

Cloud Wars: The Battle for Enterprise Spending

April 02, 2024

Barclays Research

Microsoft Azure

18-22%


The point is that capex as a percentage of revenue is growing.  


source: Futurion 


U.S. cable TV operators also face a discontinuity, namely a switch of platform from hybrid fiber coax to fiber-to-home networks, driven primarily by home broadband requirements. 


And cable operators are likely to find the cost of switching from the existing access platform to fiber-to-home to be as costly as telcos have faced, as it means switching from one type of platform to another (copper to fiber for telcos; hybrid fiber coax to FTTH for cable operators). 


For that reason, cable operators are likely to use any number of targeted upgrades whenever possible. The objective will be to delay a full “rip and replace” as long as possible. Near term, HFC upgrades will continue as long as possible, with incremental FTTH overlays in some cases. 


But a full transition away from HFC for most households will be quite disruptive, on the order of what telcos have faced moving from copper to fiber access. Where upgrading HFC has cost something on the order of $200 per location, an FTTH upgrade might cost between $1,200 and $2,500 per passing. 


That is an order of magnitude increase in capex. 


Upgrade Type

Estimate Name

Publication Date

Publishing Venue

Cost Estimate (per-passing)

Cable TV Operator

HFC Network Modernization with DOCSIS 4.0

January 2023

Light Reading

Less than $200

Cable TV Operator

Full Fiber Upgrade - Greenfield Deployment

August 2021

FierceTelecom

$1,200 - $1,800

Cable TV Operator

Full Fiber Upgrade - Brownfield Deployment (Existing Infrastructure)

August 2021

FierceTelecom

$1,800 - $2,500

Telco

Fiber-to-the-Premises (FTTP) Greenfield Deployment

May 2022

FTTH Today

$1,000 - $1,500

Telco

Fiber-to-the-Building (FTTB) Greenfield Deployment (Multi-dwelling units)

May 2022

FTTH Today

$800 - $1,200

Telco

FTTP Brownfield Deployment (Existing Infrastructure)

May 2022

FTTH Today

$1,200 - $1,800


 So the cable operator transition from HFC to FTTH will be much more disruptive than the cloud computing hyperscaler investment in AI capex. 


Friday, August 2, 2024

Many Consumers Will Always Buy "Good Enough Value" Home Broadband

Some question the long-term viability of 5G fixed wireless services, arguing that, eventually, it will prove unable to compete with ever-higher capacities supplied by cabled networks, especially fiber to home platforms. 


Supporters might make the case that “eventually” is the key phrase, as the market potential for fixed wireless between “today” and “tomorrow” is likely to be quite extended. At the moment, perhaps 51 percent or 52 percent of all U.S. homes or dwelling units have service available from at least one provider. 


By 2030 that percentage might increase to 76 percent to 80 percent. 


At the moment, perhaps 10 percent to 15 percent of U.S. homes have FTTH service available from at least two providers, growing to possibly 30 percent to 40 percent by 2030. 


For starters, FTTH is expensive enough that no single service provider can afford to build new networks ubiquitously, even if the customer demand is present. By some estimates, the cost to pass one urban home might be just $1,000, but the cost to pass suburban locations might range up to $3200, while rural passings can easily cost $7,000 or more. 


Area Type

Density

Estimated Cost per Home/Passing

Metropolitan

High

$1,000

Suburb (Flat Terrain)

Medium

$2,700

Suburb (Hilly Terrain)

Medium

$3,240

Rural (Flat Terrain)

Low

$6,300

Rural (Hilly)

Low

$7,000


And that is construction cost only, not including the cost to activate an account, which can add costs between $300 to $500 for each install. 


An equally-important issue is the take rate for such networks. It has been common for any new FTTH provider that is a telco to get up to 40 percent take rates over a few years, with initial uptake in the 20-percent range, often. Independent ISPs competing with both cable operators and a telco might expect take rates not exceeding 20 percent (where the cable operator can offer gigabit service and the telco does not offer FTTH). 


So the longer-term issue is how big the market might be for wireless service offering speeds in the lower ranges (100 Mbps to 200 Mbps now; undoubtedly higher speeds in the future), as more fiber access is available. To the extent that fixed wireless is taking market share from cable operators (perhaps even operators able to sell gigabit-per-second connections), we can infer that a substantial portion of the market is happy to pay the prevailing rates for access at such speeds, especially when able to bundle home broadband with their mobile access services. 


When comparing fixed wireless to either cable modem or FTTH service, many consumers might not be especially interested in services operating the 500-Mbps and faster ranges, much less gigabit ranges, when the slower speeds cost less. 


But demand will continue to shift over time, with most consumers eventually buying services operating faster than 200 Mbps, and in many instances much faster than 200 Mbps (gigabit to multi-gigabit ranges, for example). To be sure, fixed wireless providers are likely to find ways to increase their speed tiers as well, beyond 200 Mbps in the future, even if virtually all observers suggest wireless will continue to lag cabled networks in terms of speed. 


Speed Tier Take Rates, in Percentage

2023

2030

2040

Less than 100 Mbps

20-30

5-10

1-2

100 Mbps to 200 Mbps

30-40

10-20

5-10

Faster than 200 Mbps

30-40

70-80

85-90


Perhaps the best analogy is what cable operators have been able to do with their hybrid fiber coax networks, boosting speeds over time. 


Keep in mind that cable networks and FTTH networks back around 2000 were only offering top speeds in the 10-Mbps range. Fixed wireless networks also will be able to increase speeds over time, if never on the scale of cabled networks. 


Year

Typical Cable Operator Maximum Speed

1996

1.5 Mbps

Early 2000s

10 Mbps

Late 2000s

50 Mbps

2010

100 Mbps

2015

300 Mbps

2016

1 Gbps

2024

2 Gbps


But absolute ability to match cabled network speeds is not the question. The issue is what percentage of customers will, in the future, be willing to buy fixed wireless home broadband, at then-prevailing speeds, prices and offers. 


High-Cost Home Broadband Subsidies Work

Very few major social problems have clear and uncomplicated causal relationships, which makes virtually impossible the task of determining whether public policies actually work, or not. 


For complex social problems like poverty, housing, crime, education, carbon reduction or traffic, it remains quite difficult to prove causal links between policies and outcomes. Basically, policies are tried without any real way of knowing whether they work. 


Contrast that with a few instances where the primary causation mechanisms are relatively clear. The causal link between smoking tobacco and various health issues like lung cancer, heart disease, and respiratory problems is well-established.


There is a direct causal relationship between alcohol consumption and impaired driving leading to accidents and fatalities.


Conditions such as scurvy (vitamin C deficiency) or rickets (vitamin D deficiency) have clear causation mechanisms related to lack of specific nutrients in the diet. Likewise, the danger of lead exposure, especially in children, is clear.


The overuse and misuse of antibiotics in healthcare and agriculture has a direct causal relationship with the development of antibiotic-resistant bacteria.


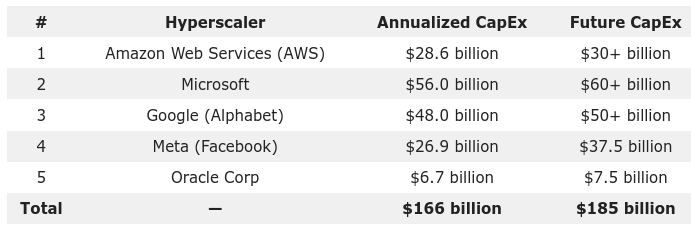
Home broadband supply now is likely one problem for which we know at least one causal relationship, namely that financial subsidies work. Since the cost of home broadband infrastructure is directly related to population density, financial subsidies are required in low-density rural areas. 


Urban households tend to have access to better home broadband than households in rural areas, rural residents might note, policymakers might agree and OpenSignal says. 


And though there are correlations between income, education and age in any market, “income levels are less predictive of reliability than density,” OpenSignal notes.


It might be noteworthy that although sharing of network infrastructure often is touted as a way of reducing the cost of home broadband infrastructure, OpenSignal studies find there is no correlation between network infrastructure sharing and either high reliability or a narrow digital divide. “Countries with limited infrastructure sharing but targeted subsidies for private rural investment mostly perform better than those relying on widespread infrastructure sharing,” OpenSignal notes.


Topography and density are key factors in the size of the divide between urban and rural home broadband experience. 


Markets with highly-concentrated populations in urban areas show small gaps between urban and rural reliability, and spread-out middle-income countries with difficult terrain show big gaps. “But a few countries with lots of medium-density areas, like the U.S., and Spain, have relatively small digital divides,” the firm says. 


In fact, the U.S. market might better be characterized as having huge low-density areas. population density has a huge impact on the cost of building new networks, mobile or fixed, but especially fixed networks.  


U.S. population density is quite thin across most of its geography, which directly affects the cost of building broadband networks, as hefty subsidies are required to reach the last one percent or two percent of remote locations. 


And the United States has a huge percentage of its land mass that is thinly settled, if at all settled. In Canada, 14 percent of the people live in areas of density between five and 50 people per square kilometer. In Australia, 18 percent of people live in such rural areas.


In the United States, 37 percent of the population lives in rural areas with less than 50 people per square kilometer.


Put another way, less than two percent of Canadians and four percent of Australians live in such rural areas. In the United States, fully 48 percent of people live in such areas.


Put another way, about six percent of the U.S. land mass is “developed” and relatively highly populated. Those are the areas where it is easiest to build networks. But about 94 percent of the U.S. land surface  is unsettled or lightly populated, including mountains, rangeland, cropland and forests. And that is where networks are hardest to build and sustain.


So it should not at all be surprising that broadband reliability is, on average, 23 percent higher in urban areas than in rural areas across all markets we analyzed,” say analysts at OpenSignal. The firm uses a 100 to 1000 point scale to measure broadband experience in a typical household where multiple devices are used simultaneously. 


The metric is based on ability to connect (uptime); ability to complete tasks and speed, latency, jitter performance. 
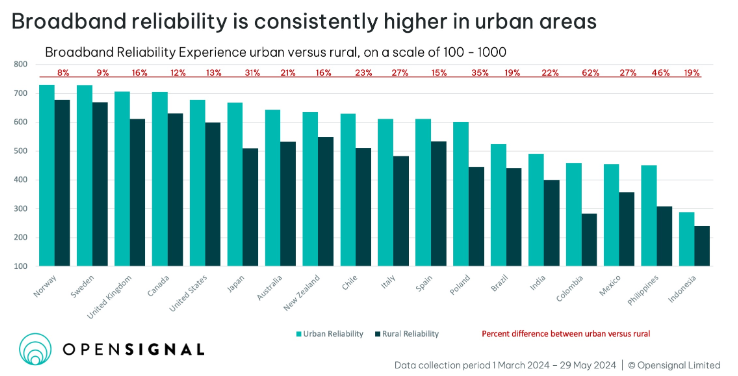

source: OpenSignal 


Financial subsidies for service providers in rural areas are one way governments try to close digital divides, and arguably are the most effective ways to do so. Whether in the form of subsidies for anchor institutions or per-passing or per-connection support is the clearest way to reduce the cost of rural infrastructure for suppliers. 


Beyond that, policymakers often try to encourage competition and promote deployment of alternative platforms (satellite, fixed wireless, mobile access). 


Governments can help communities create cooperatives; reduce permitting and other regulatory costs or train people to use broadband. But perhaps nothing works so well as simple subsidies, for the simple reason that population density and network cost are inversely related. 


High population density leads to lower costs; low density leads to higher costs. So subsidies for home broadband in rural areas are a relatively clear example of cause-and-effect relationships. 


Who Wins AI Arms Race?

Perhaps Meta’s reported ad revenue growth, along with its planned AI investments, will provide some comfort to observers worried about the pace and payoff of such investments. 


Those developments, where the fundamentals of the legacy business are robust, while AI investments are reasonable enough to be supported to that revenue, arguably represent the best case so far for balancing AI capex and current earnings.


Where Meta now predicts full- year 2024 capital expenditures in the range of $37 billion to $40 billion, updated from its prior range of $35 billion to $40 billion, second-quarter revenues were up 22 percent ( 23 percent on a constant currency basis), year over year. 


“At the end of the day, we are in the fortunate position where the strong results that we're seeing in our core products and business give us the opportunity to make deep investments for the future,” said Mark Zuckerberg, Meta chairman and CEO. 


Which might also illustrate another key principle: so-called “AI stocks” might have to be evaluated based primarily on how their core legacy businesses are situated, irrespective of any future benefit from AI operations and products, since such benefits will not be obvious for some time. 


“While we expect the returns from Generative AI to come in over a longer period of time, we’re mapping these investments against the significant monetization opportunities that we expect to be unlocked,” Zuckerberg noted.


In the particular case of Meta, at least some analysts and observers will be heartened by the apparent recognition on Meta’s part that AI is the more-immediate opportunity, compared to augmented reality, for example. 


“A few years ago, I would have predicted that holographic AR would be possible before Smart AI, but now it looks like those technologies will actually be ready in the opposite order,” said Zuckerberg. 


Commenting on “the AI platform shift,” Similar to the cloud, this transition,  Satya Nadella, Microsoft Chairman and CEO, noted that AI is similar to the prior transition to cloud computing, involving  capital-intensive investments

In other words, investment has to be made. 

As was the case at Alphabet and Meta, revenue was up 15 percent, year over year in the second quarter of 2024. 

Al capex also is up at Microsoft, but “roughly half of FY2024's total capital expense as well as half of fourth-quarter expense, it's really on land and build and finance leases, and those things really will be monetized over 15 years and beyond,” said Amy Hood, Microsoft CFO. 

Over at Alphabet, second-quarter 2024 revenues were up 14 percent (15 percent) in constant currency, year over year. But AI capex is expected to hit $50 billion in 2024. 


Market watchers seem to see danger for Alphabet’s search revenue stream as rival AI suppliers seek to cut into Google’s search dominance, beyond the issue of AI capex magnitude. 


 “The risk of under-investing is dramatically greater than the risk of over-investing for us here, even in scenarios where it turns out that we are over investing,” said Sundar Pichai, Alphabet CEO. 


It also is worth noting that, because of regulatory scrutiny, it no longer is possible for Alphabet to “acquire” positions in markets or capabilities. Instead, it has to grow them organically. 


The implications of Meta’s positioning on AI capex might be about as good as it gets: robust core revenue drivers able to support AI capex. Alphabet’s ad growth was not as good as Meta’s in the second quarter, and beyond that there are the concerns of search market share dangers. 


How Will Generative AI App Adoption Compare to Internet App Adoption?

Many observers expect generative artificial intelligence applications to gain substantial use even faster than internet apps. That might imp...