Showing posts sorted by relevance for query FTTH speed. Sort by date Show all posts

Wednesday, January 26, 2022

AT&T FTTH Metrics Improve, But Deployment Pace and Take Rates Really Matter

In its competitive battle for home broadband customers, AT&T’s fortunes depend on three key drivers: fiber to home coverage; take rates and any average revenue per account gains that could supply, with the primary variable being coverage. 


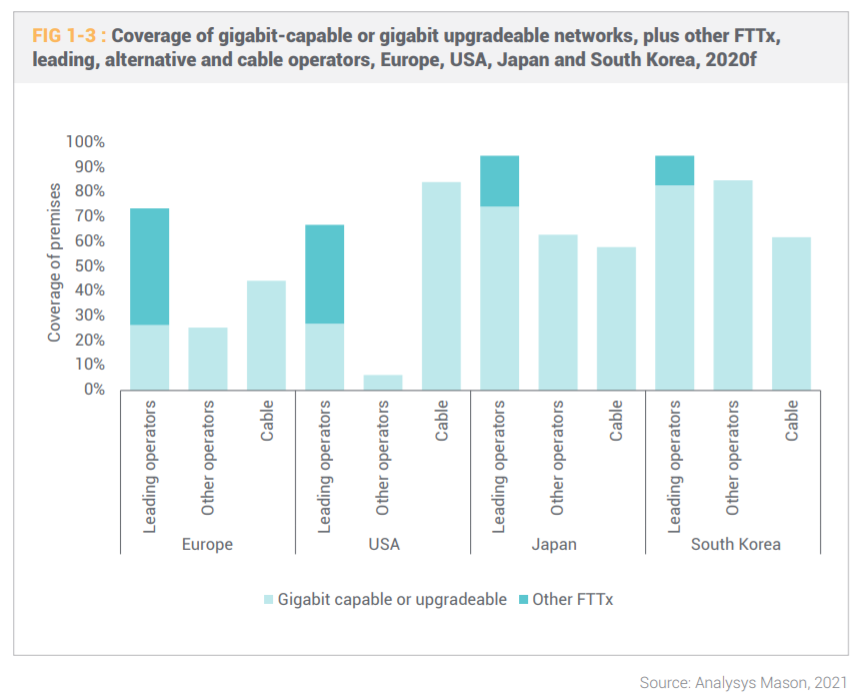
The reason is simply that AT&T cannot challenge dominant cable TV providers for installed base and market share until the company has much-greater FTTH coverage. Simply put, AT&T and most other local exchange carriers cover too few homes to go head to head with cable home broadband. 


To be sure, AT&T and other telcos are pushing FTTH deployments at an accelerated pace. AT&T expects to have 30 million home locations passed by FTTH by about 2025, up from about 15 million to 15.5 million at the moment. 


source: AT&T 


Keep in mind that AT&T passes a total of about 57 million homes. So the company’s current FTTH coverage is between 26 percent and 27 percent of its total passings. 


AT&T will not be able to go head to head with cable, across the full range of home broadband speeds, until it has FTTH available to most homes in its fixed network footprint. By 2025, when AT&T expects to  have 30 million FTTH passings, it will be able to compete head to head in about 45 percent of its footprint. 


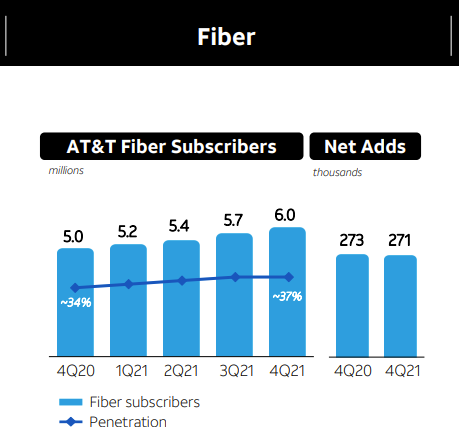
Take rates are arguably the second most-important variable, as there is a difference between an active account and a location able to buy. Over the past year, AT&T has boosted its FTTH take rate from 34 percent of passings up to 37 percent of passings. 


The goal is to approach 50 percent take rates, which would exceed the general take rate of about 40 percent telcos have been able to garner over the past couple of decades. 


Finally, it remains to be seen how average revenue per account changes as more customers take FTTH home broadband services. At the moment, AT&T’s bottom tier FTTH home broadband service (exclusive of taxes) runs about $55 per month. The mid-range tier costs about $65 a month, while the top gigabit tier sells for $80 a month.


In addition, AT&T has added two premium tiers offering 2-Gbps symmetrical and 5-Gbps symmetrical access for $110 and $225 per month, respectively. The mix of accounts could strongly affect AT&T revenues. 


The lowest FTTH tier--offering 300 Mbps--covers more than half of the U.S. home broadband buyer base. Another 17 percent of customers buy services operating between 200 Mbps and 400 Mbps. 


source: Openvault  


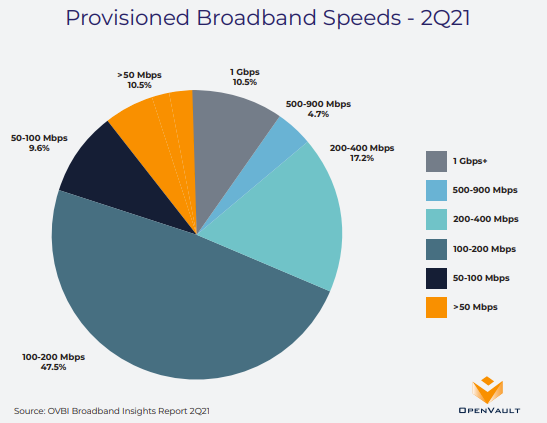
Assuming lower-income households take advantage of support programs, those households reached by AT&T could have internet access at 300 Mbps for about $25 a month. 


That is why the pace of FTTH upgrades matters so much for AT&T. To reach parity with cable TV operators, which AT&T defines as market share greater than 50 percent and installed base approaching 50 percent. Without nearly-ubiquitous FTTH deployment, those goals are likely unreachable. 


To be sure, competition at the lower speed levels--up to about 100 Mbps, is an opportunity for Verizon and T-Mobile. Verizon has a limited fixed network footprint of U.S. homes while T-Mobile has had zero share of the home broadband market. 


Even if those two firms use fixed wireless to reach the lower and middle tiers of buyers, that is about 65 percent to 70 percent of today’s home broadband market. 


For AT&T and other telcos, though, the pace of FTTH deployment will be the story.


Friday, October 14, 2022

Faster Home Broadband Just Keeps Coming, As Edholm and Nielsen Laws Predict

Google Fiber will launch 5-Gbps and 8-Gbps internet access service in early 2023. Both products will offer symmetrical upload and download speeds, Google says. 


Google Fiber launched gigabit service in 2010, 2-Gbps service in 2020 and (and is testing 20-Gbps service. 


The 5-Gbps tier will cost $125 per month, while the 8-Gbps tier will cost $150 per month. 


Separately, it seems increasingly likely that Comcast will begin to introduce service at speeds possibly in the 4-Gbps to 6-Gbps range in 2023. And those services might well be symmetrical, able to extend to 10-Gbps symmetrical. 


Those speed increases are predictable and expected according to two theorems. 


Nielsen's Law suggests that the top-end speed will grow 50 percent per year. Edholm’s Law states that internet access bandwidth at the top end increases at about the same rate as Moore’s Law, which is about a doubling every 18 months or so. 


That means the top-end home broadband speed could be 85 Gbps to 100 Gbps by about 2030. 

source: NCTA  


Nielsen Norman Group estimates suggest a headline speed of 10 Gbps will be commercially available by about 2025, so the commercial offering of 2-Gbps and 5-Gbps is right on the path to 10 Gbps. 


AT&T, for example, just activated symmetrical 2-Gbps and symmetrical 5-Gbps service for 5.2  million locations across 70 U.S. markets, with plans to deploy across the whole footprint in 2022 and later years. 


There is widespread expectation that the headline speed for home broadband, in many markets, will be 10 Gbps by about 2025. 


By other rules of thumb, that also suggests the "typical" home broadband customer will be buying service at rates between 1 Gbps and 2 Gbps, with a significant percentage buying service at 4 Gbps. 


Nielsen’s Law has operated since the days of dial-up internet access. Even if the “typical” consumer buys speeds an order of magnitude less than the headline speed, that still suggests the typical consumer--at a time when the fastest-possible speed is 100 Gbps to 1,000 Gbps--still will be buying service operating at speeds not less than 1 Gbps to 10 Gbps.  


source: FuturistSpeaker 


So top end speeds in the terabits per second are virtually inevitable by about 2050. The emergence of offers between 2 Gbps and 5 Gbps now is simply evidence that the trend continues. 


At the moment, top speeds in the U.S. market are in the 2 Gbps and 5 Gbps ranges.Comcast has introduced 3-Gbps services for business. Ziply has introduced symmetrical 2-Gbps service. Google Fiber has added 2-Gbps as well. 


Frontier Communications is doing the same. Verizon offers 2-Gbps Fios service. AT&T sells both 5-Gbps and 2-Gbps service. Many of those offers feature symmetrical bandwidth


Perhaps the greatest value change, though, is not the headline downstream speed, but the symmetrical speeds, as in the U.S. market asymmetrical services sold by cable operators have nearly 70 percent market share. 


Though the cable hybrid-fiber coax networks can be configured to support more upstream bandwidth, fully-symmetrical service typically requires switching to fiber-to-the-home platforms. 


To scale new capital investments, cable operators in many cases will choose to extend downstream speeds and lift upstream speeds, approaching or reaching fully symmetrical service with DOCSIS 4.0 before considering other measures such as switching to FTTH. 


If the “typical” customer buys a service operating at up to an order of magnitude less than the highest headline speed, we might infer that the typical home account--offered by ISPs with various speed plans--will be buying service at speeds between 500 Mbps and 800 Mbps in 2025. 


Keep in mind that Google Fiber’s footprint is quite limited, so not many households will be able to buy Google Fiber service, now generally available at either 1-Gbps or 2-Gbps speeds. In such cases, the headline speed and the median speed tend to be virtually identical. 


The real local market test will tend to be the 2-Gbps to 5-Gbps services sold by Comcast, which has the biggest home footprint, or AT&T, with perhaps the third-biggest footprint. But those services are marketed mostly to business customers, at this point. 


Saturday, February 13, 2021

How Cloonan's Curve Suggests Cable Operators Can Extend the Life of HFC

Nielsen’s Law of Internet Bandwidth states that a high-end user’s connection speed grows by 50 percent each year, doubling roughly every 21 months. That suggests a top-end internet access connection in 2025 will offer 10 Gbps speeds in the downstream. 


But it is reasonable to assume Nielsen’s growth rates cannot continue forever, as 50 percent compounded growth without end has some physical limits (time, physics, cost, demand, substitutes). At some point, as was true with personal computer processors, parallel processing becomes the method for boosting performance, while raw processing itself loses relevance as a product differentiator. 


In the consumer internet access space, that suggests both new ways of supplying bandwidth, less value produced by ever-increasing speed offers and a shift to other forms of value. 


Nielsen’s Law only predicts the top speed available for purchase, however, not the average or typical speed a consumer might buy. It has taken quite some time for customer uptake of gigabit internet access services to reach as much as eight percent share of total, for example. 


Keep in mind that the first U.S. gigabit services began commercialization in 2013. It has taken seven years for adoption to reach eight percent of the installed base, in part because that grade of service is not universally available in the U.S. market, for example. 


Cloonan's Curve provides a way of estimating bandwidth speeds purchased by cable modem customers, in relation to the headline speed (Nielsen rate). Most customers do not typically buy the fastest-available service, as that also is typically the most-expensive tier of service. Instead, they tend to buy the mid-level service. 


The caveat is that Cloonan’s Curve obviously does not apply to service providers that sell only a single tier of service, at the advertised headline rate (“gigabit only,” for example). 

source: Commscope


This illustration of downstream bandwidth plans actually purchased by customers suggests that although both Nielsen and Cloonan rates increase at about 50 percent per year, most customers buy services that offer six times to 20 times less speed than the fastest-available service tier. 


Think of the fastest tier of service (1 Gbps, for example) as the “billboard tier” that is featured in service provider advertising as the “speeds as fast as X” rate. Then consider the “common or popular tiers” as those in the middle of the offered speed ranges. Then there is an “economy tier” for customers with light usage patterns, limited app requirements or willingness to pay profiles. 


That has implications for network planning, bandwidth upgrades and marketing. Internet service providers can advertise the headline speed knowing that a small percentage of customers are going to buy it. 

source: Commscope


Networks obviously must be designed to deliver the headline rate. But total bandwidth consumption, which affects the capabilities of the rest of the network, does not assume that every customer buys the headline rate service. Instead, the variable portions of the network can be designed on the assumption that most customers will, in fact, not buy the headline service. 


Since speed and data consumption tend to be correlated, that affects capacity planning for backhaul, for example. Simply, the Cloonan Curve informs thinking about how much capacity must grow to support the actual mix of demand from the full set of customers, based on their actual buying patterns. 


That is important to match capital investment as much as possible to the variable demands placed on the network by various customer groups. 


For a cable ISP, there are other implications. At some point, it will make sense to migrate the highest-usage customers--often identical with those buying the headline service--off the hybrid fiber coax network and onto a parallel access network using fiber to the home instead. 


It is common to find that the top one percent of customers generate as much as 15 percent of total network usage, for example. So moving those customers off the core network frees up considerable capacity for the rest of the customers, 90 percent of whom might be supported on the legacy access network. 


That allows a longer useful life for the HFC network, as most customers will continue to buy the popular and economy tiers of service that still can be supported using HFC. 


Nielsen’s Law does not account for upstream bandwidth, however. Upstream capacity tends to grow at about half the rate of downstream bandwidth, or about 25 percent per year. 


Customer behavior also varies. On cable networks, the heaviest users (one percent) of customers generate as much as 47 percent of upstream bandwidth. And it often is the case that 80 percent of total upstream capacity demand is generated by just 10 percent of total users. 


ISPs using telecom platforms also will confront that same general issue of bandwidth growth, and the differential demand for tiers of service. Fiber to home platforms keep increasing performance as well, and some suggest future performance will be boosted economically based on use in the local loop of components originally commercialized to support data center optics. 


That is why 25 Gbps passive optical networks initially deployed for business-to-business applications in the local loop will be powered by commercial availability of data center optical components, Nokia argues. Commercialization for B2B use cases should then be leveraged for B2C applications as well. 


Nielsen’s Law and Cloonan’s Curve also suggest the potential limits of HFC as a platform. If consumer usage patterns do not change; if ISP usage policies do not change; if app usage patterns do not change; if pricing patterns do not change, then there is a point in time where HFC fails to support cable operator business models. 


The point of overlaying FTTH for the heaviest users is that, all other things being equal, the useful life of HFC is extended, with a more-gradual shift of cable platforms to FTTH over time. 


The issue is to avoid the stranded capital problem and immediate higher capital investment implications of a jump cut to FTTH. That would be as difficult for cable operators has it has proven to be for telcos.


Friday, January 29, 2021

Business Models Matter More than Access Media

Though the standard prescription for better broadband globally is fiber to the premises, there are some significant differences in a few countries. Looking at where gigabit internet access speeds are now available, In the United States 80 percent of locations are reached by cable operators. About 25 percent of telco FTTH homes supports those speeds, Analysys Mason data indicates. 


In South Korea, about 60 percent of homes can buy gigabit service. About 80 percent of homes served by telcos can do so. In Japan, nearly the same percentage of cable homes can buy gigabit service, while 75 percent of telco homes can do so. 


In Europe, about 40 percent of homes can buy cable gigabit service from a cable operator, compared to about 25 percent of homes able to buy gigabit service from a telco. 


source: ETNO, Analysys Mason 


Two points are noteworthy in this regard. FTTH and HFC refer only to access media. Use of either media does not mean “gigabit per second speeds.” Cable networks also can do so. But most U.S. FTTH networks are not yet supporting gigabit speeds. 


The point is that the traditional telco framing of the FTTH deployment case is about access media, not speeds. If speed, and coverage, are the issues, then hybrid fiber coax often is a major--if not the leading--platform. 


Future proofing also is an issue. Still HFC architects have successfully boosted speeds to gigabit ranges, with a roadmap to 10 Gbps speeds and higher speeds (up to 100 Gbps over the next decade), before the platform possibly reaches a limit. 


As a practical matter, one might ask whether the cable HFC business model ever reaches a point of limits over the next few decades, if speeds can be pushed to 100 Gbps, and made more symmetrical. 


The issue is not simply speed, but what it costs competitors to invest in platforms to do so, what the expected take rates might be, and what the business model therefore delivers, in financial terms, when most consumers rely on mobile service, and mobility drives total revenue and profit. 


The existence of strong cable competition in some markets necessarily limits the financial return any leading telco can expect from new FTTH deployment, and increases the risk of substantial stranded assets which produce zero return. 


In deployments to date, telco FTTH networks have struggled to exceed 40 percent take rates, which means 60 percent of the assets serving consumers are stranded. Conversely, only about 30 percent of cable assets typically are stranded. 


As always, the better mousetrap does not always win, assuming FTTH is deemed the better technology than hybrid fiber coax. The HFC upgrade path seems always to have been more incremental and more graceful (financially), as FTTH is “rip and replace.”


It remains true that for a legacy telco, FTTH remains a “better” technology choice than copper access. Whether it always is the better business decision remains the issue. 


Monday, November 8, 2021

Historic Shift of U.S. Internet Access Market Share is Coming

Though U.S. cable operators have steadily added to their installed base of internet access customers for two straight decades, at the expense of telcos, that might be on the cusp of significant change. 


Verizon, for example, seems to be taking share from Altice, despite that firm’s conversion from hybrid fiber coax to a fiber to home platform continues, and even as most of the footprint is offering gigabit levels of service. 


In some markets, independent FTTH providers also are gaining share. Tucows, which operates Ting Internet, has been getting market share.of about 31 percent where it chooses to build its symmetrical fiber-to-home networks. 


Coming next is an expansion of the addressable telco FTTH market, based on $65 billion in subsidies to be enabled by a new infrastructure bill passed by the U.S. Congress. 


The passage of an  infrastructure bill by the U.S. Congress means as much as $65 billion in support for broadband access across the United States. While the specific allocations are not yet available, that essentially means the business case for deploying fiber to the home--and other access platforms--is better by about that amount. 


The big implication is that the business case for deploying high-performance broadband networks will improve by a substantial margin, bringing millions of locations to the point where such networks are justified in terms of business case, where they had not been deemed feasible in the past. 


The obvious issue is where to prioritize the spending of money and for how many different types of platforms. As always, there will likely be an effort to award subsidy funds in a “platform neutral” manner, or largely so. 


George Ford, economist at the Phoenix Center for Advanced Legal and Economic Public Policy Studies, argues that about 9.1 million U.S. locations are “unserved” by any fixed network provider. 


Though specifics remain unclear, it is possible that a wide range of locations might see their deployment costs sliced by $2,000 or more. Lower subsidies would enable many more locations to be upgraded to FTTH, for example: not the unserved locations but possibly also many millions of locations that have been deemed “not feasible” for FTTH.


Much hinges on the actual rules that are adopted for disbursement. Simple political logic might dictate that aid for as many locations as possible is desirable, though many will argue for targeting the assistance to “unserved” locations. 


But there also will be logic for increasing FTTH services as widely as possible, which will entail smaller amounts of subsidy but across many millions of connections. The issue is whether to enable 50 million more FTTH locations or nine million to 15 million of the most-rural locations. 


Astute politicians will instinctively prefer subsidies that add 65 million locations (support for the most-rural locations plus many other locations in cities and towns where FTTH has not proven obviously suitable). 


The issue is the level of subsidy in various areas. 


“According to my calculations, if the average subsidy is $2,000 (which is the average of the RDOF auction), then the additional subsidy required to reach unserved households is $18.2 billio,” Ford argues. “If the average subsidy level is $3,000, then $22.8 billion is needed. And at a very high average subsidy of $5,000, getting broadband to every location requires approximately $45.5 billion.”


Such an extensive subsidy system would change the FTTH business model for all telcos operating in rural and even many urban or suburban areas. might affect cable operators and also could affect demand for all satellite and fixed-wireless operators. 


It just depends on the eligibility rules. 


Generally speaking, both AT&T and Verizon, where they offer fiber-to-home service, have been getting installed base a bit higher than 40 percent, in markets where they have been marketing for at least a few years. AT&T is hopeful it can, over time, boost share to about 50 percent of the market. 


Unless cable operators fail to respond, and that is highly unlikely, their installed base could  drop from about 70 percent to perhaps 50 percent if telcos adopt FTTH on a wide scale. That obviously leaves little room for third providers at scale, on a sustainable basis. 


To be sure, Ting Internet is “cherry picking” its markets, picking locations where it believes it has the best chance to gain share. 


Those typically are higher-income suburban areas where the main competitor, in terms of speed, is the cable operator, and where a telco remains wedded to copper access. Market share should be lower in areas where both the incumbent cable operator and telco offer gigabit speeds. 


In those markets, assuming pricing is relatively comparable, Ting’s advantage in part will rely on upstream bandwidth capabilities, at least where compared to the cable operator. 


It is harder to predict what might be the case in a decade, when telcos and cable operators alike might be offering access routinely in the gigabit to multi-gigabit ranges, possibly with upstream bandwidth high enough that return bandwidth is not an issue for nearly all customers, even if not fully symmetrical. 


To be sure, terms and conditions and general customer expectations about experience will matter. Internet service providers as a class do not score highly in the American Customer Satisfaction Index, for example. Whether specialist providers can do better, on a sustainable basis, is the issue.  


Brand name preferences and product bundling might also help the largest incumbents. According to ACSI, for example, in 2021 AT&T and Verizon both are ranked higher in customer satisfaction scores than any of the cable companies. 


That is surprising, especially for AT&T, which has not yet converted most of its plant to FTTH. The infrastructure bill is likely to accelerate AT&T deployments of FTTH, if it significantly changes the business case.


Saturday, March 11, 2023

Are FTTH Payback Models Sustainable? What's Good for Private Equity Might Not be So Good for Operators

Some of us would admit to being surprised at the payback models  for fiber-to-home deployments, the degree of business moat protection some believe FTTH offers, and therefore the value of such digital infrastructure assets, compared to other assets such as cell tower sites, data center or edge computing assets. 


Looking back over 25 years of business model assumptions, it is quite startling how much the underlying assumptions have changed. Subsidies now play a bigger role, offering in some cases a 20-percent to 30-percent reduction in capital investment in rural markets. 


On the supply side, though demand is not altered, private equity investment now means more capital is available to accelerate build timetables. 


But the most-shocking change are the revenue assumptions for consumer locations. These days, the expected revenue contribution from a home broadband account hovers around $50 per month to $70 per month. Some providers might add linear video, voice or text messaging components to a lesser degree. 


But that is a huge change from revenue expectations in the 1990 to 2015 period, when $150 per customer was the possible revenue target. In some cases, revenue up to $200 per home location was considered feasible. 


Expectations now hinge almost exclusively on consumer home broadband. 


“Our fiber ARPU was $61.65, up 5.3 percent year over year, with gross addition intake ARPU in the $65 to $70 range,” said John Stankey, AT&T CEO, of second quarter 2022 results. “We expect overall fiber ARPU to continue to improve as more customers roll off promotional pricing and on to simplified pricing constructs.”


Lumen reports its fiber-to-home average revenue per user at about $58 per month.


Recent presentations also have shown fiber-to-home home broadband average revenue per user of about $63. 


source: Frontier Communications 


Granted, most larger ISPs believe they can boost ARPU over time, by adding features, adding speed tiers and moving customers to higher-priced plans with higher usage allowances. 


Market share or installed base is the other huge assumption. Can most providers expect to get 20 percent take rates or as much as 50 percent? And what other assumptions about operating cost are necessary to create a sustainable business case at 20-percent share? 


Most incumbent telcos deploying FTTH have been able to get 40-percent market share after several years of marketing. But is a terminal rate around 40 percent to possibly 45 percent (or even 50 percent) reasonable in most cases? If not, where is that possible? 


On the supply side, capital investment benefits from government subsidies and to some extent infra cost declines, though construction costs are stubborn. So while some larger ISPs hint at per-passing network costs as low as $600, others report costs closer to $1,000 per passing, with connection costs of $550 to $600 per customer. 


Fiber Overbuild Costs

source: Matt Nicholson Lewis 


The point is that even with subsidies, lower infra gear costs and new investment sources, the demand expectations for consumer services have been slashed as much as two thirds over the past several decades. Many ISPs no longer expect revenue contributions from voice or entertainment video sources, and must build their demand models based solely on internet access. 


The largest ISPs might still expect some revenue contribution from voice or video services, but seem to be modeling higher expectations for business connectivity or contributions to mobile infrastructure cost models. In other words, the cost of small cell infra is aided by the consumer FTTH investment. 


Ultimately, we will see whether  FTTH really underpins a business that provides a competitive moat, while throwing off predictable cash flow. It seems more likely that private equity could succeed in transforming a legacy copper-based access business into a fiber access business, with a boost in equity multiples that will justify the effort.


That might well be a different question than asking whether FTTH really is a real estate or infrastructure asset on par with airports, toll roads, electrical and gas utilities. Much of the bet relies on limited competition. The argument that the first FTTH provider in a suburban or urban market gets 40 percent market share is likely correct. 


That has a reasonable chance of being correct even if two equally competent providers operate their own FTTH networks in a market. 


Some believe the first-mover advantage in a rural market could be substantial enough to support higher market shares. 


But it remains a valuable exercise to ask whether the FTTH business model is sustainable on an operational business on the revenue scales now being seen. 


That is a different question than asking whether a private equity buyer can boost multiples--and then sell the asset--by replacing copper access with optical fiber access. 


As a matter of operating economics, it still seems unclear whether FTTH networks generating only $50 to $70 per month in residential revenue are sustainable, assuming legacy provider cost structures. A small, lean upstart should have an easier time, as embedded costs are lower than those found at legacy firms. 


Sunday, January 8, 2023

Marketing Claims Aside, How Much Capacity Do Home Broadband Users Really Need?

How much internet access speed or usage allowance does a customer really need? It actually is hard to say. U.S. data suggests there are clearer answers about what customers expect to pay, which is about $50 a month, on average, even if some studies suggest wildly higher prices.  


source: Broadband Now 


Average prices are lower or higher than $50 a month, depending on what adjustments are made, such as adjusting for currency differences or cost of living differences between markets. Adjustments of that sort tend to show rather uniform global pricing of internet access, also adjusting for “quality” (speed, for example) differences. 


Also, any assessment should be based on service plans people actually buy, not posted retail prices for any particular tier of service. Bundle pricing adds another layer of complication. 


Internet service provider business models always require matching supply with demand; deployment speed and cost. What is needed to market effectively against competitors also matters. 


Time to market does matter. “It took us 22 years to pass 17 million households with fiber: 22 years,” says Hans Vestberg, Verizon CEO. “That’s how hard it is.”


“We basically had 30 million households covered with fixed wireless access in less than one year,” he also notes. 


So there is the trade off: rapid deployment of a lower-cost network versus slower deployment of a higher capacity network; wide coverage now versus higher capacity later; lower capital investment versus high. 


As typically is the case, wireless platforms can be provisioned faster than cabled networks, at lower cost. The Verizon data illustrates that fact. 


Cost also matters, as no internet service provider--especially those in competitive markets--can afford to spend unlimited sums on its infrastructure. Verizon and T-Mobile tout fixed wireless access in large part because they can afford to supply itt and can supply it fast, at lower costs than building fiber-to-home would cost. 


But marketing also matters: internet service providers do compete on the basis of speeds and feeds; do compete on price; do compete on perceptions of quality; terms and conditions and value. 


In that regard, even as home broadband speeds continue to rise, marketing claims are a battleground. Cable executives, for example, make light of fixed wireless as they claim it will not scale the way hybrid fiber coax and fiber-to-home can. FWA proponents argue that the platform does not have to scale as fast as FTTH or HFC to provide value for segments of the customer base. 


For example, even households that buy the fastest tiers of service rarely have a “need” for all that capacity. According to a survey by HighSpeedInternet.com, survey respondents say the “perfect plan” features a “610 Mbps fiber connection for $49 per month.”


In the third quarter of 2022, about 15 percent of U.S. households bought service operating at 1 Gbps, while 55 percent purchased service running from 200 Mbps to 400 Mbps. 


source: OpenVault 


The point is that, no matter what they tell researchers, U.S. home broadband customers do not seem especially eager to buy gigabit services at the moment, or services running at about half that speed. 


Speed demands will keep climbing, of course. But it does not appear, based on history, that most consumers will switch to buying the fastest tiers of service, or the lowest tiers of service, either. Historically, U.S. consumers have purchased internet access costing about $50 a month, with performance “good enough” to satisfy needs.


In fact, one might make the argument that is consumption (gigabytes consumed) that matters more than speed. Average data consumption stood at about 500 gigabytes per month in the third quarter of 2022, according to OpenVault. But the percentage of power users consuming a terabyte or more was growing fast: up about 18 percent, year over year, and representing about 14 percent of customer accounts. 


So speed claims are about marketing, as much as customer requirements. “It's turned into really a marketing game,” adds Kyle Malady, Verizon Communications EVP. ISPs compete on claimed speeds, even if there is little evidence most households require gigabit speeds at the moment. 


Beyond a certain point of provisioned capacity per user and device in any household, additional speed brings subtle if any benefits. Consumption allowances do matter, especially for households that rely on streaming for video entertainment. 


Nobody can give you a convincing answer why gigabit per second or multi-gigabit per second networks are required, beyond noting that multi-user and multi-device households need a certain amount of capacity if all are using the ISP connection at the same time. 


No single application, for any single user and device, requires a gigabit connection. So the real math is how much total bandwidth, at any moment, is needed to support the expected number of users, apps and devices in simultaneous use. 


For a single user or two, using one or two devices each, simultaneously, it is hard to see how a gigabit or faster connection is required. 


Some version of that argument--that a customer “does not need” a particular capability, is at the heart of much ISP marketing. ISPs whose platforms have some speed limitations point out that the limits do not matter for some customers, or that the price paid for higher-speed services does not provide value, commensurate with cost.


AI Will Improve Productivity, But That is Not the Biggest Possible Change

Many would note that the internet impact on content media has been profound, boosting social and online media at the expense of linear form...