We often hear, often without use of supporting data, that U.S. home broadband prices are high and speeds slow. When data is used, it most often is comparative to other countries. That can be done, with or without adjusting for purchasing power across countries.
As has been the case for other U.S. connectivity services, the United States does not typically rank “first” on such global comparisons. Any rank between nine and 15 would be expected. There are valid reasons for that, in substantial part due to the large percentage of the U.S. land mass that is lightly or uninhabited.
But there are other ways to compare prices. Consider general price levels and inflation, for example.
In one sense, we can note that U.S. price levels are “higher” for almost every category since 1950, for example.
Prices in 2022 are 11.77 times higher than average prices since 1950, according to the Bureau of Labor Statistics consumer price index. A dollar in early 2022 only buys about 8.5 percent of what it could buy in 1950. By the end of 2022 the dollar will buy less, as the inflation rate has exploded.

source: U.S. Bureau of Labor Statistics
So are prices higher in 2022 for virtually anything than in 1950? And, if so, would we really expect prices for home broadband to be “lower” in an absolute sense?
But you might object that internet access did not exist in 1950. So consider general U.S. price changes since 1996, when people were buying internet access. Since 1996, U.S. prices have increased almost fifty percent, accounting for inflation.

source: OfficialData.org
In other words, according to the U.S. Bureau of Labor Statistics, a unit of U.S. currency in 2022 buys about 52 percent of what it bought in 1996. Stated another way, price levels in 2022 are about 50 percent higher than they were in 1996.
So virtually any product can be accused of “costing more” in 2022 than it cost in 1996.
Some may intuitively feel this cannot be the full story where it comes to digital products. That hedonic change.
Hedonic qualIty adjustment is a method used by economists to adjust prices whenever the characteristics of the products included in the consumer price index change because of innovation. Hedonic quality adjustment also is used when older products are improved and become new products.
That often has been the case for computing products, televisions, consumer electronics and--dare we note--broadband internet access services.
Hedonically adjusted price indices for broadband internet access in the U.S. market then looks like this:
source: Bureau of Labor Statistics
In other words, dial-up internet access and gigabit broadband are not the same product. 64 kbps internet access is not the same product as 10 Mbps broadband. And 10 Mbps broadband is not the same product as gigabit or multi-gigabit home broadband.
In comparing digital prices over time, one must adjust for inflation and hedonic quality changes to really understand real prices.
This is an applied instance of Moore;s Law at work. The cost of computing power, for example, has continually dropped since 1940, for example.

source: Hamilton Project
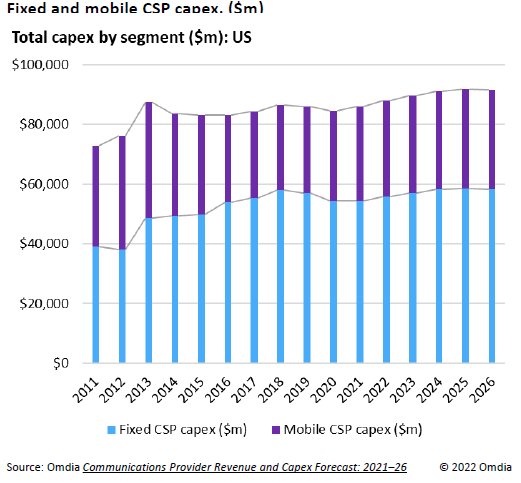
So has the cost of bandwidth seen hedonic changes and falling prices. Many will note the revenue per unit trends and cost per unit trends that are part of the capacity business.
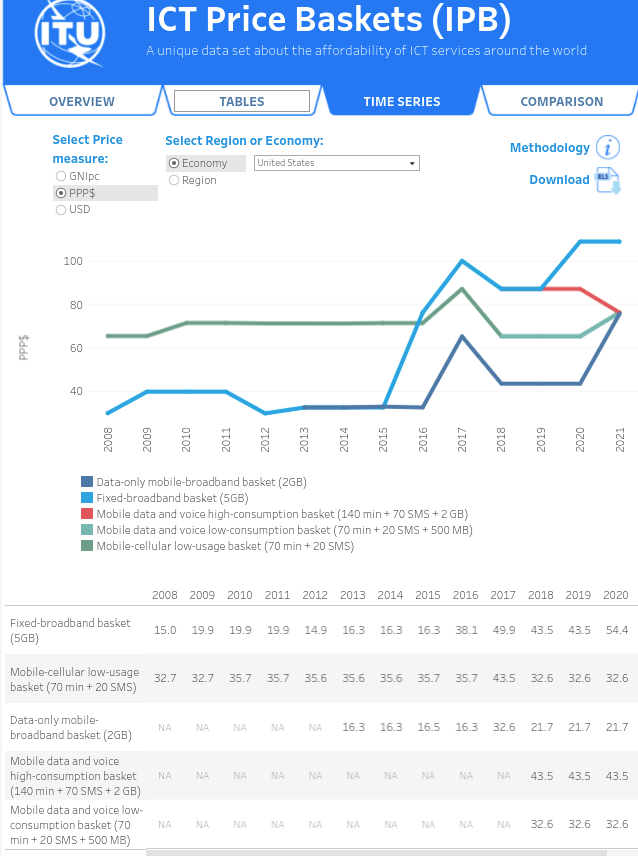
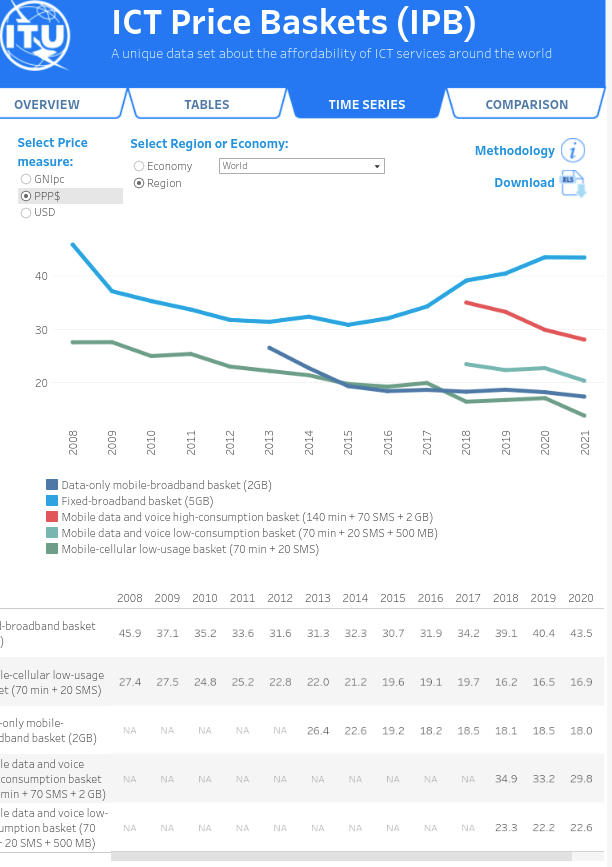
Compared to 2008, fixed network broadband costs have fallen, globally, though there is a slight rise in developed nations, driven by consumer preferences for higher-priced and higher-speed services, according to International Telecommunications Union data.
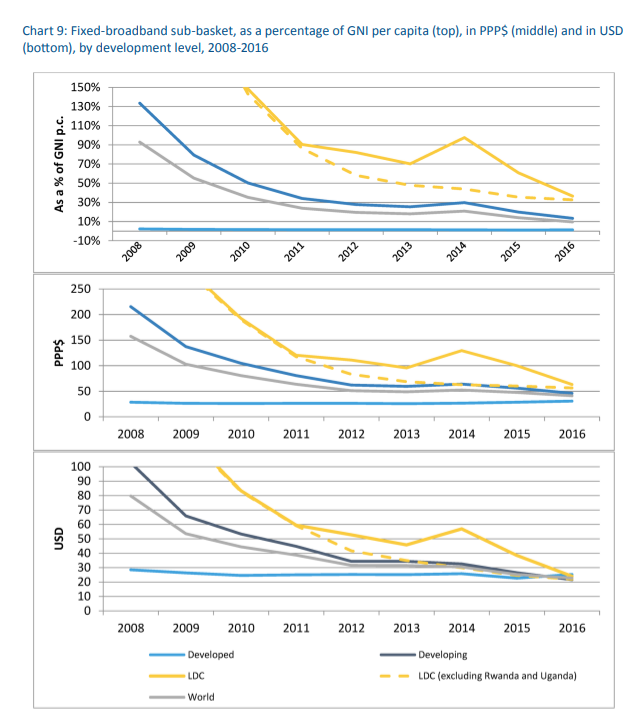
source: ITU
To be sure, most of the improvement has happened, since 2008, in developing countries. Prices in developed nations have been relatively low, and stable, since 2008.
But while prices have stayed essentially flat, speed and bandwidth consumption allowances have risen steadily. In real terms, and adjusting for hedonic changes, U.S. home broadband prices have dropped dramatically since 2017, according to Bureau of Labor statistics.
The point is that if all prices in the U.S. market have gone up since 1950, since 1996 or for any other time period, so would we expect prices for home broadband to rise, with the general change in overall prices.
It is possible to argue that even if home broadband prices have risen, the reasons are inflation--all prices are higher--or product quality changes (hedonic change) or consumer preference for different products (gigabit speeds rather than 100 Mbps to 300 Mbps).
A Tesla is not a Honda Civic. People pay more for the former than for the latter. But does that mean “car prices” have risen? Yes and no. Inflation drives prices higher over time. But when product differentiation is possible, consumers make different choices about what to buy.
A Civic owner who then buys a Tesla is arguably not buying the same product. When customers can buy a 100-Mbps service at the low end or 5 Gbps on the high end, “average” price is misleading.
Beyond that, which prices do we choose to compare? Do we analyze the services “most frequently bought?” Do we use posted retail prices or do we also include buying patterns that feature price discounts, such as product bundles?
Do we measure price per household, per user, per megabit per second, per consumption or something else?
If consumer demand shifts, how do we incorporate such shifts into the analysis? It is permissible to argue that home broadband prices “have risen.” It also is intellectually honest to admit that all prices have risen over time.
One may argue that U.S. prices are “too high.” But it is honest to explain “in relation to what?” Are we comparing a continent-sized situation to a small city-state? Or are we comparing a substantially-rural market to a highly-urbanized market?
In Canada, 14 percent of the people live in areas of density between five and 50 people per square kilometer. In Australia, 18 percent of people live in such rural areas.
In the United States, 37 percent of the population lives in rural areas with less than 50 people per square kilometer.
Put another way, less than two percent of Canadians and four percent of Australians live in such rural areas. In the United States, fully 48 percent of people live in such areas.
Coverage is an issue in such rural areas. About six percent of the U.S. land mass is “developed” and relatively highly populated. Those are the areas where it is easiest to build networks.
But about 94 percent of the U.S. land surface is unsettled or lightly populated, including mountains, rangeland, cropland and forests. And that is where networks are hardest to build and sustain.
That does not directly shape retail prices. But density does affect when and where sustainable networks can be built, even including government subsidies.
Are home broadband prices “higher” in 2022 than in 1996? A reasonable person could answer “yes” without also arguing prices are “too high.”