Showing posts sorted by date for query ftth cost fixed wireless. Sort by relevance Show all posts

Saturday, March 12, 2022

New Business Model Imperatives as Data Consumption Keeps Growing

For AT&T, once sustained data consumption per user approaches 250 gigabytes per billing period, FTTH economics get progressively better, since FTTH costs less to continually upgrade for higher speeds. 


source: AT&T 


As always, that assumption is based on AT&T’s total cost structure, the scale of its operations, capital structure and business model. Other internet service providers might have different options, for a longer period of time. 


That is especially true for some firms such as T-Mobile and Verizon that have no realistic opportunities to install FTTH nationwide, and whose prospects in the home broadband market are based on use of fixed wireless. 


Consumer willingness to pay, plus consumption profiles, do vary quite a lot. So for some, the issue is which segments of the market can be served by wireless, and which require FTTH. 


For T-Mobile and Verizon, the issue is how well, and how long, fixed wireless and mobile access platforms can  keep growing speeds and capacity fast enough to continue serving half the market. 


For cable operators the choices are how long to keep enhancing the HFC platform and when the switch to FTTH makes financial sense.


Friday, February 18, 2022

Mobility is the New Battlefield in War Beween U.S. Telcos and Cable TV Operators; Home Broadband the Current Issue

The U.S. cable industry has fared relatively better in the competition with telcos for at least some logical reasons, aside from arguable industry culture advantages. In the competition for fixed network voice and mobile services, cable has been the attacker, starting with zero market share and winning accounts from the incumbents. 


In home broadband, cable has benefitted from the relative slowness of telco adoption of fiber-to-home platforms. Simply, cable has leveraged its lower-cost hybrid fiber coax platform to radically boost performance at much-lower cost than telcos have been able to do. 


In video services, where cable was the incumbent, there was a slow attrition of some market share to telcos. The big share held by non-cable providers was in the hands of the satellite providers, and AT&T at one point owned all of DirecTV, immediately making AT&T one of the largest providers of linear video subscriptions in the U.S. market. 


That stake in DirecTV has been spun out to private equity group TPG, but AT&T retains a 70-percent interest in the venture. 


Still, terrestrial fixed network market share held by telcos was relatively small. 


source: Cable Compare 


In recent decades, competition between telcos and cable has shifted. Video share has remained relatively constant, with the overall market gradually shrinking. The fixed network voice market is declining, for all leading providers. 


Home broadband has emerged as the revenue growth driver. And while cable has held close to 70 percent of the installed base in that market, many observers--perhaps most--now expect telcos to take more share as FTTH becomes more common. 


Nationally, telcos have about 30 percent share of the home broadband installed base. The issue is how much additional share telcos can gain as they ramp up FTTH platforms and as 5G fixed wireless becomes a factor for Verizon and T-Mobile. 


All that likely means that mobility will become the new growth battlefield between cable and telco.


Saturday, February 5, 2022

Is New Thinking on FTTH Payback Models Required?

There is an increasingly-good argument to be made that take rates determine the payback from any fiber-to-home investment. Traditionally, that meant the percentage of homes passed by the network that had paying customers connected.  


There is an equally-good argument to be made that the payback analysis can no longer be developed solely on the basis of consumer revenues and networks “to the home,” especially when a service provider is supporting both fixed and mobility services. 


That tends to make a shambles of the conventional way of comparing access media and platforms (FTTH, hybrid fiber coax, fixed wireless, digital subscriber line upgrades, satellite). That made sense when the “home” was the driver of payback.


That makes less sense when the fiber distribution network is viewed as necessary for supporting the mobile network and a variety of low-latency use cases. 


Starting with 5G, and presumably intensifying with each coming mobile next-generation network, some of the value is derived from the backhaul network for mobility services. 


Additional revenue might be earned from edge computing, internet of things, “smart” cities,  private networks, and additional small business revenues. Those revenue streams can be wholesale and retail; direct or indirect. 


So the difference is that FTTH payback arguably is determined by the payback from fixed and mobility services (wholesale and retail) sharing use of the same infrastructure. 


Though it might still make sense to evaluate different “last mile” platforms on a fiber-deep distribution network (radio, copper or fiber as the last-mile connection), only fiber is deemed suitable for urban and suburban networks. A greater range of options applies for rural networks. 


This is far more complicated than once was the case, as it involves all revenues from all customer segments (enterprise; small and medium business; consumers); any kind of network (fixed and mobile) and any type of service (internet access, voice, apps and content, wholesale, edge computing, internet of things). 


To be sure, that means payback models might be quite different for integrated operators and mobile-only or fixed-only assets. 


“If the technology penetration rate decreases 60 percent, the cost per subscriber increases 278 percent,” said João Paulo Ribeiro Pereira of the Instituto Politécnico de Bragança, Departamento de Informática e Comunicações in Portugal. “However, if the penetration rate increases 60 percent, the cost per subscriber decreases 39,7 percent.


In other words, the cost of construction and bill of materials arguably no longer determines the payback model, at least in urban and suburban markets. 


It is take rates (penetration) that overwhelmingly shapes returns in such areas. On the other hand, construction arguably continues to dominate the payback model in rural areas


Beyond all that, equity value and deployment assumptions also have changed over the last few years, in at least some markets. Aside from the nuts and bolts of a customer payback model, the equity value of access networks has changed as institutional and private equity investors buy up access network assets as an alternative asset for portfolios. 


So FTTH is not only a platform for revenues, it also is a way of creating new equity value. At the same time, there is new thinking about how to leverage  joint ventures for new access infrastructure that trade some ownership for more outside investment in access infrastructure. 


In other words, telcos, cable companies, mobile service providers and independent internet service providers historically have preferred to own their own infrastructure, even in some markets where wholesale is the infrastructure model. 


But there is new thinking about accepting outside investment in exchange for a share of operating profits. 


Also, in some cases, assumptions about levels of government support also have changed, as more money is made available to speed broadband deployment. That effectively lowers investment hurdles and payback assumptions. 


The point is that our traditional ways of evaluating payback from optical fiber investments in access networks are changing. “Fiber to the home” does not quite capture all the value of a fiber-deep distribution network. 


Fiber to the small cell site; fiber to the colocation site; fiber to the enterprise; fiber to the small business and fiber to the home all are parts of the payback analysis. Beyond that, thinking about the financing and ownership mechanisms is changing. 


It might make sense to own less than in the past. It might be sensible to trade some revenue and profit for less exposure to capital investment. 


The takeaway is that our older payback models make less and less sense.


Saturday, January 22, 2022

$50 a Month for Speeds Between 100 Mbps and 200 Mbps is the "Sweet Spot" for U.S. Home Broadband

The “sweet spot” for U.S. home broadband is a monthly recurring cost around $50 and speeds between 100 Mbps and 200 Mbps, which is purchased by about half of all U.S. home broadband customers. 


Pricing by independent internet service provider Vyve Broadband shows the packaging reflecting buying patterns. The 200-Mbps package sells for $50 a month. The gigabit package, likely bought by about 11 percent to 12 percent of homes, sells for about $70 a month. 


The lowest tier offers 100 Mbps for $40 a month. 


source: Vyve Broadband 


It might seem curious, but the new payback analysis for home broadband using fiber to the home also is about $50 per customer location, at take rates close to $50 a month, according to AT&T.


For those of you who follow the payback models for FTTH, that is somewhat shocking, as models from 20 years ago would have assumed per-customer revenue closer to $100 to $130 per month, to make the model work. 


That the revenue assumptions have changed so much reflect secular changes (declining demand for fixed network voice and linear video entertainment) as well as changes in cost structure related to operating cost and capital requirements for home broadband as well. 


It also is noteworthy that T-Mobile’s 5G home broadband service is priced at $50 a month. Though T-Mobile no longer seems to emphasize “speed,” it had in April 2021 talked about speeds up to 100 Mbps. 


Verizon’s 5G fixed wireless has recently been repriced to $50 per month, with speeds up to perhaps 300 Mbps. 


All that tells you where the mass market demand is believed to exist. The packaging will change, of course, in terms of typical speeds and prices. "More speed for the same price" as well as "significantly faster speeds for a higher price" are the two trends that will likely remain in place.


Saturday, January 8, 2022

In U.S., Federal Funding Changes FTTH, Mobile, Fixed Wireless, Cable Business Case

Facilities-based access network business models are changing, and higher levels of government spending to bring down costs for networks in rural and other high-cost areas is among the reasons. The 2021 passage of an “infrastructure” bill by the U.S. Congress will reduce costs in several ways. 


The bill includes $42.45 billion in grants to states for broadband projects, which can range from network deployment to data collection to help determine areas that lack service. Not all of that money will build infrastructure, to be sure. But much will. And the plan allocates at least $100 million in funds to every state, with lesser amounts to U.S. territories. 

source: S&P Global Market Intelligence 


If the money is not wasted, the cost of adding new internet access facilities should fall. Also, additional locations could find they are upgraded to  increase connection speed. 


There also are provisions that will stimulate demand. The bill allocates $14.2 billion for consumption subsidies. To be sure, there have been subsidy provisions before. But the new bill widens eligibility for such subsidies. 


Included in the bill is a $30-a-month voucher to low-income Americans to pay for internet service.

This program replaces the temporary $50-a-month Emergency Broadband Benefit program that was part of efforts to sustain the economy during the period when work and schooling were mostly shut down,  offering less money monthly, but increasing the number of those eligible.


Another demand stimulation effort is the allocation of $2.75 billion for digital inclusion and equity projects, such as improving digital literacy or online skills for seniors.


Additionally, $2 billion was allocated  for rural broadband construction by U.S. Department of Agriculture, as well as another $2 billion for a Tribal Broadband Connectivity Program run by the National Telecommunications and Information Administration (NTIA). Both ideally will help create new facilities. 


The bill also allocated $1 billion to build "middle mile" infrastructure to connect internet service providers to internet access points.


Finally, $600 million was authorized for bonds to finance broadband deployment projects in rural areas.


All that amounts to stimulating demand and supply of internet access, ideally. Undoubtedly some of the money will be wasted. 


But that much additional demand and supply stimulation is going to change business models for the better in many cases, directly lowering the cost of building facilities and defraying consumption as well. 


That is among the reasons many telcos are boosting their spending on fiber to home projects, AT&T, Lumen Technologies and Frontier Communications among them, and why other firms such as T-Mobile and Verizon are dramatically investing in fixed wireless on a national basis. 


Business models are better on the demand side, while the cost of such facilities is lower on the supply side.


Friday, January 7, 2022

"Time" is an Important Variable for FTTH

Almost 40 years ago, an engineering vice president at a major connectivity provider quipped that “fiber is the future….and always will be.” The humor lay in the fact that deploying the “best network” requires a complicated assessment of what constitutes “best” for a particular contestant, at a particular time, with a particular combination of assets and constraints. 


We might note that the argument for fiber to the home as the ultimate solution has been “correct” for at least 50 years. But it also has not been the “best for my business today” for that same length of time, for every provider and in every geography, given the existing cost and demand curves. 


Today, the analysis is even more complicated by the change in demand. Where the business cases might once have been built on revenues from internet access, video entertainment services and voice, increasingly the fixed network business case is driven by consumer broadband and mobility plus enterprise use cases. 


"Cost per location" is one key input. But so is "expected revenue." "Cost per passing" and "cost per customer" as well as "revenue per passing" and "revenue per customer" also matter when competitive conditions prevail. The reason is that a great percentage of invested capital will be stranded, generating no revenue.


The payback model necessarily extends beyond FTTH to mobility platform support and enterprise and business communications demand. The traditional arguments about lower operating cost remain. 


Evaluators might agree, in principle, that fiber to the home is the ultimate “best” solution in some cases, while also insisting other choices continue to make financial sense in the immediate time frame and for some business models. 


Rarely, if ever, in the access portion of the connectivity or computing businesses is there one single solution that works “best” for all use cases and requirements. Instead, architects and business managers have to balance numerous values and costs.


Among them, “time” is an important consideration, even if not shown in the formal cost and performance analyses. Basically, this dimension boils down to the time value of money


Making 10 Gbps internet access speeds available “right now” when demand is at far lower levels can be the wrong business decision. Generally, internet service providers want to match performance to customer demand and willingness to pay. Raw performance is not the only issue. 


Platform choices often boil down to “what works for the next decade, in the context of our fundamental business model choices?”


In other words, it can make sense to choose a less-capable platform now because it boosts revenue upside and reduces risk, even if that platform is not the “ultimate” solution. 


Lumen Technologies now estimates a cost less than $1,000 per passing for FTTH, in a 16-state territory that is about 70 percent urban and suburban, after the sale of former CenturyLink assets in 20 states, for example, about half what such investments might have cost two decades ago, and perhaps a third of what might have been necessary 40 years ago. 


But what makes sense for Lumen or many independent internet service providers does not make sense for Starlink, Comcast, many rural ISPs, T-Mobile or even Verizon and AT&T, in some instances. Starlink’s value is based on applications suited to constellations of low earth orbit satellites. Comcast can still rely on hybrid fiber coax as a mainstay, if not the sole platform. 


And demand is better matched to facilities cost in many rural, mountainous and hilly or heavily forested areas using some platform other than FTTH. 


T-Mobile will focus on both mobile and fixed wireless. Verizon, especially, will rely on 5G fixed wireless outside its fixed network footprint. 


The point is that there is no contradiction between the belief that “optical fiber to the home is the ultimate solution” and the countervailing arguments that other platforms make more sense in the shorter term, in many geographies, by ISPs with different business models, capital investment constraints or business models. 

-------------------------------------


Tuesday, January 4, 2022

U.S. Population Density is a Bigger Problem Than Maps

Few observers, it seems, are completely happy with the state of home broadband maps. Some argue the maps distort availability by as much as 21 percent.  Others argue the degree of distortion likely is less than many believe, perhaps on the order of five percent, according to an analysis by George Ford, Phoenix Center for Advanced Legal and Economic Public Policy Studies chief economist.  


Others note that the lack of access to fixed network “broadband internet access” at a minimum of 25 Mbps is between five percent and six percent. If satellite access is included in the analysis then virtually all continental U.S. locations have access to service at 25 Mbps. 


Inaccurate maps are only part of the story, however. U.S. population density is quite thin across most of its geography. That directly affects the cost of building broadband networks, as hefty subsidies are required to reach the last one percent or two percent of remote locations. 


And the United States has a huge percentage of its land mass that is thinly settled, if at all settled. 


In Canada, 14 percent of the people live in areas of density between five and 50 people per square kilometer. In Australia, 18 percent of people live in such rural areas.


In the United States, 37 percent of the population lives in rural areas with less than 50 people per square kilometer.


Put another way, less than two percent of Canadians and four percent of Australians live in such rural areas. In the United States, fully 48 percent of people live in such areas.


Coverage is an issue in such rural areas. About six percent of the U.S. land mass is “developed” and relatively highly populated. Those are the areas where it is easiest to build networks. 


But about 94 percent of the U.S. land surface  is unsettled or lightly populated, including mountains, rangeland, cropland and forests. And that is where networks are hardest to build and sustain. 


Industry statistics often suggest coverage is far better than critics say. The reality is likely that the maps are faulty, but coverage is still far better than some believe. 


The Federal Communications Commission says 98 percent of U.S. homes have access to  internet access at a minimum of 25 Mbps and 84 percent subscribe. Critics say those numbers are inflated by bad maps. 


But one virtually never hears complaints that the leading U.S. cable companies do not, in fact, supply 500 Mbps (Charter Communications to 0gigabit internet access (Comcast) to nearly 100 percent of their customer locations. Add in Cox Communications and those three firms cover more than 75 percent of U.S. homes. Cox supplies gigabit access to 100 percent of its customer locations. 


Gigabit speeds now are available to more than 88 percent of all U.S. homes, according to the Federal Communications Commission. Other estimates peg the percentage of homes with cable high-speed access at 90 percent. 


One can disagree with the FCC statistics and still not quibble that cable operators generally do supply coverage within their franchise areas that is substantially at 100 percent and offering speeds between 500 Mbps and 1 Gbps. 


Consider rural telco networks. “Respondents to this year’s survey report an average of 4,467 residential and 469 business fixed broadband connections in service,” NTCA says, with an  average of 7,581 serviceable locations. 


Respondents report an average of 72 percent  of customers in their areas subscribe to a broadband service of some speed. 


“On average, three-quarters (75.0 percent) of serviceable locations are served by fiber to the home (FTTH) in 2021; this is an increase of 5.1 percentage points from the prior year’s survey, says the latest Broadband/Internet Availability report issued by NTCA says. 


An average of 15 percent of locations continue to be served via copper loops while fiber to the node (FTTN) is used to serve an average of six percent serviceable locations. Cable modems service 2.7 percent of locations, licensed fixed wireless 0.7 percent and unlicensed fixed wireless 0.6 percent of locations. 

source: NTCA 


As for maximum speeds 55 percent of locations can get speeds between 100 Mbps but less than 1 Gbps. Some 20 percent of locations have maximum speeds between 25 Mbps and 100 Mbps.


Some 10 percent of locations have maximum speeds between 10 Mbps and 20 Mbps. About 3.7 percent of locations get speeds below  10 Mbps. 


To be sure, the data is self reported. One might argue that firms that did not respond to the survey have coverage, speed or physical media attributes quite different from firms that did report. 


Still, coverage in rural areas might be less a problem that generally is talked about.


Thursday, November 18, 2021

Big Strategic Shift for FTTH?

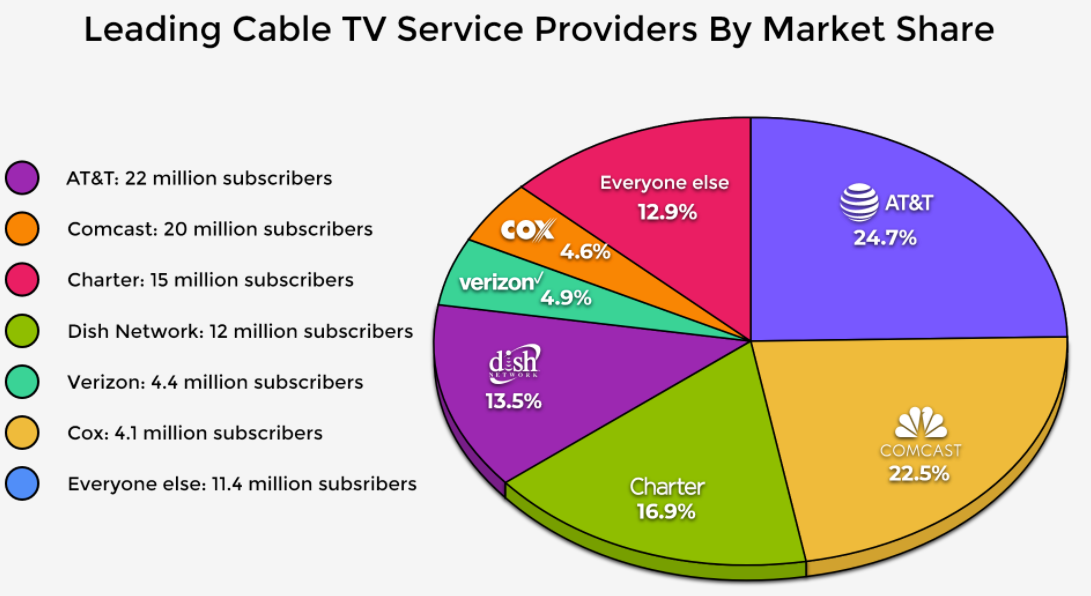
The strategic context for U.S. home broadband is evolving. For two decades, cable TV operators have been able to consistently maintain installed base share close to 70 percent, in most years getting the majority to all of the net new account additions. 


That remains the case in 2021, as cable continues to hold its installed base lead and also continues to win the net new additions battle.  


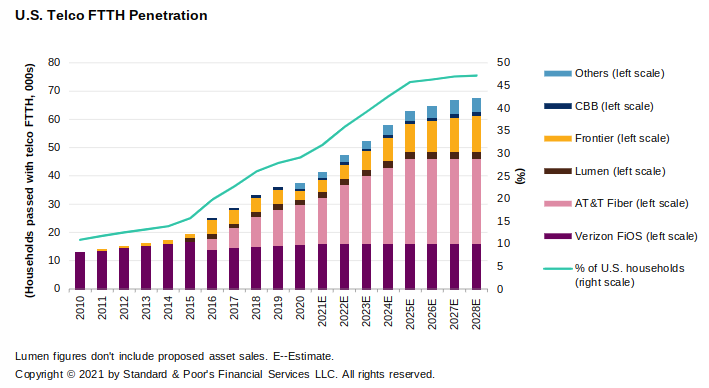
All that now seems set for change, though. The biggest change is an up- tempo pace of fiber to home conversions by telcos. But new 5G high-bandwidth fixed wireless offerings should claim some share as well. 


source: New Street Research 


Also important is the way some telcos are positioning their upgrades. In the past, they might have been content to match cable offers. Now some are aiming to surpass cable offers, with symmetrical upstream bandwidth a weapon.  


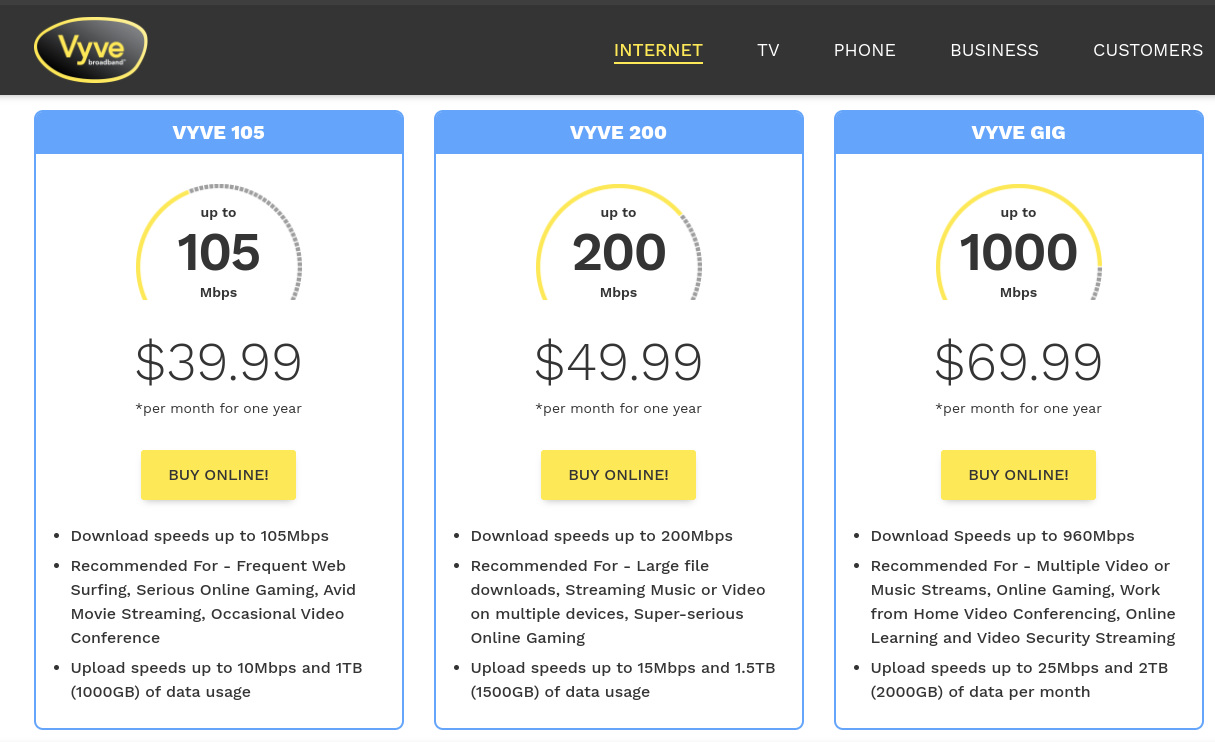
Frontier Communications, for example, is preparing rollout of a 2-Gbps offer, in addition to its standard 1-Gbps and entry-level 500-Mbps offers. That will likely feature symmetrical bandwidth. 


To be sure, cable is working on its own 10-Gbps capabilities, as well as methods to add more upstream bandwidth. But many of those solutions are not graceful upgrades from the existing hybrid fiber coax platform. The choice is whether to revamp HFC in significant ways or switch to FTTH as the replacement. 


More upstream bandwidth could be provided, to some extent, by pushing fiber deeper into the HFC network. Alternatively, cable operators can swap frequency plans, moving to mid-split or high-split designs. But all those moves require disruption of the physical plant, and cannot be accomplished by swapping out end user gear, as has been the case in the past. 


And any shift to fiber deeper networks, mid-split or high-split architectures (or two of the above) essentially delays an eventual shift to FTTH in any case, many would argue. So the decision comes down to “spend less now, but more in the long term, while undertaking a major network disruption twice” or “spend more now, and be done with it, and only disrupt operations once.” 


The larger point is that upgrading to FTTH comes with other choices that can confer advantage. Bandwidth can be symmetrical, or not. Bandwidth can top out at various levels: higher or relatively lower. And retail pricing, terms and conditions also make a difference. 


Much thinking now seems to be going into how to tweak those parameters to gain advantage over cable operator competitors. Many might assume FTTH means gigabit speeds. It does not. FTTH is physical media. Service providers still must decide how much bandwidth they want those networks to supply. 


Historically, FTTH might have meant speeds in the hundreds of megabits. Some U.S. FTTH networks installed in the mid-1990s to late 1990s offered speeds only up to 10 Mbps. User experience might be an order of magnitude less than advertised, however, even on FTTH platforms.  


What seems to be changing is a willingness to leverage FTTH to gain a speed advantage. 


“Our network is already 10-gig capable end-to-end, so we can carry on driving up speed tiers, as demand requires, in a very low-cost, very quick way, again, in a way that cable can't, says Nick Jeffery, Frontier Communications CEO. 


But that only matters if most Frontier customers can buy the service. 


“Our plan (is) to reach a total of five million fiber locations by the end of 2022 and 10 million locations by the end of 2025,” says Nick Jeffery, Frontier Communications CEO. 


Frontier has 15.2 million locations passed, so 10 million total FTTH passings means about 66 percent of the potential customer base would be able to buy FTTH services. 


Of course, a higher installed base does take time. “Our 2020 expansion cohort continues to show strong penetration of 30 percent at the 12-month mark,” says Jeffery, though noting that figure is based on a small sample. 


“For the overall build plan, we continue to expect a 15 percent to 20 percent penetration rate at the 12-month mark, and with penetration continuing to rise in subsequent years toward a terminal penetration of 45 percent,” he added. 


Government subsidies also are expected to improve the business case for FTTH and other high-speed services, as they are increasing substantially. 


George Ford, economist at the Phoenix Center for Advanced Legal and Economic Public Policy Studies, argues that about 9.1 million U.S. locations are “unserved” by any fixed network provider. 


Though specifics remain unclear, it is possible that a wide range of locations might see their deployment costs sliced by $2,000 or more. Lower subsidies would enable many more locations to be upgraded to FTTH, for example: not the unserved locations but possibly also many millions of locations that have been deemed “not feasible” for FTTH.


Much hinges on the actual rules that are adopted for disbursement. Simple political logic might dictate that aid for as many locations as possible is desirable, though many will argue for targeting the assistance to “unserved” locations. 


But there also will be logic for increasing FTTH services as widely as possible, which will entail smaller amounts of subsidy but across many millions of connections. The issue is whether to enable 50 million more FTTH locations or nine million to 15 million of the most-rural locations. 


Astute politicians will instinctively prefer subsidies that add 65 million locations (support for the most-rural locations plus many other locations in cities and towns where FTTH has not proven obviously suitable). 


The issue is the level of subsidy in various areas. 


“According to my calculations, if the average subsidy is $2,000 (which is the average of the RDOF auction), then the additional subsidy required to reach unserved households is $18.2 billio,” Ford argues. “If the average subsidy level is $3,000, then $22.8 billion is needed. And at a very high average subsidy of $5,000, getting broadband to every location requires approximately $45.5 billion.”


The point is that, compared to the business case 20 years ago, FTTH is better in a number of ways. Strategically, copper facilities simply are outmoded. Any fixed network operator clinging to that platform is destined for death. 


Financially, the older triple-play model--with its cost structure and complexity--now is out of favor. The new model is based on home broadband: the sole service for an independent ISP, and the growth driver for an incumbent telco. 


Oddly enough, the older justification for FTTH--that it allows telcos to support many services--now is eclipsed by the simple value of internet access. The value of the “do anything” platform still remains. 


Only these days the primary value driver for an incumbent telco or independent ISP is “access.” Voice or video entertainment might contribute additional revenue and value, but where there is a choice, new providers simply build on home broadband, leaving apps to be supplied by others. 


All that is a big potential change.


Sunday, October 10, 2021

What Has Changed for FTTH?

For more than two decades, U.S. cable operators have won the market share battle with telcos (net new additions) as well as the installed base battle (percentage of total customers). That appears poised to change, with telcos now believed to be possible installed base gainers. 


To accomplish that, telcos also would likely have to win the market share (net new additions) battle. We haven’t seen that in two decades (some might argue telcos never have won the market share battles) but it seems possible for the first time. 


So what has changed? Several things, probably. Some important tier-two telcos that had been capital constrained have now restricted to the point where they can afford to invest in new fiber-to-home facilities where they had not been able to, in the past. 


Tier-one suppliers also arguably have altered options. Verizon, which had largely halted FTTH deployments because of the business model, now sees different returns as a result of fiber deployment to support its 5G small cell deployments. One byproduct is a denser optical transport network that can change the incremental cost to provide FTTH. 


But market share or installed base can change in other ways directly related to that denser fiber transport footprint. In some cases, 5G fixed wireless can allow Verizon to gain share without full FTTH. If the issue is “bandwidth to the home” or “gigabit to the home,” then 5G fixed wireless might work, irrespective of the platform. 


AT&T has been deleveraging, and is the telco with the most room to upgrade its access networks to FTTH. 


source: Standard & Poors 


Lumen Technologies, on the other hand, recently divested itself of about half its total consumer access lines, to concentrate on its denser metro areas. 


It might seem paradoxical that perceptions of return from FTTH investment are higher than once was the case when three mass market services--each with high adoption--were possible with FTTH. With the decline of voice and linear video entertainment revenues, the fixed network business case for consumer services largely rests on internet access. 


Logically that should create a worse business case, as revenue mostly must come from a single lead application. But other parts of the revenue and cost model also are changing. Third party sources of funding sometimes are more lucrative (either from joint builds or bigger government subsidies). 


Divesting linear video reduces revenue, but also cost. Harvesting voice while concentrating on internet service provider operations might in some cases lead to lower operating costs. 


Also, though telcos failed to halt the slide in broadband market share over the last two decades, the growing need for more-symmetrical bandwidth now offers telcos a possible marketplace advantage over cable operators. 


Also, telcos increasingly are building models that rely on broadband for nearly all the financial return from a new FTTH build, based on steadily-improving efficiencies. Telcos with 5G backhaul networks now can leverage those other fiber transport investments to support consumer home broadband investments. 


Expectations about installed base share also help the new payback models. Where telcos once might have held only 30 percent share of the installed base, they now can reasonably expect to eventually take 50 percent share of the installed base, which changes the financial return


Up to this point the U.S. FTTH footprint has been rather modest. All together, telco FTTH probably today passes only about 29 percent of U.S. homes. That percentage will grow closer to half of all U.S. homes over the next five years or so. 


That still leaves telcos with a problem: they wil be able to sell FTTH-based gigabit services to only half of U.S. homes. What to do about the rest is the logic behind 5G fixed wireless. 


In 2021, for example, Comcast, the biggest U.S. cable operator, faced an FTTH competitor in less than 30 percent of its footprint. That obviously limits the amount of total share loss Comcast is exposed to, as cable trounces digital subscriber line platforms  in performance. DSL simply is not competitive with cable modem service. 


Then there are the strategic issues. Absent the upgrades to FTTH, can a fixed network service provider reasonably expect to remain in business? Increasingly, the answer is “no.” To the extent that internet access is the paramount driver of fixed network revenue, then FTTH either is installed or the telco faces bankruptcy. 


The argument then is not so much “we will make more money” as it is “we get to stay in business.” 


AI Will Improve Productivity, But That is Not the Biggest Possible Change

Many would note that the internet impact on content media has been profound, boosting social and online media at the expense of linear form...