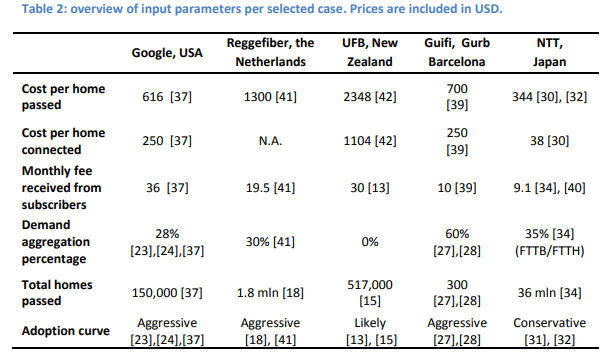
You might well question the payback model for new fiber-to-home networks which assume recurring revenue between $50 and $70 per account, per month, with little voice revenue and close to zero video revenue; take rates in the 40-percent range; and network capital investment between $800 and $1000 per passing and connection costs of perhaps $300 per customer.
But that is the growing reality. Among the reasons: higher government subsidies; indirect revenue contributions and a different investor base.
All that has shifted fiber-to-home business models in ways that might once have been thought impossible.
In the face of difficult average revenue per account metrics, co-investment and ancillary revenue contributions have become key. Additional subsidies for home broadband also will reduce FTTH deployment costs. All that matters as revenue expectations are far different from assumptions of two decades ago.
“Our fiber ARPU was $61.65, up 5.3 percent year over year, with gross addition intake ARPU in the $65 to $70 range,” said John Stankey, AT&T CEO, of second quarter 2022 results. “We expect overall fiber ARPU to continue to improve as more customers roll off promotional pricing and on to simplified pricing constructs.”
Mobility postpaid phone ARPU at AT&T was $54.81. According to some studies, fiber-to-home recurring revenue is lower than that. But AT&T appears to be taking market share from key competitors where it has deployed new FTTH facilities.
Different investors also are becoming important for access infrastructure. Retail connectivity providers are judged by their ability to generate cash flows, but hampered by the huge capital investments they must make to do so. Institutional investors, on the other hand, have longer payback horizons. They value the predictable cash flow just as much as do telcos, but can afford to be more patient on payback.
Ongoing reductions in operating costs and complexity also play some role in lower breakeven points for connectivity provider access investments. Also, government support mechanisms can reduce deployment costs by as much as 30 percent, in some cases.
Lumen reports its fiber-to-home average revenue per user at about $58 per month. For those of you who have followed fiber-to-home payback models for any length of time, and especially for those of you who have followed FTTH for many decades, that level of ARPU might come as a shock.
Though some honest--and typically off the record--evaluations by some telco executives 25 years ago would have predicated the FTTH business model as “you get to keep your business” rather than revenue increases.
Few financial analysts would have been impressed.
The theory was that upgrading to FTTH would allow incumbent telcos to essentially trade market share with cable companies: gaining video subscription market share from cable as cable took voice share. The assumption was that home broadband share would remain about where it was.
The thinking was that per-home revenue could range as high as $130 to $200 per month, even as overall market share was gained by cable and lost by telco providers.

So the business case remains challenging, and especially so in less-dense areas. The main point is that firms deploying fiber to home facilities must do so with radically-reduced expectations for ARPU.
In recent investor presentations, Frontier Communications has made three points about its prospects for revenue growth based on optical fiber deployments: the number of consumer broadband accounts; the number of businesses within 250 feet of existing fiber assets and the number of cell towers within one mile of Frontier fiber assets.
Recent presentations also have shown fiber-to-home home broadband average revenue per user of about $63.
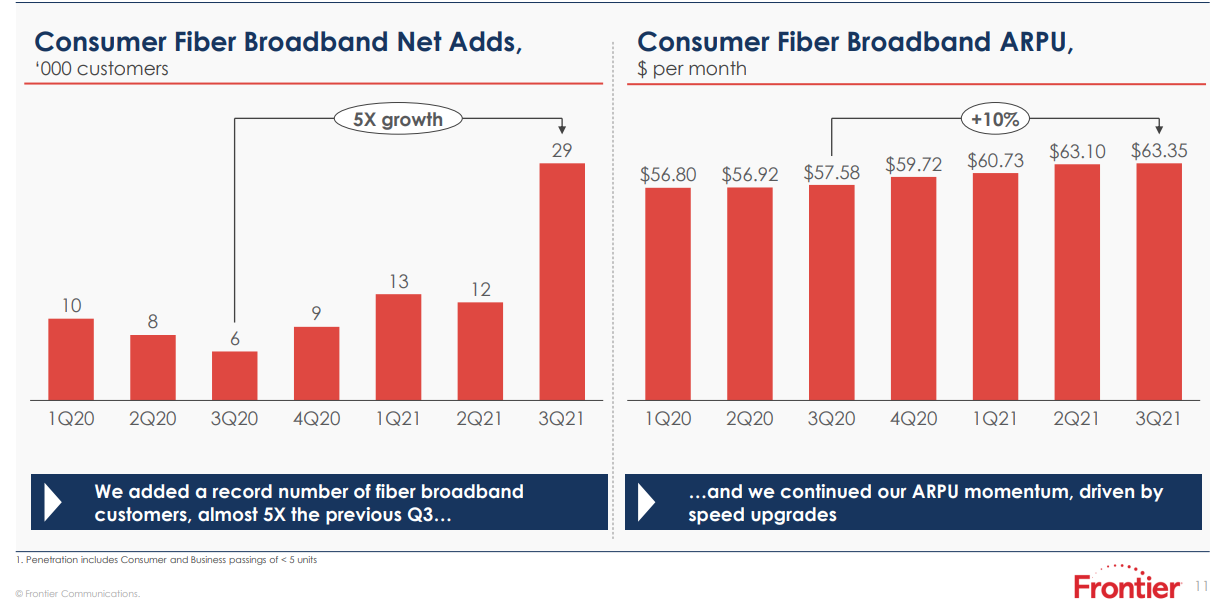
source: Frontier Communications
Two decades ago, the business model might have assumed far higher revenue per account. A telco or cable TV customer with a voice line generating $30 a month, plus internet plus video could have been worth about $100 a month in revenue.
Now Frontier says ARPU for an FTTH customer is about $63 a month. Assume that figure includes some amount of voice revenue and zero video revenue. The change in revenue expectation (not adjusted for inflation) per potential customer is roughly 40 percent lower than might have been the case in 1995.
Lower-density areas might only be upgraded with fixed wireless, though higher subsidy levels will increase deployment of FTTH in rural and lower-density areas.
For at least some observers, the change in FTTH business model asumptions is stunning.