Showing posts sorted by relevance for query mobile drives revenue. Sort by date Show all posts

Tuesday, October 25, 2022

The Lead Product Sold by Access Providers in 10 Years Might Not be Invented Yet

Some might think it is mere hyperbole to argue that connectivity service providers literallly must replace half their current revenue every decade. But that has historically been the norm in the competitive era of connectivity. To use the most-obvious examples, nearly all revenue and profit in the period before 1980 was earned selling voice. Does anybody think that is the case today?


Instead, globally, mobile service is what drives both revenue and revenue growth. On the fixed networks, internet access (home broadband) drives revenue, not voice. In developing markets, mobile subscriptions still drive growth. But in developed markets internet access is the revenue growth driver.


In the enterprise wide area networks market, X.25 once drove revenue, followed by frame relay. ISDN and ATM nver caught on. Now it is dedicated internet access, Ethernet transport or MPLS that are key revenue generators. And MPLS is being replaced by SD-WAN.


The colloquial way of expressing this is to say "my top revenue-producing product in 10 years has not been invented yet." Again, that might seem hyperbolde. But think about 4G, 5G and 6G. Each successive next generation network was introduced 10 years after the prior generation. And each successive generation displaced prior generation customer accounts,


Part of the reason for revenue change of that magnitude is product obsolesence. The other issue is declining average selling prices.


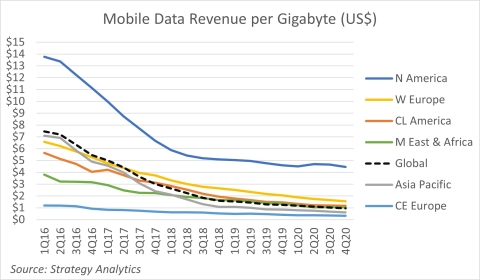
This graph of mobile termination rates--the fee a mobile network charges another network for completing an inbound call--illustrates a couple of principles relevant to the connectivity and computing industries. To the extent that computing costs are driven by chip-level capabilities that double about every 18 months, cost-per-operation drops over time. 


source: iconnectiv 


In other words, the cost of executing a single instruction or operation will fall rather sharply every decade, as they essentially fall by half every two years. In this example of mobile termination rates, costs fell from seven cents per minute to less than two cents per minute over a decade, or more than half--and close to three times--in 10 years. 


All other things being equal--such as holding traffic volumes steady--that means termination revenue would have fallen by close to three times, and clearly more than half, over that decade. In practice, since call volumes rose, the decline was likely less, in absolute terms. 


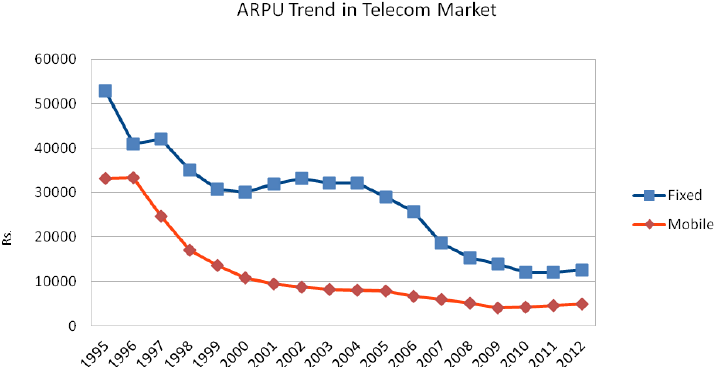
For example, the global number of mobile subscriptions grew about 52 percent between 2010 and 2019, so there were more people making mobile phone calls. But per-minute charges dropped faster, close to 100 percent lower in some countries. 


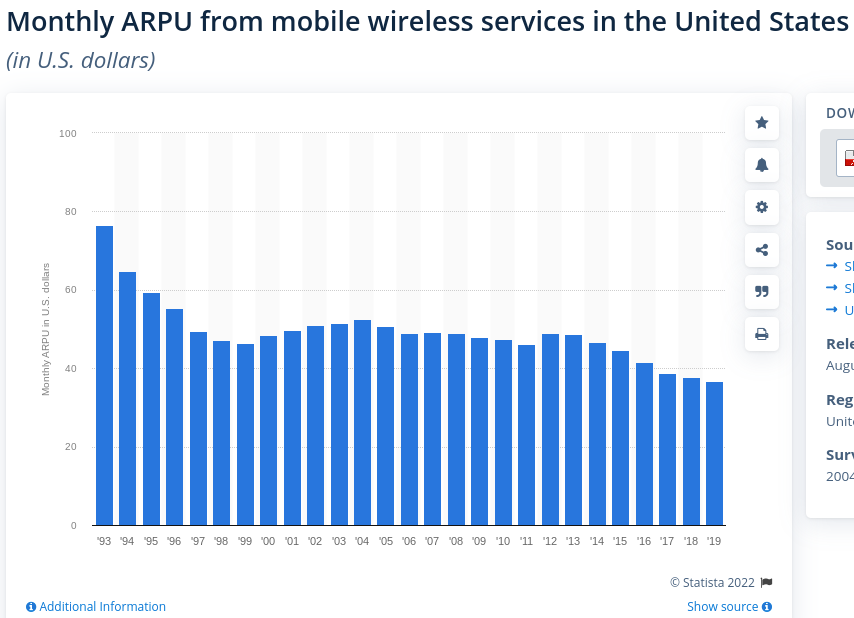
Other charges also declined. Between 1997 and 2022, for example, the cost of U.S. mobile 41phone subscriptions dropped by 50 percent. So the actual rate of decline for recurring service was not as fast as the decline of calling costs per minute. 


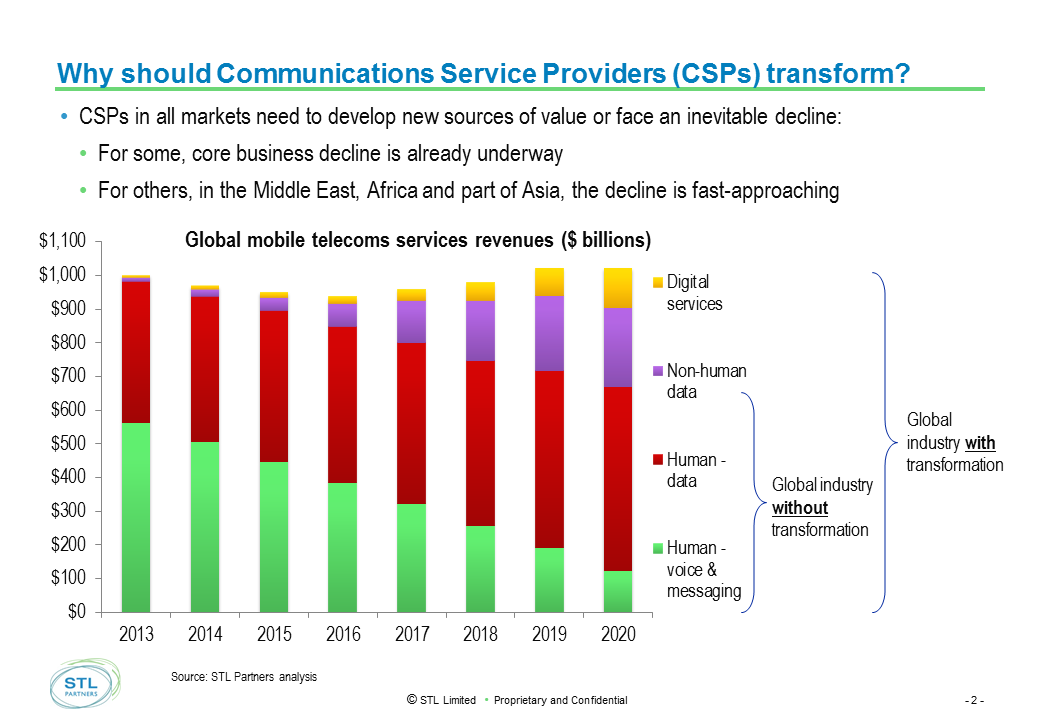
The actual change in revenue sources was complicated. Revenue was boosted by additional subscribers, replacement services (mobile internet access in place of voice and messaging) and higher possible usage in some cases. But revenue was diminished by lower average unit rates for subscriptions, calls and text messaging. 


That illustrates a second point about revenues in the connectivity business: about half of all current revenue earned by a service provider will be gone, every decade. That might sound like an exaggeration. It is not. How many service providers sell ISDN, X.25, frame relay or ATM anymore? At one time, each of those services was, or was supposed to be, a key driver of wide area network data revenues. 


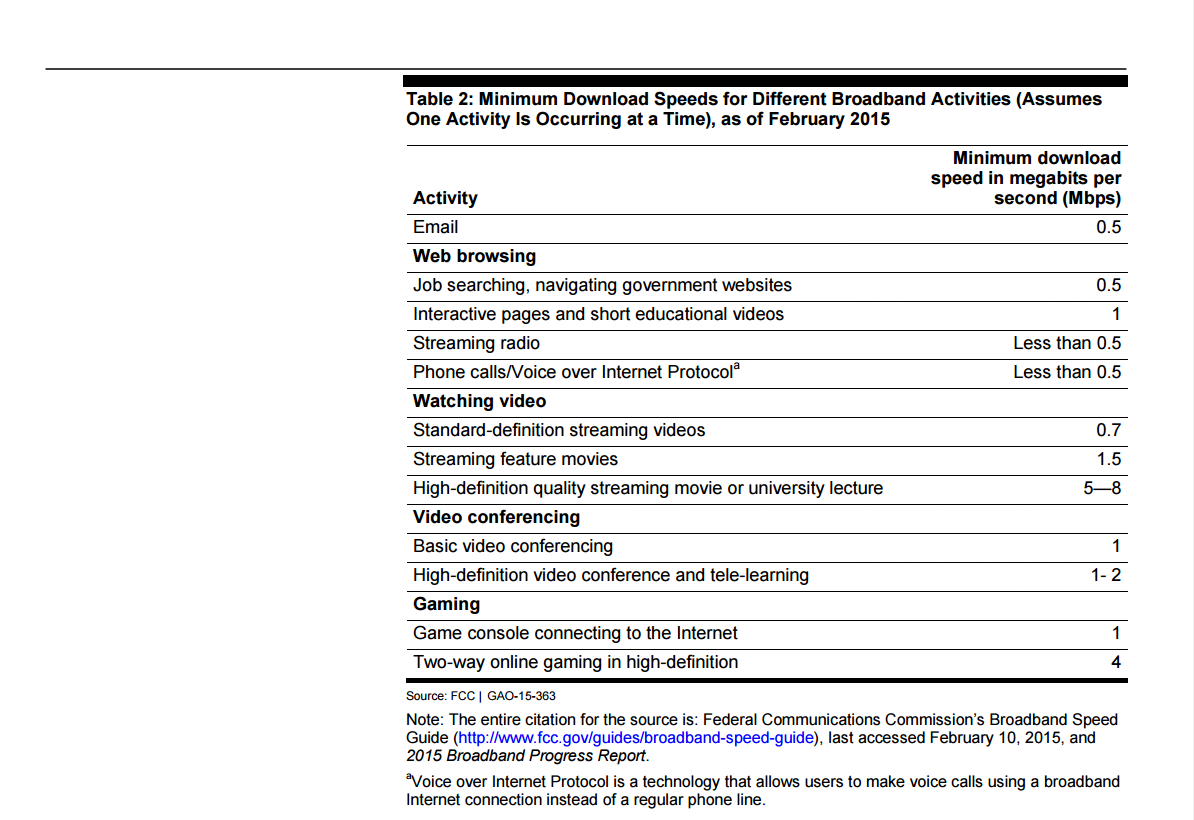
How many access providers sell dial-up internet access anymore? And, over time, what is the typical downstream package purchased by half of all customers? At one point it might have been 1 Mbps or less. At some point that changed to perhaps 10 Mbps, then 100 Mbps, then higher. The point is that in each generation, the “product” changed. 


International and national  long distance calling rates show the same pattern. 

source: FCC 


source: U.S. Department of Justice 


The general point is that revenue sources changed over that decade, as they tend to do every decade. 


In fact, calling revenues now are minor enough that it is difficult to find statistics on calling volume or revenue, as internet access now drives revenue models. 

Thursday, October 10, 2013

Peak Mobile Revenue in 2017?

Though it was not always the case, today’s communications service providers face a business that genuinely requires continual innovation. It matters not whether service providers are especially good at innovation, quick to move or have a clear glide path.

What matters is that we now know the global communications business lives or dies by lead revenue generators that clearly are products with a life cycle. And the industry already has seen enough to understand that from now on, the revenue underpinnings of the  business must be recreated about every decade or so.

To be clear, that means something like a need to replace perhaps half of existing revenue every 10 years or so, as first, one, then the succeeding revenue model matures. Fixed network voice is being displaced by Internet access as the foundational revenue driver.

Mobile voice displaced fixed network revenues as the global revenue driver. Then text messaging began to drive revenue growth. Now mobile Internet access  is driving growth.

And the only certainty is that more transitions are coming. The issue is to identify, as soon as possible, what those replacement products are, and bring them to market, in a scalable way, as soon as possible.

In 2018, for the first time ever, global mobile service provider revenue will drop, declining from 2017 levels by one percent or US$7.8 billion, according to analysts at Ovum, though the number of connections will continue to grow. That suggests 2017 could be the “peak” year for mobile revenues, unless big new sources can be found to both replace lost revenues and then ignite a new round of industry growth.

As has proven to be the case in the past, the issue is whether new revenues can be added fast enough to cover the declines in legacy products.

Global mobile connections will grow from 6.5 billion in 2012 to reach 8.1 billion by 2018, while annual mobile service revenues will rise from US$968 billion to US$1.1 trillion.

Decline already is happening in Western Europe, with total revenue dropping 1.5 percent on a compound annual rate and connections growing less than one percent, Ovum predicts.

The U.S. market, robust and growing, will slow. Global connections still will grow, at a less than four percent compound annual growth rate between 2012 and 2018, while global revenues will grow at less than half that rate.

Africa, on the other hand,  presents the largest growth opportunity, revenues expected to grow at a compound annual growth rate of 4.2 percent.

Since mobility services have driven global service provider revenue growth for at least a decade, current efforts to discover new sources of revenue obviously are required. The forecast assumes that the current growth driver, mobile Internet access, will saturate by about 2018.

“What drives revenue next?” is a question with no accepted answer, which is why so many initiatives are underway, ranging from mobile commerce and mobile payments to connected car, mobile video, home security, home automation, mobile advertising and other potential new sources of revenue.  

One reason you are hearing so much about the Internet of Things, or machine-to-machine services, is that selling mobile connections to enterprises selling services using sensor networks is one obvious way to tap new customers and activate millions of new accounts.

According to Ovum, operators in developed markets face particularly challenging times. Aside from troubles in Western Europe, several other developed markets will see year-on-year revenue declines in 2018, including the United States,  Ovum maintains.

Much of the revenue decline will be driven by falling average revenue per user, which will continue to decline across all markets by a 2.7 percent global CAGR between 2012 and 2018.

If you want to know why tier one service providers are so focused on new revenue sources, the Ovum data is one compelling reason.

The greatest average revenue per user decline will be in the Middle East, where ARPU will fall by a 2.5 percent CAGR.  

Despite the global trend, some growth opportunities will still exist, particularly in Africa, where revenues are expected to grow at a CAGR of 4.2 percent throughout the forecast, Ovum says.

No other region in the world will see revenue growth at a CAGR above three percent during the forecast period.

Select markets in Asia-Pacific and South & Central America will also drive growth over the next five years.

Africa will also have the fastest-growing connections, increasing at a CAGR of 5.6 percent between 2012 and 2018, and ending the period with just over one billion connections.

Growth in Asia-Pacific will slow, but this region will remain the biggest contributor of new connections, driven largely by China, India and Indonesia.  

Connections in the Asia-Pacific region will total 4.2 billion in 2018 and will account for 57 percent of net additions globally through the forecast period.

Wednesday, May 20, 2015

Internet Access Drives At Least Half of All U.S. Communications Revenue

Just what percentage Internet access now represents, as a percentage of total U.S communications service revenues, is a bit difficult to estimate. Internet access could represent a low of 33 percent of total industry revenue, or as much as 66 percent, depending on one’s assumptions.

U.S. consumers spent $100 billion on Internet access in 2013, according to the Government Accountability Office. That figure might include both fixed and mobile access, plus Wi-Fi and other spending. Other estimates suggest mobile data alone hit $90 billion in 2013, however.

In June 2013, there were 70 million fixed and 93 million mobile broadband connections with download speeds at or above 3 megabits per second (Mbps) and upload speeds at or above 768 kbps, according to the Federal Communications Commission.

Assume an average fixed access price of $40 a month, or $480 annual revenue, and a mobile average cost of $30 a month, for $360 annual revenue.

That would imply $33.5 billion in mobile revenue and $33.6 billion in fixed Internet access revenue, amounting to $67 billion in total revenue. Analysts who reach higher figures might use higher assumed recurring service rates.

But some have estimated there were 180 million Internet access accounts in service in 2013, more than the 163 million cited by the U.S. FCC. Assume 57 percent of the accounts were mobile, while 43 percent were fixed. That implies 102.6 million mobile accounts and 77.4 million fixed accounts.

Using the $480 annual fixed revenue per account, and $30 annual mobile account averages, in 2013 mobile Internet access might have generated $37 billion, while fixed access might have created $86 billion, for a total of about $123 billion.

So we might reasonably conclude that Internet access revenues, including mobile and fixed accounts was about $100 billion.

If 2013 U.S. communications service revenue was about $300 billion, then Internet access accounted for 33 percent of total revenue.

Some estimates peg industry revenue at higher levels, but the percentage of fixed and mobile revenue probably doesn’t vary much.  

Mobile revenue in 2013 was nearly $200 billion. Analyst Chetan Sharma estimates 2013 mobile data revenue at $90 billion, a figure that undoubtedly includes messaging revenue, in addition to Internet access.

Still, data services would have represented about 45 percent of mobile segment revenue.

Likewise, hIgh speed access accounted for half of fixed network revenue in 2013. As a rough rule of thumb, it would be reasonable to estimate that, by 2014, about half of all revenue on fixed and mobile networks was generated by Internet access sources.

Another inference one might make is that the greatest value of higher-speed access is supporting multiple users, not better experience for any single user. The most bandwidth-intensive application for the typical user is high-definition TV or other streaming apps, at 5 Mbps to 8 Mbps minimums.

Add in business segment revenues--always heavily weighted to capacity sales--and data services undoubtedly drive much more than half of all service provider revenue.


Saturday, July 17, 2021

For Most Telcos, Net Revenue Gain Comes not from 5G but Elsewhere

For the foreseeable future, net changes in telco revenue can happen only at the margin. Over the next decade, mobile operators, for example, will replace half their 4G accounts by 5G accounts. So the issue is whether average revenue per account stays the same; increases or decreases. 


Assuming at least a stable ARPA, the balance of revenue changes will come in fixed network services. And there the issue is whether new revenue sources offset expected losses in consumer and business service revenue. 


Keep in mind that revenue-neutral product replacement is necessary, but will not help telcos grow total  revenues. Product replacements only swap legacy revenue for new sources, as in the example of 4G accounts being replaced by 5G accounts. 


All things equal (operating costs; marketing costs; capital investment; revenue per account), swapping 5G for 4G results in zero net revenue gain. All revenue growth beyond zero must come in other areas. 


On a global level, revenues appear flat. But revenue contributors change substantially every decade. In fact, telcos routinely lose half of present revenues every decade. That seems unthinkable, but has happened. 


“Over the last 16 years we have grown from approximately 25 million customers using wireless almost exclusively for voice services to more than 110 million customers using wireless for mostly data services,” said Lowell McAdam, former Verizon Communications CEO.


It is an illustrative comment for several reasons. It illustrates Verizon’s transformation from a fixed network services company to a mobile company. But the comment also illustrates an important business model trend, notably that of firms in telecom needing to replace about half their current revenues every 10 years or so.


In the U.S. telecom business, for example, we already have seen that roughly half of all present revenue sources disappear, and must be replaced, about every decade.


According to the Federal Communications Commission data on end-user revenues earned by telephone companies, that certainly is the case.


In 1997 about 16 percent of revenues came from mobility services. In 2007, more than 49 percent of end user revenue came from mobility services, according to Federal Communications Commission data.


Likewise, in 1997 more than 47 percent of revenue came from long distance services. In 2007 just 18 percent of end user revenues came from long distance.


Though revenue attrition has been clearest for fixed network voice, the same process has been seen for mobile voice, text messaging, long distance revenues, mobile roaming and business customer revenues overall, in many markets. 


We can disagree about how much new revenue some communications service providers will have to create over a decade’s time, to replace lost legacy revenues.


If global telecom revenue is about $1.6 trillion to $2 trillion, and assuming about half the revenue is earned in mature markets, then the revenue subject to disruption ranges from $800 billion to $1 trillion.


Half of that represents $400 billion to $500 billion. That, hypothetically, is the potential amount of global revenue that might be lost, and would have to be replaced. The good news is that most of the replacement will come as 5G displaces 4G subscriptions. 


What is equally certain is that a huge amount of revenue from new services will be necessary, even if consumer purchases of Internet access--and replacement of 4G by 5G--happens.


One fundamental rule of thumb is that, in mature markets,  service providers must plan for a loss of about half of current revenue every decade or so. That might seem shocking, but simply reflects historical developments.


Nor is that rate of change unusual. In the digital consumer electronics business, it might not be unusual for an executive to predict that half the products that drive sales volume in 10 years “have not been invented yet.”


What is new for the telecommunication business is that product replacement now is a fundamental issue, even if for 150 years the only product was voice.


source: IBM

In 2001, in the U.S. market, for example, about 65 percent of total consumer end user spending for all things related to communications and video services went to "voice."


By 2011, voice represented only about 28 percent of total consumer end user spending.


Over that same period, mobile spending grew from about 25 percent to about 48 percent. Again, you see the pattern: growth of about 100 percent (losses of 50 percent require gains of 100 percent, to return to an original level,  as equity traders will tell you).


Video entertainment spending likewise doubled.


In the U.S. market, one can note roughly the same pattern for long distance and mobile services revenue. Basically,mobile replaced long distance revenue over roughly a decade.


At one time, international long distance was the highest-margin product, followed by domestic long distance.


That changed fundamentally between 1997 and 2007.


Over that 10-year period, long distance, which represented nearly half of all revenue, was displaced by mobile voice services.


In the next displacement, broadband is going to displace voice.


That is not yet an issue in some regions that still are adding mobile and fixed network subscribers, but already is an issue in most developed regions, where voice and messaging revenues already are declining.

Though some might continue to hope that higher Internet access revenues will offset voice and messaging revenue dips, the magnitude of voice revenue declines will be so sharp that in many markets, even additional Internet access revenues will be insufficient in that regard.


In fact, rates of revenue growth have been dropping in all regions since at least 2005, according to IBM.


At least so far, ability to fuel growth by extending service to customers with low average revenue per user will continue to drive revenue growth, even for legacy services, for a while. The only issue is when saturation is reached in each particular market.


When that happens, the same pressure on voice and messaging revenue already seen in mature markets will be seen in presently-growing markets.


Those changes can be hard to discern, as the top line obscures changes in revenue contribution from the largest sources. Voice, messaging and long distance services have fallen dramatically. Consumer fixed network usage of voice no longer drives financial results, its place taken by internet access (broadband). 


Mobility now drives growth in most markets, and especially the data services component of mobile revenues. Subscription growth still is highly meaningingful in developing Asia and Africa. 


source: Delta Partners 


Basically, 5G mostly prevents telco revenue from declining. It does not drive revenue growth. If we expect continued declines in fixed network voice, then broadband and other new services will have to be relied on for most of the growth, in most markets, by most operators. 


The lucky scenarios will happen when mobile-first operators actually are able to drive higher ARPA in the 5G era.


Wednesday, August 13, 2014

Are We in "Post-Productivity" Era of Communications? You Bet We Are

Are we in some real sense in a “post-productivity” era of communications, where the driving force for building and operating networks is entertainment? Yes, some of us might argue.

What drives traffic across the global backbone? Video. Globally, IP video will represent 79 percent of all traffic by 2018, up from 66 percent in 2013, according to Cisco.

What drives fixed network Internet access traffic at peak hours? Video. In fact, video drives as much as 63 percent of total traffic during peak periods.

What drives mobile network bandwidth? Video, which represented 53 percent of mobile network traffic in 2013.

Though consumed bandwidth is not identical to service provider revenue, the two are related. Over time, revenue for fixed and mobile networks will be driven by data bandwidth, primarily related to Internet apps, and Internet app traffic disproportionately will consist of video.

Uncompressed 4K video, for example, requires 9.2 Gbps per video stream. Not even a gigabit connection can handle video at such rates. Video encoded at 8K standards might require between 23 Gbps and 28 Gbps. Obviously, no app provider will stream at such rates.

But the dimensions of the problem are very clear: video drives video demand across all networks.

Looking at fixed network service provider revenue, managed video and Internet access revenue streams already are driven by video services and applications.

If AT&T succeeds in acquiring DirecTV, for example, video entertainment would be the single biggest revenue stream, followed by high speed access, itself increasingly used to support video consumption. Voice but be only the third biggest revenue contributor.

The revenue picture is different at Verizon, which earns half its total revenue from business customers. Video might represent as much as 35 percent of consumer revenues, but perhaps only 17 percent of total revenue.

If you wonder why AT&T seems far more interested in consumer video entertainment, revenue tells the story. Consumer video entertainment has much less impact on total Verizon results than video does for AT&T total revenue.

AT&T, for example, says that upstream traffic is growing at double the rate of downstream traffic, and the reason is uploads of photos and video to social sites. In other words, in addition to driving more downstream bandwidth demand, entertainment now also drives the need for more upstream bandwidth.  

Long Term Evolution networks, for example, will grow speeds by concatenating spectrum bands, as two South Korean mobile service providers will do by the end of 2014, enabling 300 Mbps top speeds.

T-Mobile US says it eventually will use 20 MHz by 20 MHz of bandwidth, enabling speeds up to 150 MHz for its LTE network.

The point is that global networks now are sized for video entertainment. Increasingly, many enterprise networks (especially networks operated by application providers with a high consumer video component) also are sized for video apps and services.

In that sense, we are well past the point where networks of all types are driven by “productivity apps” and uses. These days, entertainment video drives investment in networks, and increasingly, service provider revenue.

Friday, January 28, 2022

Mobile Operator Questions About 5G Payback Model Reflect 4G Experiences

Many in the mobile ecosystem ask the question “how will we make money from 5G? Fixed network operators have been asking themselves similar questions--"how do we get a payback from fiber-to-the-home?"--for several decades.


For mobile or fixed network operators, competition and changing demand make payback models uncertain and challenging. Where facilities-based competiton exists, the infrastructure cost per customer account always rises.


Stranded assets are the reason, though more an issue for fixed networks. In a monopoly market, the single provider might hope to get close to 98 percent take rates. In a competitive market with two equally-capable providers, each provider might hope to get 50 percent share of the installed base.


That effectively doubles the network cost per customer, as revenue is earned from about half of locations passed. In markets with three or more facilities-based competitors, cost-per-account increases more.


Demand changes also effect payback models. Fiber to the home once was underpinned by the assumption that there would be high demand for up to three services (voice, video and internet access).


As demand for fixed network voice and linear video subscriptions declines, the business model increasingly is built on home broadband. Voice and linear video help, but both are expected to keep declining.


But that has key revenue implications. Where a home location might have been expected to generate revenue of $80 to $200, the growing reality is that a location is expected to generate perhaps $50 in home broadband revenue, and then some amount of voice or other revenue from some locations.


Basically, revenue expectations--average revenue per customer or location--are effectively cut in half. That forces changes to the payback model on the cost side. Basically, costs must drop.


Those savings can come from intrastructure cost declines; operating cost drops; higher subsidies; lower maintenance costs; lower headcount and overhead or any combination.


The key point is that revenue assumptions for fixed networks increasingly are founded on lower gross revenue assumptions; revenue from additional sources; shared costs between mobile and fixed networks and more importance attached to defending market share or taking market share.


The parallel question asked by mobile operators--"how do we make money from 5G?--embeds some of the same issues faced by fixed network operators.


What the question likely means is less an uncertainty about revenue drivers and more a concern about the distribution of value within the ecosystem: will mobile operators reap a fair share of 5G benefits (higher revenue, higher profits, higher market share, lower operating costs)?


Looking only at consumer retail costs--exclusive of experience advantages such as higher speed; lower latency; new services or capabilities--it is not yet completely clear that average revenue per 5G account is higher than 4G ARPA.


5G has proven to generate higher ARPA in some markets, however.


It is a virtual certainty that 4G and older connections will be replaced by 5G. So the baseline for 5G revenue is 4G revenue. Beyond that, there is expected upside from private networks, network slicing (virtual private networks), edge computing and new enterprise connections to support internet of things use cases. 


To be sure, many wonder whether “we can charge more for 4G?” The long-term answer is not yet knowable, but the practical answer might well be “yes.” 


And that can be true even when direct tariffs for 5G are not that different, if different at all, from 4G tariffs. Some mobile operators do not charge a premium for 5G, but expect to gain market share, which drives higher 5G revenue.


Other service providers provide incentives for customers to use 5G but with a price increase coming in the form of unlimited usage. The actual driver of higher revenue per account is the shift to a higher-priced “unlimited usage” tier, not 5G as such, though such plans include 5G access at no extra charge. 


And though we have not seen it much, if at all, some mobile operators might decide to institute speed tiers for mobile service that mimic the ways access is sold on fixed networks. Customers might be offered lowest prices for lowest speeds; mid-tier pricing for mid-tier speeds and premium prices for the higher speed tiers. 


But there is another sense in which the question of “how will we make money from 5G?” can be understood.


Customers got value in terms of higher speeds when 4G was introduced. Mobile operators expected to sell more data, which would generate more revenues, and also create new services that would further increase revenues. 


But tough competition in many markets meant that mobile operators were not able to charge a price premium for 4G access. So the benefits went largely to consumers, according to ING analysts. “They got more data, better speeds and often paid less,” ING says. 


Governments also raised billions in revenue from spectrum auctions.


So one way of understanding the question about 5G revenues is the distribution of value and revenue for mobile operators within the 5G ecosystem. The downside for mobile operators is lower recurring revenues from 5G, compared to 4G. 


“Operators do not want to repeat these mistakes” seen in the transition from 3G to 4G, ING notes. But some might argue that the long-term trend will be difficult to break. 


source: Statista 


source: Strategy Analytics


source: Researchgate  


Taking market share, shifting customers to pricier accounts and increased usage charges are the immediate ways mobile operators have boosted 5G revenues over 4G levels. 


Longer-term pricing trends, though, might be difficult to change, as prices have been declining since 1996. 


On the other hand, the whole reason we see a next-generation mobile network about every 10 years, since 3G, is that capacity demand by customers keeps climbing. And while mobile operators can increase effective capacity using small cells and better radios, at some point an increase in spectrum is required. 


Also, as modulation and coding gets better with each successive generation, the cost to deliver a bit drops, allowing mobile operators to supply data consumption demand at lower costs. 


So another way to look at the payback model is to ask “what happens to your business if you do not upgrade to 5G?” Defending existing market share is a legitimate business outcome. 


Creating a more-efficient data network that supplies demand affordably also is an important business outcome. And to the extent 5G network capabilities are required to support dense internet of things networks, edge computing networks and network slicing, not investing in 5G forsakes any revenue opportunities in those areas. 


In many ways, that is akin to the value of fiber-to-home networks. In many cases, higher revenue per account is not expected. The business value instead comes from consumer market share gains, market share defense and the ability to compete in those markets. 


There is incremental value in terms of backhaul support for mobile small cell networks or business-grade services for smaller businesses. There is value in reduced operating expenses and possibly headcount. 


In other words, there are lots of ways 5G contributes to overall business value for mobile operators that go beyond direct tariff increases.


AI Will Improve Productivity, But That is Not the Biggest Possible Change

Many would note that the internet impact on content media has been profound, boosting social and online media at the expense of linear form...