Showing posts sorted by relevance for query new normal. Sort by date Show all posts

Wednesday, July 14, 2021

Why All Forecasts are Sigmoid Curves

STL Partners’ forecast for Open Radio Access Network investments--whether one agrees with the projections or not--does illustrate one principle: adoption of successful new technologies or products tends to follow theS curve growth model.


The S curve  has proven to be among the most-significant analytical concepts I have encountered over the years. It describes product life cycles, suggests how business strategy changes depending on where on any single S curve a product happens to be, and has implications for innovation and start-up strategy as well. 


source: Semantic Scholar 


Some say S curves explain overall market development, customer adoption, product usage by individual customers, sales productivity, developer productivity and sometimes investor interest. It often is used to describe adoption rates of new services and technologies, including the notion of non-linear change rates and inflection points in the adoption of consumer products and technologies.


In mathematics, the S curve is a sigmoid function. It is the basis for the Gompertz function which can be used to predict new technology adoption and is related to the Bass Model.


 I’ve seen Gompertz used to describe the adoption of internet access, fiber to the home or mobile phone usage. It is often used in economic modeling and management consulting as well.


Source: STL Partners


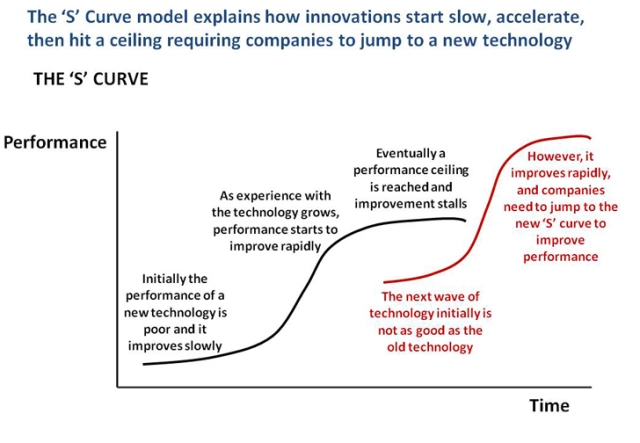
The following  graph illustrates the normal S curve curve of consumer or business adoption of virtually any successful product, as well as the need to create the next generation of product before the legacy product reaches its peak and then begins its decline. 


The graph shows the maturation of older mobile generations (2G, 3G) in red, with adoption of 4G in blue. What one sees is the maturing products are the top of the S curve (maturation and decline) while 4G represents the lower part of the S curve, when a product is gaining traction. 


The curves show that 4G is created and then is commercialized before 3G reaches its peak, and then declines, as the new product displaces demand for the old. 

source: GSA


Another key principle is that, successive S curves are the pattern. A firm or an industry has to begin work on the next generation of products while existing products are still near peak levels. 


source: Strategic Thinker


It also can take decades before a successful innovation actually reaches commercialization. The next big thing will have first been talked about roughly 30 years ago, says technologist Greg Satell. IBM coined the term machine learning in 1959, for example.


The S curve describes the way new technologies are adopted. It is related to the product life cycle. Many times, reaping the full benefits of a major new technology can take 20 to 30 years. Alexander Fleming discovered penicillin in 1928, it didn’t arrive on the market until 1945, nearly 20 years later.


Electricity did not have a measurable impact on the economy until the early 1920s, 40 years after Edison’s plant, it can be argued.


It wasn’t until the late 1990’s, or about 30 years after 1968, that computers had a measurable effect on the US economy, many would note.


source: Wikipedia


The point is that the next big thing will turn out to be an idea first broached decades ago, even if it has not been possible to commercialize that idea. 


The even-bigger idea is that all firms and industries must work to create the next generation of products before the existing products reach saturation. That is why work already has begun on 6G, even as 5G is just being commercialized. Generally, the next-generation mobile network is introduced every decade. 


source: Innospective


There are other useful predictions one can make when using S curves. Suppliers in new markets often want to know “when” an innovation will “cross the chasm” and be adopted by the mass market. The S curve helps there as well. 


Innovations reach an adoption  inflection point at around 10 percent. For those of you familiar with the notion of “crossing the chasm,” the inflection point happens when “early adopters” drive the market. 

source 


It is worth noting that not every innovation succeeds. Perhaps most innovations and products aimed at consumers fail, in which case there is no S curve, only a decline curve. 


source: Thoughtworks 


The consumer product adoption curve and the S curve also are related to the point at which early adopters are buyers, but before the mass market adoption starts. 


source: Advisor Perspectives 


Also, keep in mind that S curves apply only to successful innovations. Most new products simply fail. In such cases there is no S curve.  The “bathtub curve” was developed to illustrate failure rates of equipment, but it applies to new product adoption as well. Only successful products make it to “userful life” (the ascending part of the S curve) and then “wearout” (the maturing top of the S curve before decline occurs). 


Wednesday, July 13, 2016

In Access Business, Demand Won't Change Very Much; Supply Will. You Know What That Means

In addition to the possible issues (lower value, commodity status) caused by business model inversion, telco service providers also face further disruption on a range of other fronts.

We can assume high levels of competition for all current and future products and services that drive revenue, from traditional sources (other service providers) and new contestants (over the top app substitutes).

What comes next is likely additional forms of competition from non-traditional places, something that arguably can be seen in recent and expected developments in areas ranging from fifth generation (5G) standards to use of millimeter wave frequencies, use of unlicensed and shared spectrum, as well as moves to create more open source access platforms (Facebook OpenCellular, unmanned aerial vehicles, Google Project Loon).

Where in the past it was fairly easy to figure out “who the competition is,” it will be less easy to categorize in the future. Developments such as “network slicing,” for example, will allow app and service providers to buy attributes of networks that are optimized for the particular applications and business models those providers wish to offer.

In a functional sense, network slicing is a form of “wholesale access” to network features. It allows any enterprise or app provider to bundle network access and features with services and apps that drive the revenue model.

Spectrum sharing and unlicensed spectrum, plus new access platforms likewise represent new ways for all sorts of business models combining apps, services and then network access.

As all disputes over spectrum policy are rooted in perceived business advantage, so too are debates over shared spectrum and unlicensed spectrum.

That is normal. What is atypical is the vast potential amount of new spectrum to be made available in many markets, plus the unprecedented effort to create open source models and therefore costs across data center and now access platforms.

To some extent, all ISPs and access providers will benefit from lower platform costs. But that’s the rub: the same shift to lower costs that helps incumbents also enables new potential roles for attackers.

“Dumb pipe” poses the same sort of contradictory implications. On one hand, dumb pipe Internet access now drives revenue growth for mobile and fixed service providers alike, as traditional revenues earned from voice and messaging fall.

On the other hand, such commoditized access does not necessarily drive the same level of profits as the former managed services once did (though there is room for true argument on that score, at least for the moment).

The longer-term strategic issue is simply that there will be so much new spectrum, available at potentially lower costs, plus advances in access network platforms, that new competitors are expected. Adding more supply, in any market, has clear impact on demand. Just as clearly, lots of new supply has predictable impact on profits.

It is hard to see how the access business can avoid further commoditization.

Wednesday, May 25, 2022

Can IoT, Edge Computing, Private Networks Move the Service Provider Revenue Needle?

Estimates of annual global telecom service provider revenue vary by about $300 billion to $400 billion, from a low of about $1.4 trillion to a high of about $1.8 billion. Those figures typically are of little importance to most people inside and outside the industry, but are vital for analysts who estimate the importance of new revenue sources and markets. 


This matters, for example, when trying to assess the revenue contribution any new product might represent. Under normal circumstances, global service provider revenue grows by at a slow rate. Growth in the 1.5 percent range or less is the present status for the industry overall, though some markets and some companies see higher growth than the average. 


The point is that organic revenue growth can be as low as $20 billion to $30 billion in a typical year. So any new product that generates $20 billion to $30 billion in industry new revenue in any given year is a big deal.  


It is almost certain that global service provider revenues from multi-access edge computing, for example, will be in the single-digit billions ($ billion) range over the next few years. The same is true of forecasts of service provider internet of things revenue. The service provider 4G or 5G private networks revenue stream is likely to be small as well. 


The point is that new revenue sources such as edge computing, IoT and private networks are unlikely to move the global service provider revenue needle over the next several years, and perhaps not for a decade. 


Those revenues might be more important in a handful of markets, however, such as large countries that are early adopters. Even there, however, the large installed base of revenue means the incremental growth from the new services will make a generally slight contribution. 


In some part, the growth challenge is the result of the size of the installed base itself. 


When including the value of subscription TV services, the global telecom services market (mobile plus fixed) amounts to about $1.8 trillion in annual revenues, according to Precedence Research. The firm uses a cumulative annual growth rate of 4.85 percent from 2022 to 2030, a figure most observers would likely agree is too optimistic. 


source: Precedence Research 


Grand View Research estimates revenue in about the same range. But others, such as Analysys Mason, tally global revenue at a lower level. closer to $1.4 trillion


source: Analysys Mason


IDC forecasts are close to those of Analysys Mason, with 2021 revenue in the $1.5 trillion range. 


source: IDC 


As a rule, I have found the more-conservative figures are closer to reality. What matters is the impact new service sources could make.


Monday, November 29, 2010

Telstra Structural Separation Moves Ahead

Telstra will be structurally separated into wholesale network services and retail businesses as part of new legislation related to creation of a new National Broadband Network for Australia. As part of the new law, Telstra will sell its fixed-line access assets to the NBN as well.

Many practical details remain to be ironed out, and it is too early to make a firm judgment about how the structural separation will affect Telstra's market and financial position. But the separation ought to provide some evidence, over time, of how important "network ownership" is for a major tier one telco.

Generally speaking, most executives of tier one service providers continue to believe that access network ownership confers business advantage. Ownership means service providers can create more advanced facilities on their own accord, without the restriction of leasing only such capabilities as a third party might be willing and able to supply. Comcast is free to create and sell 50 Mbps broadband access connections whenever it wishes to, because it does not have to rely on a third party to create such features. Wireless providers can upgrade to fourth-generation networks on their own schedule, rather than waiting for third parties to build such networks.

Also, to the extent that a single network can be used to support multiple services (the whole idea between IP networks), ownership of a broadband access network allows creation and offering of many complementary services ranging from voice to entertainment video, business services and conferencing, for example.

Smaller competitors, on the other hand, frequently deem widespread wholesale access to be the underpinning for their business operations, since they cannot afford to build their own access networks on a widespread basis.

So at least in principle, the coming NBN ought to allow many more retail service providers to try and grab some share of the consumer and smaller business markets. In principle, that should lead to Telstra having less overall market share.

In June 2010 Telstra's share of the total Australian communications market was just over 60 percent, but virtually all observers expect Telstra's share to decline in 2011 and 2012.

Optus is perhaps the major contestant Telstra faces, as Optus has market share between 21 percent and 22 percent.  Vodafone and Hutchison have merged their Australian businesses and could be a stronger competitor as well. Optus has built and operates a number of hybrid fiber coax access networks in Australia and is not likely to decommission them, suggesting that Optus will use the NBN access facilities at some point to expand into new geographies.

Optus competes in the mobile segment as well, operating a wireless 3G network that reaches more than 97 percent of the Australian population.

Historically, one might argue, the competitive benefits of robust wholesale access have been most clear in markets where the former telecom monopoly represents the only fixed-network access capability in a region. One might argue that the benefits arguably are least when at least two strong facilities-based access networks exist in most markets.

Despite concern about Telstra's strong position in the market, its declining market share, across virtually every fixed-line and mobile service, suggests that the move to a NBN framework will not fundamentally change the Australian marke's dynamics. At least immediately, the NBN will spur many new entrants.

But communications always is a scale-dependent business. Over time, the normal market dynamic is for disparate smaller operators to combine in an attempt to gain more marketing scale. The NBN will not change that dynamic. One might predict an initial flurry of new entrants into the wireline markets, followed by a period of consolidation where market share concentrates in a smaller number of viable players.

Nor will the Telstra structural separation necessarily settle the argument about the strategic importance of access access ownership. One might argue that Telstra's retail unit's success now will be judged solely by its retail effectiveness, not the advantage of its network asset ownership. That will be true to some extent. The problem is that Telstra's market share has been declining for some time.

A continuation of that market share shift would not conclusively prove that access network ownership was important, and that Telstra "needed" those assets. At the same time, it is perhaps unreasonable to expect Telstra's market share to tumble without end.

At some point, Telstra's share should stabilize. That would not, in and of itself, "prove" that the access ownership ultimately was unimportant. In the U.S. market, where strong telco and cable competitors face each other in nearly every local area, the two players dominate consumer markets, roughly splitting new markets and gradually taking share in each others' legacy markets as well. There are a few markets where a third fixed-line contestant operates, but those scenarios are relatively rare, and no third provider typically has market share anywhere near what the local telco and cable operator have.

There are some market segments where a third provider has significant share. Satellite entertainment video provides one example. Also, looking just at the "voice services" market, mobile providers collectively have more than 50 percent voice market share, across all network access types.

read more here

Wednesday, March 25, 2009

Don't Assume A Return to Normal

There's a reason for voice, data and video entertainment providers to be obsessive about how their consumers are behaving during the current recession. Presenting a customer with a chance to switch, to change behavior, is dangerous because the changes, once integrated into daily life, can become permanent.

"Don't assume a return to normal," John Quelch, Professor of Business Administration at Harvard Business School, warns. "The longer and deeper the recession, the more likely consumers will adjust their attitudes and behaviors permanently."

"Their coping mechanisms may become ingrained and define a new normal." More than that, the competitive landscape likely will have changed as well. One would expect to see mergers, acquisitions, company failures and launches that mean the post-recession market looks different than the pre-recession market.

That means buyers might be looking at all product offers with new eyes.

http://hbswk.hbs.edu/item/6139.html

Wednesday, May 26, 2021

Though "Just Another G," 5G Already Enables New Revenue Sources

Oddly enough, both challengers and incumbents in the U.S. mobile market make the same argument: they are monetizing 5G right now, irrespective of new use cases and revenue sources. 


In Verizon’s case the actual revenue driver is not 5G as such, but a shift by customers to higher-priced unlimited-usage plans. 


“Our service revenue is growing all the time because we have this migration going from limited to unlimited premium,” said Hans Vestberg, Verizon CEO. “So, we are going to have the majority of our customers unlimited.”


In a sense, 5G is being monetized as part of the shift to higher-priced service plans. “Sometimes people ask about when will you monetize 5G?” said Vestberg. “We're already doing it” in the form of higher average revenue per user, driven by the migration to unlimited-usage plans. 


Beyond that, some mobile service providers believe they are better positioned to capture market share, or have better assets in place, and can simply introduce 5G using normal or relatively normal capex spending they invest annually. 


"One of the questions I've gotten for years as we planned this midband-centric 5G mobile Internet pure-play is, 'how are you going to monetize 5G?' And I've always thought it was kind of a crazy question because 5G is just the next G," said Mike Sievert, T-Mobile CEO. 


source: Bloomberg 


T-Mobile's equity valuation, for example, has far exceeded that of AT&T and Verizon, both of which have been seen as no-growth assets by investors. The reason is simply that T-Mobile can continue to grow without necessarily finding or creating new revenue sources. It simply has to keep taking market share. Cable companies are in the same position. Invention is not required.  


T-Mobile’s  merger with Sprint gave it a trove of 5G spectrum and other assets that arguably mean it will enjoy at least a temporary lead in 5G coverage and, soon, speeds across its footprint. And T-Mobile has been taking 4G share for years. 


AT&T and Verizon, on the other hand, have had to spend heavily to acquire 5G spectrum, and also face market share losses to T-Mobile and cable operators. That being the case, they need new revenue sources to justify that spending. 


So though there are two different ways of looking at 5G, the immediate boost in revenue from 5G is coming either from higher market share (T-Mobile) or higher ARPU (Verizon). 


The first view is that 5G, by design, will support internet of things and other ultra-low-latency applications that 4G actually cannot. The foremost defenders of that view tend to be infrastructure suppliers, for the simple reason that this argument tends to spur purchasing by mobile service providers. That is a longer-term potential source of growth. 


The second view is simply that mobile networks get upgraded about every decade, to support higher bandwidths and lower costs per bit, so the immediate advantage is simply lower cost per bit.


Mobile service providers tend not to want to talk about that so much, for the simple reason that investors never are too excited about capital investment that essentially is “maintenance” spending, rather than investment to capture new revenue sources. 


But lower cost per bit enables the “unlimited” offer, which leads to higher ARPU. Lower cost per bit also enables home broadband using the mobile network. So 5G, by enabling lower cost per bit, also makes possible home broadband services using the mobile network. 


In that sense, 5G enables fixed wireless for home broadband, a new revenue source.


Saturday, September 5, 2020

No "New Normal" for 5G Searches

One frequently hears these days that a “new normal” has been created by the Covid-19 pandemic; that “nothing will be the same” afterwards. That is not to deny either a “temporary” change in behavior nor a step change in many aspects of life and business, where it comes to underlying trends. 


We incontestably are behaving in different ways, partly the result of government mandates which are expected to be temporary. What happens after the pandemic is the issue. We should certainly expect a reversion to mean. Whatever trends were in place before the pandemic will reassert themselves, albeit from a higher level in many cases.


But that might not mean the rate of change changes very much. In fact, one might argue we already have seen this. This is a graph of Google searches for “5G.” Note the spike. That happened in March 2020 as many U.S. locations went into work-from-home and stay-home-from-school rules. 


We have to guess at why the surge in searches happened, then so quickly receded, but a reasonable guess is that people were looking for remote work support solutions. But the spike only lasted from the end of March to mid-April. Then interest backed off to levels higher than before, but on the prior trend line. 


As hard as it might be to envision, that is likely to happen with many business, economic and personal trends, post-pandemic, and after a few years. Consider “remote work.”


In the midst of the Covid-19 pandemic, statistics on remote work are impressive enough to convince many observers that a fundamental and permanent shift has been made. We will know in five years whether that is an accurate assessment, but we also have to remember that “remote work” includes many disparate activities, many of which do not substantially affect the amount of time people actually spend at work places. 


Work from home statistics often include actions such as “taking home some work from the office” (ranging from reading documents to correspondence management), working while traveling on business, unscheduled and episodic work from home, routine and planned work from home as well as permanent, full-time remote office or at-home workspaces.


Long-term trends in office space requirements, for example, typically depend on the amount of full-time, permanent basing at home locations, as well as permanent work-at-home for days per week or month. 


One issue is how many jobs theoretically could be done entirely from home. “We estimate that 56 percent of the U.S. workforce holds a job that is compatible (at least partially) with remote work,” say researchers at Global Workplace Analytics. That noted, pre-Covid-19, “only 3.6 percent of the employee workforce works at home half-time or more, the firm notes. 


Using every definition of work from home, including casual “take work home with you,” Gallup data from 2016 shows that 43 percent of the workforce works at home at least some of the time. So much hinges on the shift of the workforce to work from home at least 50 percent of the time.


 source: Global Workplace Analytics

Wednesday, October 1, 2008

AT&T Creates New Consumer Unit, Featuring "Everything"

AT&T is reorganizing its management, creating separate business units focused on customer segments rather than product lines, further illustrating the seriousness with which AT&T now views creating new kinds of services that transcend networks and devices. Part of the reason for creating a "consumer" services unit is that video, for example, now must be licensed, packaged and delivered across devices (TVs, PCs, mobile devices) and networks (wireless and wired). 

The reorganization should make easier the creation of new products that transcend network and device limitations, something AT&T is deadly serious about.

Wireless division CEO Ralph de la Vega now is in charge of all consumer offerings, including wireless, video in all its forms, broadband access and voice. Business services, infrastructure and diversified business are the other three major units.

The reason all of this ultimately will matter for virtually all contestants in the consumer space is that a company the size of AT&T, if successful, can reshape the consumer market and its expectations about what a "service" should be, how it should be packaged, what features such offers "should" feature, how much these features should cost and what payment methods and plans are part of the "new normal."

Thursday, June 6, 2013

"Unintentional" Market Disruption Now a Growing Possibility?

Market disruption arguably is a very different thing than “competition in a market.” The former often leads to radical reshaping of markets, typically “destroying” much of the former total addressable market revenue.

“Normal” market competition typically puts pressure on retail prices, and causes more market segmentation,  but is relatively incremental in its impact.

Even when the strategic approach is “same service, lower price,” most efforts at competition simply aim for taking some share away from existing providers.

Incumbents may not like competition, but market share shifts, margin pressure and other changes do not necessarily cause the overall market size to shrink.

On the other hand, deliberately disruptive assaults often have an indirect aim of literally destroying a market. The new issue is whether, in a world increasingly based on Internet forms of competition, unintentional market destruction can result, even when a competitor would rather “only” take some market share.

You might argue is more rational for an attacking firm to take the “same service, lower price” approach because that might stimulate overall market growth, even as it creates an opportunity for the new entrant to take market share from incumbents.

That was the tack taken by virtually all U.S. competitive local exchange carriers and is typical of U.S. cable operator assaults on the small business Internet access and voice markets.

Apple is unusual in that regard. It attacked legacy markets by providing a “better experience at a higher price.” That is relatively rare in communications markets, but well understood in many other markets such as automobiles and luxury goods of all sorts.

Still, the more common approach in the communications market is the strategy of “take market share by offering equivalent value at lower prices.”

Some assaults are deliberately disruptive, such as Skype’s attack on long distance calling, collaborative approaches to building networks such as Fon, Republic Wireless or FreedomPop approaches to the mobile business, Some might say SoftBank’s approach in the Japanese mobile market was intentionally disruptive in this sense.

Perhaps the new issue is whether disruption can occur even when market participants “only” want to protect or gain market share. One thinks of the U.S. long distance market, for example. It arguably never was MCI’s strategy to destroy long distance profits to the point where long distance ceased to be an independent product category.

But that is what happened.

More recently, Internet-based attackers have been more willing to radically disrupt pricing in markets, because radically-lower capital, marketing or operating costs make such assaults possible.
Perhaps the new issue is unexpected disruption of markets, when that was not intended.

It probably is true that most of the time, new entrants are viewed as representing only one more source of incremental competition, since the initial value proposition is quite limited, compared to that offered by the market leaders.

Of course, as now is well understood, attackers tend over time to add features and capabilities that make additional market segments take notice. Eventually there can be nearly head to head competition offered by the attacker, across market segments and price ranges.

The perhaps new angle is whether more markets are susceptible to unintentional disruption. SoftBank, for example, might originally only thought it could succeed in taking market share from other incumbents.

But one might wonder whether market disruption now is happening, whatever SoftBank originally thought it could achieve.


Tuesday, October 19, 2021

AI Impact on Outcomes Might be Hard to Measure

Quantifying the earnings impact of artificial intelligence is going to be as difficult as other relatively indirect measurements of information technology impact. Survey respondents almost always report that applied AI boosted revenue or sales, while reducing costs. 


Eventually, when there is enough deployment to study, we might find that, in some cases, AI has not measurably affected earnings, revenue or profits, at least in some cases. In at least some cases, we might even find that those metrics have gotten worse.


The reason is that the actual business impact of new information technology often is hard to assess, even if people think it is helping. When asked, managers almost always say they think AI has helped reduce costs and boost outcomes.

source: McKinsey 


Of course, those opinions often cannot be precisely verified. Even when cost decreases or revenue increases occur, there always are other independent variables in operation. For that reason, correlation is not necessarily causation. 


In fact, the impact of new information technology always has been difficult to measure--and sometimes even detect--over the last 50 years. This productivity paradox has been seen in IT since the 1970s, as global productivity growth has slowed, despite an increasing application of technology in the economy overall, starting especially in the 1980s. 


Basically, the paradox is that the official statistics have not borne out the productivity improvements expected from new technology.


Before investment in IT became widespread, the expected return on investment in terms of productivity was three percent to four percent, in line with what was seen in mechanization and automation of the farm and factory sectors.


When IT was applied over two decades from 1970 to 1990, the normal return on investment was only one percent. Also, the Solow productivity paradox suggests that applied technology can boost--or lower--productivity. Though perhaps shocking, it appears that technology adoption productivity impact can be negative.  


This productivity paradox is not new. Information technology investments did not measurably help improve white collar job productivity for decades. In fact, it can be argued that researchers have failed to measure any improvement in productivity. So some might argue nearly all the investment has been wasted.


Some now argue there is a lag between the massive introduction of new information technology and measurable productivity results, and that this lag might conceivably take a decade or two decades to emerge.


We might expect similar degrees of unclarity as artificial intelligence is applied in heavy doses. 


source: McKinsey 


Output and value added are the traditional concerns, but it is hard to estimate the actual incremental impact of new information technology. 


It is even harder in any industry where most of the output is “a service” that is hard to measure in a traditional output per unit of input way. Some say “value” and “impact” also matter, but those are squishy outcomes similarly hard to quantify. 


Services are, almost by definition, intangible. It often is nearly impossible to measure “quality” in relation to “price” in advance of purchase. Think about hiring any realtor, lawyer or consultant: “quality” cannot be measured until the actual service is consumed. 


And even then, especially for any infrequently-used service, there is no way to directly compare performance or value compared to other alternatives. 


Productivity is lower in services because they tend to be less standardized than goods and some of them have to be delivered in person,” researchers at the Organization for Economic Cooperation and Development have said. 


That services often are heterogeneous and ambiguous, requiring interaction between people, is a good way of characterizing the problem of measurement. 


The ability to standardize is often a precondition for applying IT to business processes. And some services must be delivered--or typically are delivered--”in person.” That makes scale efficiencies challenging. 


Services often are not fungible in the same way that physical objects are. 


To complicate matters, many services used today are supplied at no direct cost to the end user. While we might try to quantify productivity at the supplier level, there is not a direct financial measure related to end user consumption, as that is “free.”


For public organizations, the challenges are equally great. No single agency can claim credit for producing health, education, national defense, justice or environmental protection outcomes, for example. Those outcomes depend on many things outside the control of any single agency, or group of agencies. 


So we often resort to counting activities, occurrences or events, as the ultimate outcomes cannot be quantified. The issue, of course, is that knowing “how many” is not the same thing as “how good” or “how valuable?”


Knowledge work poses additional issues. Desired outcomes have even less routine content, higher capital intensity and higher “research and development” intensity.


Cloud Computing Keeps Growing, With or Without AI

source: Synergy Research Group .  With or without added artificial intelligence demand, c loud computing   will continue to grow, Omdia anal...