Showing posts sorted by relevance for query openvault. Sort by date Show all posts

Friday, August 20, 2021

U.S. Gigabit Take Rates Surpass Typical Inflection Point

Openvault says 10.5 percent of U.S. customers now buy home broadband service operating at one Gbps or faster.  Openvault says gigabit take rates have doubled since the second quarter of 2021, when 4.8 percent of households bought gigabit service. 


That is important because 10-percent adoption often is the inflection point for adoption of consumer products.


source: Openvault 


Perhaps more important, the “typical” speed plan purchased by consumers has continued to shift upwards as well. 


Openvault says 80 percent of subscribers have chosen a speed tier of 100 Mbps or faster, with more than half of them (47.5 percent) subscribing to a 100-to-200 Mbps tier.


In the first quarter, using a slightly different reporting method, Openvault said 80 percent of U.S. households were buying internet access at 100 Mbps or faster. 


The percentage of subscribers provisioned for speeds of 100 Mbps or less fell by half, from 39.9 percent in 2Q20 to 20.1 percent through the same period, says Openvault. 


The first quarter 2021 report showed 9.8 percent of U.S. households were buying gigabit or faster connections.


source: Openvault

Wednesday, May 13, 2020

How Big is 5G Fixed Wireless Opportunity?

Fixed wireless based on 5G might have very different economics than older fixed wireless networks, if firms such as Verizon and T-Mobile actually can supply fixed access using the same radio network as they are building to support mobility services. 


That is the same logic behind “multi-purpose” rather than “single-purpose” networks: sell multiple products using one network. Some early modeling suggested skepticism about the business model, but there was similar skepticism about the cost of 5G networks in general, which has proven incorrect, as 5G network capex is far lower than many feared. 


Basically, if the capital investment to support mobile 5G also can be used to support fixed access, using customer premises gear only, and with no modifications to the mobile infrastructure, then the incremental cost of fixed access is “success-based.” 


We have seen this before. The economics are similar to those of optical fiber business networks in business areas, where each additional customer is served by construction of a short lateral. Most of the capex is invested in the core access network, with only modest additional costs to connect new customers. 


source: Verizon


In past years, that would have seemed quite impossible. Mobile networks could not support fixed network bandwidths at comparable retail prices. In principle, that is possible when 5G uses millimeter wave, shared or unlicensed spectrum. 


Nor must 5G fixed wireless necessarily fully replicate fixed network speeds, as most customers do not buy the “fastest” tier of service. 


By the end of 2019, for example, just  three percent of customers tracked by OpenVault purchased gigabit per second internet access. Nearly four percent bought service at between 500 Mbps and 900 Mbps. Some 11 percent purchased service running between 200 Mbps and 400 Mbps. 


About 37 percent bought service operating between 100 Mbps and 200 Mbps, while 24 percent had services running between 50 Mbps and 75 Mbps. 


“Most” consumers buy plans with features, compared to price, broadly “in the middle” of available plans. “Most” buy neither the most-expensive nor the most-affordable plans; neither the “highest usage” nor the “sharply limited” usage plans. 


source: OpenVault

source: OpenVault


The point is that a 5G fixed wireless service can be pitched to “most” customers without having to supply the fastest expected fixed network speed. 


Looking at slightly-older data by OpenVault,  in the United States and Western Europe, about 1.85 percent of subscribers tracked by OpenVault buy gigabit-speed service.


Some 3.5 percent buy services running between 300 Mbps and 500 Mbps, while seven percent buy service at speeds between 200 Mbps to 300 Mbps.


About 65 percent buy services running between 50 Mbps and 150 Mbps, Openvault data shows. 


Most people are not power users, either. Perhaps 60 percent of internet users consume less than 250 gigabytes a month. Perhaps 34 percent consumer more than 250 GB but less than 1,000 GB per month. Perhaps four percent of users consume more than 1,000 GB per month. 


source: OpenVault


The market for 5G fixed wireless might be more attractive than many suppose, even if it does not routinely offer gigabit speeds.


Thursday, November 12, 2020

U.S. Gigabit Take Rates Pass 5% for First Time

The percentage of U.S. fixed network broadband subscribers buying gigabit-speed connections surpassed five percent for the first time in the third quarter of 2020, reaching 5.6 percent, according to Openvault. That represents an increase of 124 percent from the third quarter of 2019, when take rates for gigabit services were 2.5 percent.


Gigabit service take rates reached 4.9 percent in the second quarter of 2020, says Openvault. Compare that to availability of gigabit services, which reach at least 80 percent of U.S. homes, counting only cable TV service provider facilities.


source: Openvault 


On the other hand, buyers of service at 10 Mbps and below also increased by 41 percent,  from 4.1 percent to 5.8 percent, quarter over quarter, Openvault says. “Growth at the lower end tier may be pointing to subscribers looking to save money with lower end, lower cost broadband tiers,” Openvault says.


Openvault says the “average” U.S. household (no idea whether this is median or mean) uses 384 GB per month, with average speeds downstream of 170 Mbps, upstream of 13 Mbps. 

source: Openvault

Half of all customers buy services providing downstream speeds between 100 Mbps and 400 Mbps. Nearly 30 percent of U.S. customers buy internet access at speeds ranging from 20 Mbps to 75 Mbps.

So it remains fair to say that there is a big difference between speeds consumers can buy, and speeds they actually do buy. Supply is one matter; demand another.

Wednesday, May 13, 2020

Most Consumers Buy Service Plans "in the Middle" of Offers

By the end of 2019, nearly three percent of customers tracked by OpenVault purchased gigabit per second internet access. Nearly four percent bought service at between 500 Mbps and 900 Mbps. Some 11 percent purchased service running between 200 Mbps and 400 Mbps. 


About 37 percent bought service operating between 100 Mbps and 200 Mbps, while 24 percent had services running between 50 Mbps and 75 Mbps. 


“Most” consumers buy plans with features, compared to price, broadly “in the middle” of available plans. “Most” buy neither the most-expensive nor the most-affordable plans; neither the “highest usage” nor the “sharply limited” usage plans. 


source: OpenVault

source: OpenVault


Looking at internet service provider data generated by OpenVault in the United States and Western Europe, about 1.85 percent of subscribers tracked by OpenVault buy gigabit-speed service.


Some 3.5 percent buy services running between 300 Mbps and 500 Mbps, while seven percent buy service at speeds between 200 Mbps to 300 Mbps.


About 65 percent buy services running between 50 Mbps and 150 Mbps, Openvault data shows. 


Most people are not power users, either. Perhaps 60 percent of internet users consume less than 250 gigabytes a month. Perhaps 34 percent consumer more than 250 GB but less than 1,000 GB per month. Perhaps four percent of users consume more than 1,000 GB per month. 


source: OpenVault


Monday, September 26, 2022

Many Power Users Among Low-Income "Home Broadband" Households

Life often is more complicated and surprising than any theory can predict. Consider home broadband consumer behavior. Consider a recent analysis by Openvault, of “low-income” home broadband households using subsidy programs.


“Broadband usage patterns of participants in the FCC’s Affordable Connectivity Program are significantly exceeding those of the broader connected population,” according to Openvault. 


Launched in January 2022, the ACP provides low-income households with a $30 per month ($75 for tribal households) subsidy that can be applied towards a monthly internet subscription. 


One might guess that low-income households would sign up for a value package, perhaps often a 100-Mbps connection that might, with the $30 subsidy, be almost--or actually--free. That might also suggest that total household consumption would be lower than usual, simply because speed tends to correlate with total data consumption. 

source: Openvault-+


But Openvault suggests that often is not the case. ACP participants’ median usage of 499.3 gigabytes per month is almost 60 percent higher than the median of 313.9 GB per month for all subscribers, Openvault says.


ACP participants are 36 percent more likely to be power users of 1 TB or more, and 52 percent more likely to be super power users of 2 TB or more, Openvault notes. Also, ACP participants’ average usage of 654 GB per month is 33.3 percent higher than the average of 490.7 GB for all subscribers.


There is a fairly simple reason for such data. The ACP can be used by college students. Younger users and college students tend to be heavier consumers of internet data. Eligible participants include people who:


  • Received a Federal Pell Grant during the current award year;

  • Meets the eligibility criteria for a participating provider's existing low-income internet program;

  • Participates in one of these assistance programs:

    • Free and Reduced-Price School Lunch Program or School Breakfast Program, including at U.S. Department of Agriculture (USDA) Community Eligibility Provision schools.

    • SNAP

    • Medicaid

    • Housing Choice Voucher (HCV) Program (Section 8 Vouchers)

    • Project-Based Rental Assistance (PBRA)/202/811

    • Public Housing 

    • Supplemental Security Income (SSI)

    • WIC

    • Veterans Pension or Survivor Benefits

    • or Lifeline;

  • Participates in one of these assistance programs and lives on Qualifying Tribal lands:

    • Bureau of Indian Affairs General Assistance 

    • Tribal TANF

    • Food Distribution Program on Indian Reservations

    • Tribal Head Start (income based)

    • Affordable Housing Programs for American Indians, Alaska Natives or Native Hawaiians


That list includes some people and households most people would consider “low income.” But it also includes college students who are only temporarily “low income.” They also are more likely to be “power users.” 


The data do not preclude, however, the notion that many low-income households might be using the subsidies to buy higher-speed service, whether those customers are students, the eldersly or others with low income.


Wednesday, May 13, 2020

3% of Consumers Buy Gigabit Internet Access Service

Median monthly usage by broadband subscribers in 2020 is on a trajectory to surpass 250 GB for the first time, according to the OpenVault Broadband Industry report. 

By the end of 2019, nearly three percent of customers tracked by OpenVault purchased gigabit per second internet access. Nearly four percent bought service at between 500 Mbps and 900 Mbps. Some 11 percetn purchased service running between 200 Mbps and 400 Mbps. 

About 37 percent bought service operating between 100 Mbps and 200 Mbps, while 24 percent had services running between 50 Mbps and 75 Mbps. 


A 24.4 percent  increase in average provisioned speed, from 103.1 Mbps to 128.3 Mbps, in 2019 was slightly outpaced by a 27.3 percent  increase in average consumption, from 270.2 GB to 344 GB, OpenVault says. 

A median usage of 250 GB would represent a 24.9 percent increase from the 2019 median of 190.7 GB, OpenVault says. 

In late 2018, perhaps 1.85 percent of subscribers purchased gigabit-speed service. Nearly 66 percent bought services running  between 50 and 150 Mbps. Close to half of all subscribers (46 percent) bought service at speeds of 100 Mbps or higher. 


Friday, December 9, 2022

Power Users Aren't What They Used to Be

“Power users,” defined as accounts using far more data than the typical home broadband user, are not necessarily what you might think. Though we might traditionally have thought of such power users as major content creators or users with extraordinary downloading behavior, that arguably is no longer the case. 


The phrase “yesterday’s power user is today’s typical user” is apt. Where perhaps 11 percent of home broadband users in the third quarter of 2022 were power users, consuming at least a terabyte of data each month, the typical or average account used perhaps 496 gigabytes, with a median consumption of perhaps 324 gigabytes, 


According to Openvault, about 16 percent of accounts in the third quarter of 2022 were “power users” consuming at least a terabyte of data per month. Perhaps we once thought of power users as people with much higher than average computing skills, perhaps including software code writers, very-active content creators and sharers or online gaming enthusiasts. 


These days, the popularity of video streaming adds a more mundane class of users: people who watch lots of entertainment video. Perhaps a working definition is a person or household that streams at least eight hours of video each day. Do that and it is easy to top a terabyte of usage in a month. 

source: T-Mobile 


It should then come as no surprise that Openvault data shows a continued increase in gigabit service plan adoption, as well as migration of subscribers to speeds of 200 Mbps or higher. Though there is no linear casual relationship between access speeds and total data consumption, the two phenomena are correlated. 


Faster speeds allow more to be done in any X amount of time, so more data can be consumed in X amount of time, for example. Over time, applications also are designed to take advantage of higher bandwidths (speed), such as embedding autoplay full-motion video into apps. That increases “involuntary” data consumption. 


Some 15 percent of U.S. households purchased gigabit tier plans in the third quarter of 2022, an increase of 35 percent  over the 11.4 percent market share 12 months prior, says Openvault. 


As always, typical speeds also increased for typical accounts. The percentage of accounts buying service in the 200 Mbps to 400 Mbps range doubled to 54.8 percent  from 27.4 percent over the last year. 


At the end of the third quarter, only 4.7 percent  of all subscribers were provisioned for speeds of less than 50 Mbps, a reduction of more than half  from the third quarter 2021  figure of 9.8 percent. .


Average monthly usage of 495.5 GB was up 13.9 percent from 3Q21’s average of 434.9 GB, and represented a slight increase over 2Q22’s 490.7 GB. Median broadband was up 14.3 percent year over year, representing broader growth across all subscribers.


Year-over-year growth of power users of 1TB or more was 18 percent, to 13.7 percent of all subscribers, while the super power user category of consumers of 2 TB or more rose almost 50 percent during the same time frame. 


source: Openvault  


Friday, March 12, 2021

Half of U.S. Households Buy Internet Access Running between 100 Mbps and 200 Mbps

“Average” tends to be misleading for most things related to use of the internet, especially when using the arithmetic average (mean) rather than median approaches. In the fourth quarter of 2020, for example, mean data consumption by U.S. households was about 483 gigabytes, while median consumption was 294 GB (half higher, half lower). 


source: Openvault


The significant difference is “power user” data consumption. About two percent of users consume more than 2 terabytes of data per month, while 15 percent consume at least 1 TB per month. That skews the (mean) average consumption. 


source: Openvault


The Covid-19 work from home and stay at home policies caused an immediate spike in consumer fixed network data consumption, which has persisted at new and higher levels. 


source: Openvault


source: Openvault


Perhaps one way to describe consumer behavior is to note that half of U.S. households (51 percent) purchase service plans offering 100 Mbps to 200 Mbps downstream speeds. Less than a quarter buys speeds slower than 75 Mbps, while 30 percent or so buy plans running faster than 200 Mbps.


Wednesday, May 22, 2019

About 2% of Consumers Tracked by OpenVault Buy Gigabit Service

Looking at internet service provider data generated by OpenVault in the United States and Western Europe, about 1.85 percent  of subscribers tracked by OpenVault buy gigabit-speed service.

Some 3.5 percent buy services running between 300 Mbps and 500 Mbps, while seven percent buy service at speeds between 200 Mbps to 300 Mbps.

About 65 percent buy services running  between 50 Mbps and 150 Mbps.

A reasonable person might guess that the percentage of customers buying speeds of at least 200 Mbps, up to 1 Gbps, is higher in the United States than Western Europe, largely because cable TV operators, which sell the highest speeds, dominate the U.S. market.

The mid-range Comcast Xfinity services, for example, seem to run at speeds up to 200 Mbps or 250 Mbps  across most of its markets.


Thursday, March 10, 2022

Truth, Lies, Statistics

Language always matters. Definitions and assumptions always matter, because the truth matters. Methodology matters, in that regard. 


The NPD Group says only 50 percent of homes in the continental U.S. have “true broadband speed of 25Mbps download or higher.”


That can be--and will be--interpreted at least two ways. It could mean that internet service providers are way behind the curve in making quality broadband available, or it could mean that consumers choose not to buy it. 


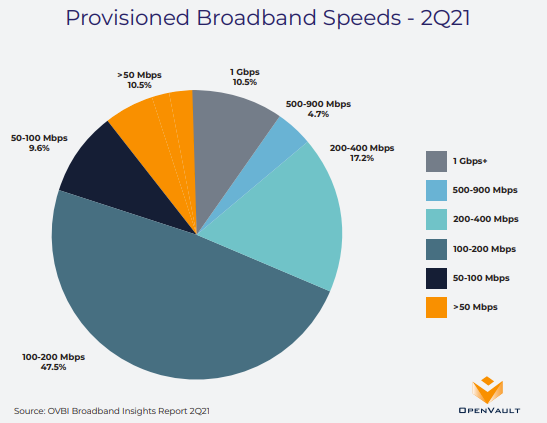
The former is a failure of supply; the second is a consumer choice. It matters which we are talking about. In fact, Openvault test data does not support the NPD assertions. In the third quarter of 2021, for example, 9.8 percent of actual consumers had test data showing downstream speeds “less than 50 Mbps.”


The percentage of customers unable to get 25 Mbps obviously is less than that. 

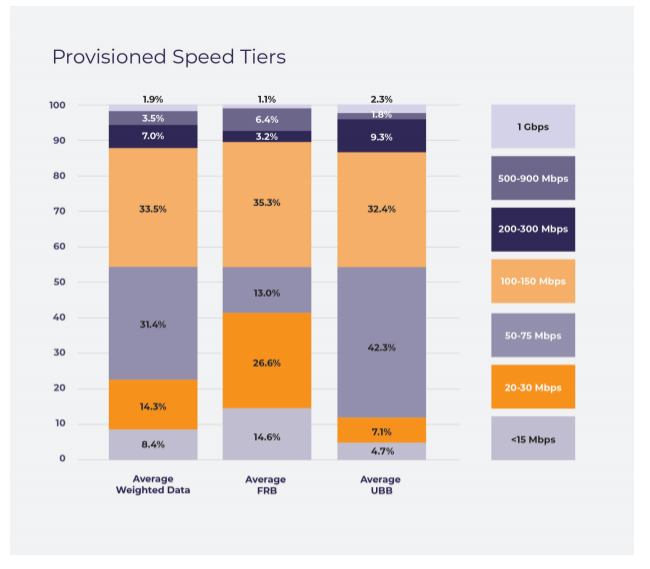
Though “average” speeds change all the time, the Openvault data show that by the third quarter of 2021, about 66 percent of all U.S. internet access buyers were getting speeds between 100 Mbps and 400 Mbps. 

source: Openvault 


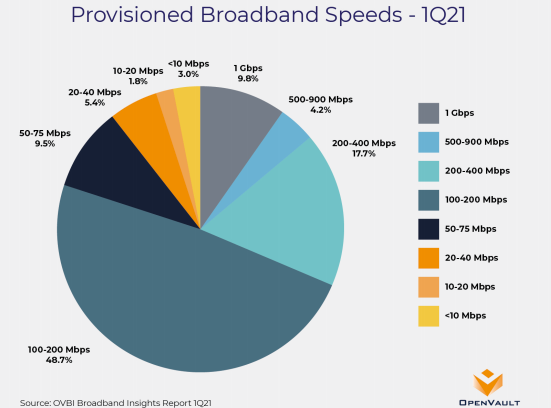
While it might have been true that half of U.S. consumers were buying services operating between 100 Mbps and 200 Mbps a year earlier, it was by the third quarter of 2021 very hard to determine how many were really buying services unable to meet the FCC definition of 25 Mbps downstream. 


What also is undeniable is that most speed tests are conducted by consumers using Wi-Fi. That means the tests understate speed, as Wi-Fi speeds often are many times slower than delivered ISP speed. 


The point is that ISP delivered speeds quite often degraded by performance of the in-home Wi-Fi networks, older equipment or in-building obstructions. Actual speeds delivered by the internet service provider to a router are one matter. Actual speeds experienced by any Wi-Fi-connected device within the home are something else. 


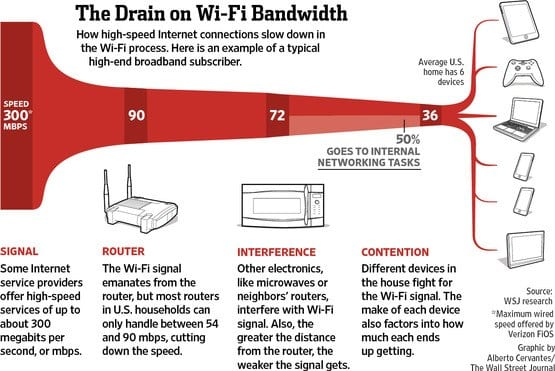
source: CMIT Solutions 


In practice, Wi-Fi speeds can be an order of magnitude slower than the speed actually delivered by the ISP. So when a consumer using Wi-Fi measures 25 Mbps, the delivered speed can be as much as 250 Mbps. 


NPD Group says about its methodology that “the report is based on a combination of sales data, speed test results, consumer surveys, FCC data and other sources.”


That implies demand side dales data and speed test results. Consumer surveys can be either demand or supply side based. The Federal Communications Commission data tends to be supply side (state of facilities and availability). 


To be clearer, what NPD likely means is that 50 percent of U.S. consumers choose to buy internet access at speeds less than 25 Mbps. But that cannot be true, if other demand side studies are correct. 


The storyline that U.S. internet access is slow or expensive seems irresistible, even if it is questionable. A study by Speedtest of 2020 internet access speeds showed the United States had the highest performance of all countries who are members of the G-20. 


source: Ookla


So much for the demand side. On the supply side, 


A recent study by the European Telecommunications Network Operators association says prices are not high.  


“In fact, 34 percent of homes receive internet access at speeds of less than 5 Mbps, including 15 percent  that do not have any internet access. The key phrase is “receive.” It is the speed they purchase. 


There are other important nuances. When do people take speed tests? Primarily when they are having a problem. Almost nobody routinely takes speed tests when performance is untroubling. So there is a bias to the taking of speed tests when networks are most congested. 


Is it possible that half of U.S. homes do not receive 25 Mbps? It seems highly doubtful. If there are 10 concurrent devices active inside a home, might each device see performance that looks like “less than 25 Mbps?” That is possible, if all 10 devices are simultaneously active and delivered speed is about 250 Mbps and all the devices use Wi-Fi.


But to argue that “half of U.S. homes” do not “receive” 25 Mbps seems contradicted by available data on actual usage. And that is just the demand side.


Between 60 percent and 80 percent of U.S. home locations can buy gigabit service if they chose to do so. Not all do so. 


But that reflects a consumer choice, not a failure of supply. 


It is highly likely that at least 80 percent of U.S. homes can buy internet access at speeds no lower than 500 Mbps and 1 Gbps if they choose to do so. Over time, as average supplied speeds climb, they will eventually do so. 


AI Will Improve Productivity, But That is Not the Biggest Possible Change

Many would note that the internet impact on content media has been profound, boosting social and online media at the expense of linear form...