Showing posts sorted by relevance for query technology adoption. Sort by date Show all posts

Monday, January 7, 2013

Why 2013 Won't be "Year of Mobile Payments"

Without in any way implying that mobile payments will fail, 2013 will not be, as pundits often are fond of proclaiming, be the "year of mobile payments." The reason is simply that mobile payments requires changing significant business processes throughout a complicate ecosystem, and those changes always take time. 

Consumer demand is not so much the problem. It's all the other changes that have to happen, ranging from replacing store terminals and software to creating a critical mass of end user devices and awareness, as well as providing a clear value proposition.  

At the same time, expectations have been "dampened" by the continuing slow uptake of near field communications. But none of that should be surprising,  in a historical sense. 

Juniper Research has revised its forecasts for the global near field communications market, significantly scaling back its growth estimates for the North American and Western European markets. In some ways, that might be considered a "good" thing, to the extent that it follows a common pattern of technology adoption.

The most significant change to the Juniper Research forecast is the amount of transaction activity NFC devices will drive, as the new forecast reduced the number of NFC devices in use only slightly.

By 2017, global NFC retail transaction values are now expected to reach $110 billion in 2017, significantly below the $180 billion previously forecast. 


Such revisions are not unusual in the predictions business, especially not for a brand new market that depends on many changes in the ecosystem. That tends to mean excessive enthusiasm early on, with an under-appreciation of what is going to change later.

What is "good" about deflated hopes is that such periods seem "always" to happen, and are just a milestone on the way to eventual adoption on a fairly wide scale. So the argument is that dashed initial hopes mean the market is moving in the way one should expect: high hopes, disillusionment, and finally adoption.


Such hype cycles might be viewed as a typical part of the technology adoption cycle for any important new technology.

New technologies historically take some time to reach 10 percent, then 50 percent, then virtually ubiquitous adoption. To be sure, there has been a tendency for new technologies based on digital and electronic technology to be adopted faster. But a decade period to reach perhaps 10 to 20 percent adoption is hardly unusual.

That is not much of an issue for point solutions like computers that can be used without lots of additional change in infrastructure. That is not true for highly-complex ecosystems such as payments, though.

ATM card adoption provides one example, where "decades" is a reasonable way of describing adoption of some new technologies, even those that arguably are quite useful. 


Debit cards provide another example. It can take two decades for adoption to reach half of U.S. households, for example. 


Wednesday, August 5, 2020

U.S. Business Advanced Technology Adoption Still Very Low

No matter how sexy industry observers might find advanced information technology to be, most businesses, and most business managers and owners, rarely report, at least at the moment, actually using advanced technologies, with the exception of personnel at very-large firms, a study sponsored by the U.S. Census Bureau finds. 


“We find that adoption of advanced technologies is relatively low and skewed, with heavy concentration among older and larger firms,” the study finds.


At least one reason for muted current adoption seems to be that applying advanced technology requires significant investments in other technologies and the ability to change business processes to take advantage of those technologies. “


We also find that technology adoption displays features of a hierarchical pattern, with stages of technology adoption of increased sophistication that appear to build on one another,” study authors say. In other words, most advanced technology is not “rip and replace.” To take advantage of new technologies, lots of other things must also change. 


In fact, the percentage of firm respondents--from a sample of about 850,000 firms--suggests adoption of most advanced technologies, ranging from touchscreens to machine learning; voice recognition to machine vision; natural language processing to automated vehicles, is quite low, mostly in the low single digits. 

source: U.S. Census Bureau, Wired


Saturday, March 7, 2020

The Most-Important Math Function for Device, App, Network Businesses

The sigmoid function arguably is among the most-important mathematical expressions one ever encounters in the telecom, application and device businesses. It applies to business strategy overall, new product development, strategy for legacy businesses, customer adoption rates, marketing messages and  capital deployment, for example. 

The sigmoid function applies to startups as well as incumbents; software and hardware; products and services; new and legacy lines of business. Describing a specific relation between sets, the sigmoid function also is required whenever neural networks are created. 

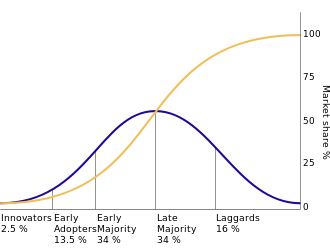
The concept has been applied to technology adoption in the notion of crossing the chasm of value any technology represents for different users. Mainstream users have different values than early adopters, so value propositions must be adjusted as any new technology product exhausts the market of early adopters. Early adopters can tolerate bugs, workarounds or incomplete on-boarding and support experiences. They tend to be price insensitive. 

Mainstream users typically require fully-developed customer support, costs that match value and a developed ecosystem (they do not want to write their own apps). Scale is not a huge issue early on, since the number of customers is limited. All that changes with adoption by the mass market, when support at scale is necessary. 

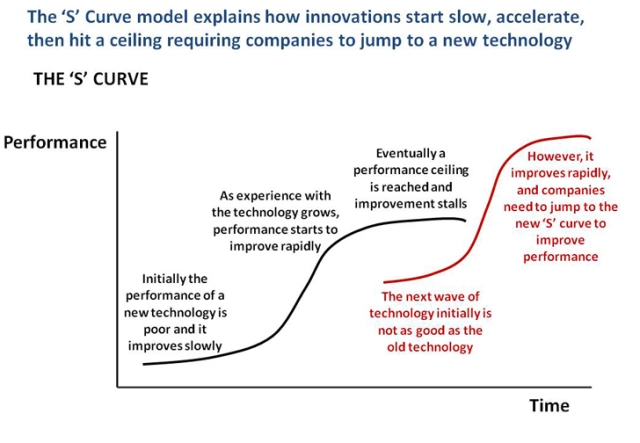
The S curve also is embedded into the concept of the product life cycle or new product development. Simply put, every product eventually exhausts its market. That further implies a constant need for new product development, which must necessarily begin before the succeeding product has reached its peak adoption level, and before that product begins its decline. 


Among the important takeaways is that technology or product adoption is logarithmic, not linear. What happens early in technology or product availability is quite different from what happens when any technology or product is demanded by the mass market. 

Product attributes and the ecosystem required are highly disparate for early adopters, compared to mass market customers in the growth phase, which is different from attributes required to attract late adopters. 

So how does this apply to 5G?

We’ve already started to hear stories about how consumers or enterprises are “disappointed” with 5G, even though 5G availability is still rolling out, even though there are different flavors of 5G with different strengths and weaknesses (because coverage and capacity, as always, are trade-offs). 

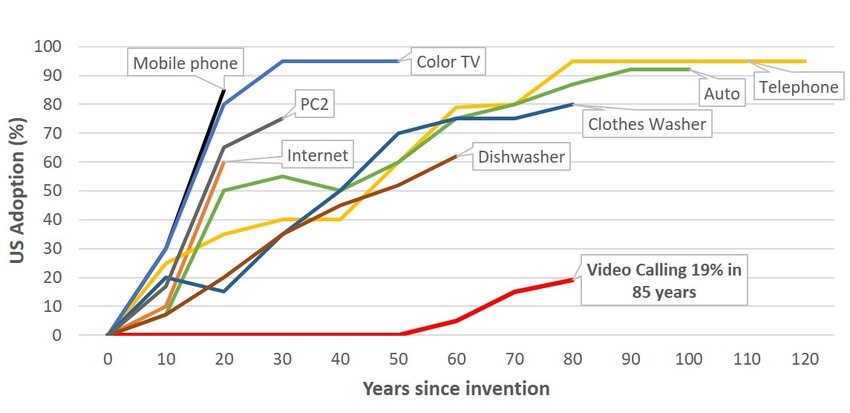
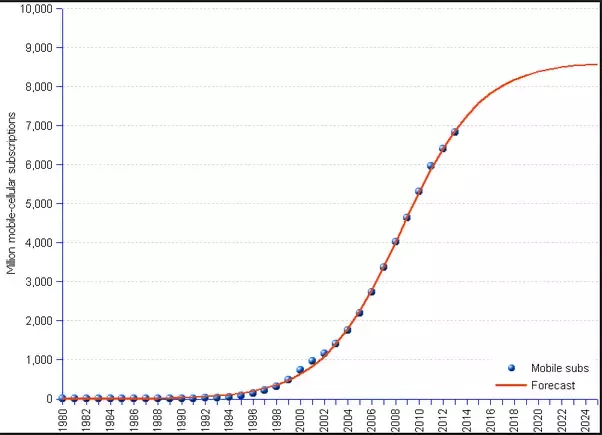
It is worth recalling that it took 10 years--in Europe--for 3G to reach adoption levels ranging from 30 percent to 60 percent. Take rates for 4G took a decade to reach 80 percent, and about five years to reach 50 percent adoption. 

If 5G is close to 4G in value, it will be about another five years before half of consumers actually buy the service. That is a good illustration of the S curve adoption model, something that applies to new services of all types, provided by incumbents or startups. 
As applied to 5G, it is easy to understand why early mixed reviews are understandable. The biggest performance boosts come with millimeter wave service that is going to take some time to supply, meaning few users actually have sustained use of that form of 5G. 

The other issue is the “obvious experience advantage” of 5G over 4G, compared to the difference in experience between 4G and 3G. Many do not recall, or did not experience the transition from 3G to 4G. Simply put, 4G brought immediate and obvious improvements in user experience of using the web from a mobile device, where 3G experience was painful.

That will not generally be the case for the transition from 4G to 5G. There are almost no use cases consumers will generally encounter or desire where 5G speed, capacity or latency advantages translate immediately into better experience. 

In other words, 4G service quality is quite good, compared to 3G experience when 4G launched. In fact, many users on low-band networks might not always even detect a significant difference in experience. 

As we already have encountered with fixed network performance, gigabit per second speeds--compared to services offering 100 Mbps to 200 Mbps--actually do not yield tangible experience benefits for any single user, though useful for multi-user households where simultaneous 4K streaming happens, lots of simultaneous gaming occurs or when multiple users are uploading lots of video content. 

It can be argued that 5G launches represent that same sort of situation: the capacious millimeter wave services cannot generally provide experience gains because 4G suffices (for the moment). 

That is bound to lead to some user disillusionment. 

The story can be quite different for a mobile service provider, deploying 5G in part for other reasons. As end user bandwidth demand continues to grow, there comes a point where 4G just runs out of room for improvement. 

That matters because cost per bit matters. Basically, mobile operators have to keep supplying more bandwidth to end users, but at about the same retail prices. There is some room for improvements at the margin, but the trend for decades has been that consumer prices have remained the same, or fallen, while the supply of bandwidth has increases, in some cases, at about the rate one would expect from Moore’s Law (doubling about every 18 months to 24 months). 

So end user experience “at the moment” is not the big issue. Supporting user experience in a few years, when the 4G network cannot do so at lower cost, is the big issue for a bandwidth supplier. 

Eventually, consumer benefits will be seen. But even so, lower cost per delivered bit would be reason enough for mobile operators to move to 5G now, before the next capacity crunch hits.

The ultimate creation of new services, apps and use cases, some of which will provide direct and indirect revenue, also are important. But the move to 5G is supported--one can argue--strictly by the need to deliver internet bandwidth at far lower cost. 

Latency and capacity improvements are nice, and have happened with each succeeding digital generation. And those improvements have lead directly to new use cases and value creation. Still, the bottom line is that mobile networks must drive down the costs of supplying internet access. 5G does that.

Sunday, August 30, 2020

Did Covid-19 Change Martec's Law?

There is wide agreement that the Covid-19 pandemic has caused many technology adoption curves to get a temporary bump up in adoption, with growth then continuing on the curve already in place before the pandemic and its organizational response.  That is illustrated by the impact of the “cataclysmic event” on an underlying rate of organizational change. 

source: chiefmartec


In other words, firms and organizations are said to have experienced “a year’s worth of change in a month.” 


Martec’s Law was coined in 2013 by Scott Brinker, Hubspot VP. Martec’s Law states that technology changes linearly, while technological change is non-linear. That observation has parallels in the notion of the productivity paradox. 


The productivity paradox suggests that information technology or communications investments do not always immediately translate into effective productivity results. Many note that measured productivity has declined since 2000, despite all the technology investments firms have made. 


source: Goldman Sachs


This productivity paradox was apparent for much of the 1980s and 1990s, when one might have struggled to identify clear evidence of productivity gains from a rather massive investment in information technology.


Some would say the uncertainty covers a wider span of time, dating back to the 1970s and including even the “Internet” years from 2000 to the present.


The point is that it has in the past taken as long as 15 years for technology investments to produce measurable gains


Computing power in the U.S. economy increased by more than two orders of magnitude between 1970 and 1990, for example, yet productivity, especially in the service sector, stagnated).


And though it seems counter-intuitive, even the Internet has not clearly affected economy-wide productivity. Some might argue that is because we are not measuring properly. It is hard to assign a value to activities that have no incremental cost, such as listening to a streamed song instead of buying a compact disc. It might also be argued that benefits accrue, but only over longer periods of time


source: Customer Think


Few, if any, buyers of new technology actually believe the claims of benefit advanced by suppliers, for good reason. Virtually all observers of technology adoption note that organizations benefit from new technology at a rate that is vastly less than the rate of adoption. That’s the essence of Martec’s Law, which holds even if the Covid-19 pandemic caused an unusual step change in behavior. 


Tuesday, November 30, 2021

Before Metaverse There was Second Life

Before the metaverse there was Second Life. It has been a decade and a half since Second Life was heralded as the next big thing: virtual worlds. Second Life still is around, but did not really become the next big thing. In fact, significant new technologies often take decades to become commercially relevant or ubiquitous.


Advanced technology often does not get adopted as rapidly as the hype would have you believe. In fact, most useful advanced technologies tend not to go mainstream until adoption reaches about 10 percent. That is where the inflection point tends to occur. That essentially represents adoption by innovators and early adopters.


source: LikeFolio


Consider mobile phone use, among the most-ubiquitous products used globally. On a global basis, it took more than 20 years for usage to reach close to 10 percent of people. The point is that even a truly useful or transformative new product or technology can take a decade or more to reach the early adopter stage, which is when 10 percent of people or households use an innovation. 


source: Quora


That is why Sigmoid curves are the rule for product or technology diffusion. The S curve has proven to be among the most-significant analytical concepts I have encountered over the years. 


It describes product life cycles, suggests how business strategy changes depending on where on any single S curve a product happens to be, and has implications for innovation and start-up strategy as well. 


source: Semantic Scholar 


Some say S curves explain overall market development, customer adoption, product usage by individual customers, sales productivity, developer productivity and sometimes investor interest. It often is used to describe adoption rates of new services and technologies, including the notion of non-linear change rates and inflection points in the adoption of consumer products and technologies.


In mathematics, the S curve is a sigmoid function. It is the basis for the Gompertz function which can be used to predict new technology adoption and is related to the Bass Model.


 I’ve seen Gompertz used to describe the adoption of internet access, fiber to the home or mobile phone usage. It is often used in economic modeling and management consulting as well.


The next big thing will have first been talked about roughly 30 years ago, says technologist Greg Satell. IBM coined the term machine learning in 1959, for example.


The S curve describes the way new technologies are adopted. It is related to the product life cycle. Many times, reaping the full benefits of a major new technology can take 20 to 30 years. Alexander Fleming discovered penicillin in 1928, it didn’t arrive on the market until 1945, nearly 20 years later.


Electricity did not have a measurable impact on the economy until the early 1920s, 40 years after Edison’s plant, it can be argued.


It wasn’t until the late 1990’s, or about 30 years after 1968, that computers had a measurable effect on the US economy, many would note.


source: Wikipedia


The point is that the next big thing will turn out to be an idea first broached decades ago, even if it has not been possible to commercialize that idea. 


Metaverse seems to follow the pattern.


Thursday, August 6, 2020

Advanced Technology Takes Longer Than You Think to Become Mainstream

Advanced technology often does not get adopted as rapidly as the hype would have you believe. In fact, most useful advanced technologies tend not to go mainstream until adoption reaches about 10 percent. That is where the inflection point tends to occur. That essentially represents adoption by innovators and early adopters. 

source: LikeFolio


One often sees charts that suggest popular and important technology innovations are adopted quite quickly. That is almost always an exaggeration. The issue is where to start the clock running: at the point of invention or at the point of commercial introduction? Starting from invention, adoption takes quite some time to reach 10 percent adoption, even if it later seems as though it happened faster. 

source: Researchgate


Consider mobile phone use. On a global basis, it took more than 20 years for usage to reach close to 10 percent of people. 

source: Quora


That is worth keeping in mind when thinking about, or trying to predict, advanced technology adoption. It usually takes longer than one believes for any important and useful innovation to reach 10-percent adoption


source: MIT Technology Review


That is why some might argue 5G will hit an inflection point when about 10 percent of customers in any market have adopted it.

Wednesday, June 6, 2012

Mobile Banking Faces "Chasm" After Early Adopters

Crossing_the_Chasm, Geoffrey Moore's book about the technology diffusion process, makes the point that there is a chasm between the early adopters of the product (the technology enthusiasts and visionaries) and the early majority (the pragmatists) whose adoption is key for any new technology to take hold in the mass market.

Essentially, Moore argues that technology adopters have very different values, requiring a shift of marketing emphasis at each stage of additional adoption.

Crossing the Chasm is closely related to the technology adoption lifecycle where five main segments in turn must be won over: innovators, early adopters, early majority, late majority and laggards.

That same process is at work in the mobile banking business as well. Fiserv argues that many banks and credit unions are on a mobile  adoption path that attracts the early adopters within  a year of offering the service, but the trajectory  stagnates to include just a small additional percentage  of adopters over the next two years.

That’s the “chasm” Moore talks about. Early adopters have embraced mobile banking because it is cool. The next wave of adopters actually will not see that as an advantage, and will resist.

To break through the “glass ceiling” of 20 percent  mobile banking adoption, Fiserv argues,
financial institutions must convince customers outside the pool of early adopters  that mobile banking will provide both convenience and benefits that cannot be experienced through other channels.


In other words, consumers must decide if mobile banking is: 1) useful, 2) accessible, 3) secure, 4) familiar and 5) easy to use. 


How consumers answer these questions will impact the adoption outcome.

Wednesday, July 14, 2021

Why All Forecasts are Sigmoid Curves

STL Partners’ forecast for Open Radio Access Network investments--whether one agrees with the projections or not--does illustrate one principle: adoption of successful new technologies or products tends to follow theS curve growth model.


The S curve  has proven to be among the most-significant analytical concepts I have encountered over the years. It describes product life cycles, suggests how business strategy changes depending on where on any single S curve a product happens to be, and has implications for innovation and start-up strategy as well. 


source: Semantic Scholar 


Some say S curves explain overall market development, customer adoption, product usage by individual customers, sales productivity, developer productivity and sometimes investor interest. It often is used to describe adoption rates of new services and technologies, including the notion of non-linear change rates and inflection points in the adoption of consumer products and technologies.


In mathematics, the S curve is a sigmoid function. It is the basis for the Gompertz function which can be used to predict new technology adoption and is related to the Bass Model.


 I’ve seen Gompertz used to describe the adoption of internet access, fiber to the home or mobile phone usage. It is often used in economic modeling and management consulting as well.


Source: STL Partners


The following  graph illustrates the normal S curve curve of consumer or business adoption of virtually any successful product, as well as the need to create the next generation of product before the legacy product reaches its peak and then begins its decline. 


The graph shows the maturation of older mobile generations (2G, 3G) in red, with adoption of 4G in blue. What one sees is the maturing products are the top of the S curve (maturation and decline) while 4G represents the lower part of the S curve, when a product is gaining traction. 


The curves show that 4G is created and then is commercialized before 3G reaches its peak, and then declines, as the new product displaces demand for the old. 

source: GSA


Another key principle is that, successive S curves are the pattern. A firm or an industry has to begin work on the next generation of products while existing products are still near peak levels. 


source: Strategic Thinker


It also can take decades before a successful innovation actually reaches commercialization. The next big thing will have first been talked about roughly 30 years ago, says technologist Greg Satell. IBM coined the term machine learning in 1959, for example.


The S curve describes the way new technologies are adopted. It is related to the product life cycle. Many times, reaping the full benefits of a major new technology can take 20 to 30 years. Alexander Fleming discovered penicillin in 1928, it didn’t arrive on the market until 1945, nearly 20 years later.


Electricity did not have a measurable impact on the economy until the early 1920s, 40 years after Edison’s plant, it can be argued.


It wasn’t until the late 1990’s, or about 30 years after 1968, that computers had a measurable effect on the US economy, many would note.


source: Wikipedia


The point is that the next big thing will turn out to be an idea first broached decades ago, even if it has not been possible to commercialize that idea. 


The even-bigger idea is that all firms and industries must work to create the next generation of products before the existing products reach saturation. That is why work already has begun on 6G, even as 5G is just being commercialized. Generally, the next-generation mobile network is introduced every decade. 


source: Innospective


There are other useful predictions one can make when using S curves. Suppliers in new markets often want to know “when” an innovation will “cross the chasm” and be adopted by the mass market. The S curve helps there as well. 


Innovations reach an adoption  inflection point at around 10 percent. For those of you familiar with the notion of “crossing the chasm,” the inflection point happens when “early adopters” drive the market. 

source 


It is worth noting that not every innovation succeeds. Perhaps most innovations and products aimed at consumers fail, in which case there is no S curve, only a decline curve. 


source: Thoughtworks 


The consumer product adoption curve and the S curve also are related to the point at which early adopters are buyers, but before the mass market adoption starts. 


source: Advisor Perspectives 


Also, keep in mind that S curves apply only to successful innovations. Most new products simply fail. In such cases there is no S curve.  The “bathtub curve” was developed to illustrate failure rates of equipment, but it applies to new product adoption as well. Only successful products make it to “userful life” (the ascending part of the S curve) and then “wearout” (the maturing top of the S curve before decline occurs). 


AI Will Improve Productivity, But That is Not the Biggest Possible Change

Many would note that the internet impact on content media has been profound, boosting social and online media at the expense of linear form...