Wednesday, May 17, 2017

Why "Winner Take All" is So Common

Winner take all is the adage describing market leadership in most application categories, but also might be said to apply in capital-intensive industries such as the telecom business. Some might argue that structure describes most markets, over time, including retailing, transportation, and information technology.

The percentage of total revenue at publicly-traded U.S. corporations earned by the top 100 firms was 53 percent in 1995, for example, growing to 84 percent over the next two decades.

The difference share makes is clear in big markets, especially, according to researchers at Consultancy

Others would say the “winner takes all” market structure is particularly apt to occur in two-sided markets (transaction markets linking buyers and sellers; media markets or markets largely supported by advertising).

Some will note that markets with network effects also tend to produce the “winner take all” pattern, since such markets are built on value that increases disproportionately with the number of potential connections. In the old telecom business, that was exemplified by the “anyone can call anyone” level of scale.

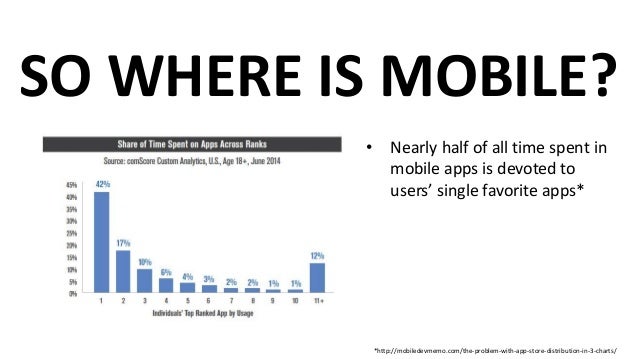
It is easy to illustrate the fact that mobile app usage is highly concentrated on the supplier side, illustrating the winner take all pattern, where the leader in a category has 40 percent market share, or greater.

"The continuous growth of messaging and social apps mean that the total app time is becoming dominated by just a few sectors, with the top three categories accounting for 78 percent of all mobile app time spent," says Dr. Hannu Verkasalo, Verto Analytics CEO.

The point is that “winner take all” is surprisingly common, in many markets. In fact, it might be considered the “normal outcome” in any competitive market, according to analysis used by Constellation Research.

In many markets it is not uncommon for a few leaders to earn 70 percent of profits, if not revenue, for example. In fact, the phrase "winner takes all" normally refers to profit share, not revenue share or units shipped share.

Tuesday, May 16, 2017

Big Test for Ting in Denver Suburban Markets

If Google Fiber so far has proven to be the biggest single disappointment among the ranks of overbuilders and proponents of greater local loop competition, it is hardly alone. There are some other “for-profit” overbuilders and perhaps a couple hundred not-for-profit municipal networks.

Among the more interesting is Ting, owned by Tucows, a provider of internet domain name registration services.

And though would-be municipal overbuilds seem to be gathering momentum, most such networks have worked in rural areas and small towns.

Also, so far, it appears that most such efforts peak at between 20 percent and 25 percent market share. Overbuilder Ting says it intends to get 50-percent market share in five years in it markets, an aggressive target that likely never has been reached.

Ting says it has been able to get about 20 percent share initially, in a number of its internet access markets.

“We expect to see 20 percent adoption amongst serviceable addresses in a year and 50 percent in five years,” Ting CEO Elliot Noss always says. That latter forecast likely is quite important.

Noss talks about “network cost per customer” in somewhat oblique ways. There is cost per passing and cost per customer. The former figure does not change with adoption. The latter figure is highly dependent on take rates.

“At these take rates we will be paying about $2,500 to $3,000 per customer and those customers will be worth about $1,000 a year in margin,” says Noss (Noss probably meant “revenue,” not “margin.”). That makes sense at about 20 percent penetration and network costs per home passed of about $500.

Getting 50-percent market share really changes the “cost per customer” of the network. At 50 percent (every other home is a customer), the per-customer cost of the network drops to about $1,000.

“So we think about $1,000 to $1,400, plus the install to build a home,” he said. That seems to imply the cost per customer at 50-percent penetration, with about $1,000 in network costs and then about $400 for activating a drop and supplying customer premises equipment.

You're not going to get that $1,000 down to $500,” he says.

All that implies a network cost between $500 and $600 per passing. That would be in line with network construction costs to build the municipal network in Chattanooga, Tenn.

So the basic math for any overbuilder doing a fiber to home network involves network capex of about $500 to $600 per location, and about $400 per activated customer location.

Against that are a couple major assumptions, including take rates and average monthly recurring revenue. At 50-percent take rates, an overbuilder should have a terrific business, even with average revenue per account as low as $70 a month to $90 a month.

At 20 percent longevity could be a key issue. So, all other things being equal, the keys for overbuilder success are capex control, ARPU and take rate.

Significantly, Ting also is entering new suburban markets in Denver, Colo. that are bigger than what Ting has attempted in the past.

Ting Internet continues to gradually add locations in Charlottesville, a town of 46,000.

Ting also is offering commercial internet access service in Holly Springs, N.C. a community of about 30,000.

Early in 2017 Ting saw commercial activations in Westminster, Colo., a town of about 102,000 people. And Ting also will be building in Centennial, Colo., a suburb of about 120,000 people.

Local Access is Not a Natural Monopoly; But Might be a Somewhat-Natural Duopoly

It always has been difficult to challenge the incumbent U.S. telcos and cable companies in the consumer access services business. For that reason, hopes for sustained and widespread competition to the incumbents hinges on how feasible such challenges are, or might become.

We can say that in every market, local access is not a natural monopoly, as exemplified by the presence of three to four mobile operators, plus at least one fixed network retailer. In a few markets there is facilities-based competition between cable TV and telcos on a widespread or even ubiquitous basis.

What remains unclear is the natural progression of markets over time, such as how many mobile or fixed providers with their own facilities can sustain themselves long term.

“Overbuilding” of U.S. telcos and cable TV companies by third parties is not new, and has been going on for decades. But it has been a niche undertaking, for the same sorts of reasons business service providers have had to specialize.

Fixed networks are horrifically expensive, so few would-be competitors can raise capital to enter the market. And even if capital can be raised, large sums generally cannot be raised if the business model is a complete, head-to-head competition with both cable TV and telcos in a market.

The obvious result is that there are a limited number of cases where a facilities-based fixed networks attacker can create a sustainable business model.

Where such competition has proven sustainable, it is on a “niche” basis.

That has tended to be urban cores for alternate access providers (generally metro fiber companies), all-IP, high-capacity long-haul routes and selected large buildings for business services.

In the consumer space, high-rise buildings have been a logical target, followed by selective operations in suburban areas of big metro areas and small towns in rural areas. There is a simple reason for that pattern. Fixed networks are expensive and stranded assets are a big issue. So attackers tend to focus on niches.

We are focused on efficient capital spending,”  says Wide Open West. In other words, the firm cannot build everywhere.

WideOpenWest, for example, “operates primarily in economically stable suburbs that are adjacent to large metropolitan areas as well as secondary and tertiary markets (smaller towns).”

The firm also grows incrementally by building in new areas adjacent to where it already has operations, using a technique known a edge-out, “making capital-efficient decisions and leveraging our existing operating infrastructure,” says WideOpenWest.

Even Google Fiber, with an ambitious overbuilder plan, found its neighborhood-by-neighborhood building program a challenge.

WideOpenWest, for example, ranks about sixth among U.S. consumer triple play providers, and might also be the largest overbuilder, with annual revenues of about $1.2 billion, passing about three million locations and claiming about 780,000 accounts, with take rates  about 26 percent, across all 300 communities in 19 markets.


WideOpenWest overlaps Comcast about 53 percent of the time and competes with Charter Communications 39 percent of the time, and with AT&T virtually all the time. In some cases, WOW competes with Verizon FiOS (3.5 percent of cases) and Frontier Communications (2.7 percent).

Between the start of 2014 and end of 2016, though, the number of accounts served by WOW has declined slightly, as video and voice units have been lost, as internet access has grown.

That is not to say expansion (further edge outs) is precluded. Indeed, that has been a key growth driver for WOW. But WOW’s results might well suggest that a competent overbuilder has trouble sustaining market share beyond about the mid-20s level, over a long period of time, as markets evolve and incumbents create new sources of value.

Impact of Common Carrier Rules on Internet Access is Either Unknowable or Mixed

"What might have happened" with U.S. infrastructure spending, had common carrier rules not been imposed, is unknowable. "What did happen" is complicated.

It remains difficult to assess whether capital spending, under common carrier rules, grew, remained the same or shrunk, for several reasons. Some argue capex in the U.S. market grew, while others argue it declined. Different assumptions matter here.

Some point to actual levels of spending, and argue that is the proof of what happened. Others argue the issue is “what would have happened, if the rules had not been in place?”

As to what actually happened, spending was up and down, depending on industry segment and by company. So it is possible--perhaps likely--that multiple drivers were at work, making it impossible to sort out the common carrier impact from the other forces at work.

It also is impossible to prove what investment levels might have been, in the absence of the rules and contestant perceptions of what value the higher investment could have delivered.

Nor is it easy to describe the change in expectations created by anticipation of the rules. Although the common carrier rules were levied in 2015, industry observers had been expecting those rules for some time, causing investment hesitance, it is argued.

It might be reasonable to argue that expectations matter. It is logical to invest more heavily when a market with good profit margin is growing; less logical when markets are declining and have poorer prospects. It is logical to invest more when there is a guaranteed rate of return; less logical to invest heavily when markets are competitive.

It is logical to invest more heavily when there is a chance to significantly take market share; the opposite stance being logical when, despite investment, share might still be lost.

So it can be argued that there are clearly different dynamics at play in the U.S. mobile, fixed and cable TV segments, not a single trend.

At a high level, mobility capex tended to grow (growth was possible and competition increasing, so there was an investment push and a pull); fixed network capex was flat to declining (unclear whether revenue would increase, even if the investments were made); and cable TV capex was up slightly (cable could see a way to take a clear lead, and was gaining market share).

As a background trend, global telecom capital investment levels have been flat or declining since about 2000.

Further, investment sometimes is driven by reasons other than immediate expected return. In other words, investment might have been driven, in the current period, by considerations other than the common carrier rules.

I remember well being told, off the record, by a fixed network telecom executive, that the fiber ot home decision was, in fact, not driven by the usual investment considerations (invest A, earn a 20-percent return above return of capital) but by strategic concerns.

In other words, “we are investing to keep our business,” and not because the financial return really was expected to be positive in the normal sense. Given the heightened levels of telecom industry competition, some decisions were driven by competitive issues unrelated to common carrier rules, and, again, might well have been higher in the absence of the rules.

The point is that a number of drivers exist for capital investment decisions. It is hard to isolate the impact of common carrier regulations from the rest of the considerations. And it is impossible to determine what might have happened, had the rules not been in place.

Capex Under Common Carrier Rules Still Debated

Some questions simply cannot be answered. We really do not know whether, in fact, ubiquitous high speed internet "causes" economic growth, though everybody acts as though that were the case. We do not know whether high speed access helps grow incomes, or whether higher incomes lead to high speed access adoption. 

Likewise, it remains difficult to assess what impact common carrier rules had on capital spending. You might argue it is a simple exercise: simply add up the numbers. So some make the argument that overall investment was, in fact, not lessened by common carrier regulation.

Others would argue that investment grew in some segments, declined elsewhere, but would likely have been higher if common carrier rules were not in place.


Some might note that there also are other important drivers of behavior, aside from the rules, as well.

Although the common carrier rules were levied in 2015, industry observers had been expecting those rules for some time, causing investment hesitance, it is argued. That also is hard to know for certain.


It might be reasonable to argue that expectations matter. It is logical to invest more heavily when a market with good profit margin is growing; less logical when markets are declining and have poorer prospects. It is logical to invest more when there is a guaranteed rate of return; less logical to invest heavily when markets are competitive.


It is logical to invest more heavily when there is a chance to significantly take market share; the opposite stance being logical when, despite investment, share might still be lost.


So it can be argued that there are clearly different dynamics at play in the U.S. mobile, fixed and cable TV segments, not a single trend.


At a high level, mobility capex tended to grow (growth was possible and competition increasing, so there was an investment push and a pull); fixed network capex was flat to declining (unclear whether revenue would increase, even if the investments were made); and cable TV capex was up slightly (cable could see a way to take a clear lead, and was gaining market share).


As a background trend, global telecom capital investment levels have been flat or declining since about 2000.


Further, investment sometimes is driven by reasons other than immediate expected return. In other words, investment might have been driven, in the current period, by considerations other than the common carrier rules.


I remember well being told, off the record, by a fixed network telecom executive, that the fiber ot home decision was, in fact, not driven by the usual investment considerations (invest A, earn a 20-percent return above return of capital) but by strategic concerns.


In other words, “we are investing to keep our business,” and not because the financial return really was expected to be positive in the normal sense. Given the heightened levels of telecom industry competition, some decisions were driven by competitive issues unrelated to common carrier rules, and, again, might well have been higher in the absence of the rules.

The point is that a number of drivers exist for capital investment decisions. It is hard to isolate the impact of common carrier regulations from the rest of the considerations. And it is impossible to determine what might have happened, had the rules not been in place.

Monday, May 15, 2017

AT&T Growth "Up the Stack" is Coming

Over the last several decades, tier-one telcos mostly have grown by acquisition, and also mostly by horizontal acquisitions (more accounts gained in mobile or fixed lines).

The best example is mobile operators moving into new countries. Relatively lesser impact has been seen in organic growth or vertical acquisitions that have telcos moving into other elements of the value chain. At some point, those vertical acquisitions might be determinative.

And that likely is true despite widespread expectation or evidence that horizontal mergers are what is going to change revenue sources (consolidation in Indian mobile market being the best current example); hypothesized activity in the U.S. market being the other potential big development.

Globally, it remains likely that horizontal mergers will have the greatest revenue impact in the near term (both consolidation within markets and growth out of market).

Long term, vertical mergers are more important, if you believe "access" markets are in a "almost no growth" state, and likely to stay that way.

AT&T executives recently pointed out that video, spectrum resources and distribution were three underpinnings of company strategy for the future. Some would say those foundational elements will change again, in the relatively near future, as AT&T eventually assembles a bigger mass of content and app assets.

Though business-related assets (internet of things, connected vehicles) likely will play a bigger role at AT&T than entertainment content assets do at Comcast, the principle is the same.

Over time, AT&T will generate growing percentages of revenue from apps and services distinct from its “access” portfolio (mobile and fixed subscriptions). And a larger share likely will come in the “business to business” segment of the business, rather than the “consumer” parts of the business.

Right now, AT&T revenue is lead by mobility, entertainment and business services, all a mix of “access” revenue (internet access and business data access) and “apps” (voice, messaging, entertainment video subscriptions).

Over time, AT&T will move, as did Comcast, more in the direction of revenues driven by “apps” rather than “access.” Changes in revenue composition have been coming fast at AT&T in recent years, with the single biggest change being AT&T’s leap to status of biggest supplier of linear video entertainment in the U.S. or global markets.

Of course, there are several ways to lump revenue sources. AT&T used to break out “mobility” as a single category. These days it reports business customer revenue (mobile and fixed) as a single category, with consumer mobile as a separate category, and “video and broadband” as a new category, along with international revenues.

In one sense, consumer revenues comprise more than half of total revenues. Mobility probably still drives half of AT&T revenue.

How those sources change over the next decade or two will tell the story of how successful AT&T and other tier-one service providers have gotten in “moving up the stack.”


Hilarious Skit on Amazon Echo "Silver"


This is funny! 


Governments Likely Won't be Very Good at AI Regulation

Artificial intelligence regulations are at an early stage, and some typical areas of enforcement, such as copyright or antitrust, will take...