Tuesday, October 16, 2018

Live Streaming Might Well Salvage Most Linear Accounts

For 42 percent of customers who continue to buy linear video subscriptions, live programming is the primary reason for keeping such a subscription. But 30 percent of such customers say  they would cut the cord if they knew they could live stream all of their favorite sports, events, and news, a new study by Telaria and Adobe Advertising Cloud has found.

An additional 40 percent would consider doing so as well.

But live streaming is the latest new change. Live streaming provides the advantages of live television content, but consumed as a real-time OTT service rather than through a traditional cable or satellite connection.

Cost is the other major variable. Some 73 percent of customers who terminated their traditional linear video subscriptions cited cost as a reason for dropping the service.

So we may someday find that such surveys of cord cutting were not as predictive as we once thought, for a couple of reasons.

The emergence of live programming services that cost less and  are streamed may well change customer behavior. Consumers may switch to OTT linear offerings in place of legacy linear services.

Such options combine the “best” of linear services (live content) with the lower cost and possible conveniences of streaming services that show archived content.

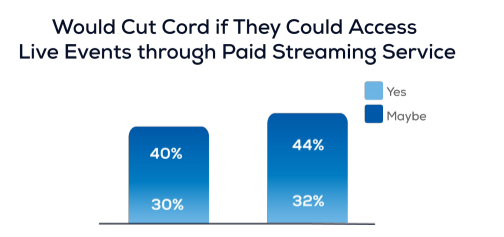
The study polled 750 consumers between the ages of 21 and 54.

Mobile Industry Revenue Growth Falls to 0.3%

Revenue growth is the single biggest problem facing the global mobile services industry. Globally, mobile revenue has just 0.3 percent compound annual growth rate.

And even in the fastest-growing mobile markets globally--Sub-Saharan Africa-where subscriptions are growing at a compound annual growth rate of of 6.1 percent to 2020, about 50 percent faster than the global average, revenue growth is not keeping pace, expanding only about two percent per year.

That is why the search for big new revenue contributors in the internet of things, entertainment video and other potential big new markets is so intense.

Total mobile revenues in Sub-Saharan Africa reached $40 billion in 2016, an increase of 3.9 percent, year over year. But revenue growth since 2017 has been trending downwards, driven in part by economic weakness.

Revenue growth will “remain subdued for the remainder of this decade due to the increasing cannibalization of traditional voice and messaging revenues as subscribers shift to alternative platforms,” says GSMA.

As in other markets, messaging substitutes are widely used and are one reason voice and carrier messaging revenues are dropping.

With traditional voice and messaging services accounting for more than 70 percent of service revenues for many operators in the region, revenue growth from additional subscriptions and mobile internet will be countered by declining legacy revenues.

source: GSMA

Monday, October 15, 2018

SD-WAN Market Size is Not So Much the Issue: Enterprise Networking Market is Key

Revenue for the SD-WAN market overall was $221 million in the second quarter of 2018, doubling year-over-year and up 25 percent in sequential quarters, according to a report from IHS Markit.


Most of the revenue earned in the SD-WAN space is earned by edge device suppliers, although service provider alternatives are proliferating fast.


But that is not the point. If SD-WAN becomes a replacement for MPLS, the addressable market is much larger, on the order of $35 billion in service provider service provider revenue.


VMware had 18 percent market share, Aryaka was in second place with 15 percent and Cisco entered the top three with 12 percent, the report says.
source: IHS Markit

Cost of Using Internet Access Drops, Globally

By 2025, entry-level (fixed network) broadband services should be made affordable in developing countries at less than two percent of monthly gross national income per person. That matters as the cost of using internet access services as a percentage of income is a key measure of affordability.

More importantly, the total number of active mobile broadband subscriptions is expected to reach 4.4 billion by end 2018, up from 3.3 billion, at the end 2015,  the International Telecommunications Union says. That matters since mobile internet access is the way most people in developing countries use internet access services.

This is a clear case of perceiving a “glass half empty, or half full.”

In January 2017, the Broadband Commission lowered the de-facto standard for Internet  affordability to two percent of average income, from the previous five percent levels, evidence of significant price declines.

Although the majority of the world’s population (52 percent or 3.7 billion) currently remain unconnected, 3.8 billion people or 49 percent of the global population will be online by the end of 2018.

In less developed countries, prices fell from 32.4 percent to 14.1 percent of GNI.

The point is that, when making cross-country comparisons, costs must be adjusted for purchasing power.

Around 1995, the cost of buying a U.S. business connection supporting a kilobit per second might have been US$1.50 to $1.75. In other words, a 56 kbps connection might have cost as much as $98 a month.

By about 2006, even consumer internet access costs had dropped to about two cents per kbps. So a 10 Mbps connection might then have cost the same as the 56 kbps connection of 1995. In 2017, U.S. 100 Mbps connections cost about the same as a 56 kbps connection of 1995.

As speed has grown and apps have evolved, consumers now use more data (megabytes), so the cost per consumed megabyte also has fallen, even as people use more data.

mobile1

While complaints about high prices never seem to stop, in developed markets as well as the United States, the percentage of disposable income spent on fixed network internet  access is about 1.7 percent of gross national income per person.

The glass is half full.

"Factual" and "True" Observations about Internet Access Quality

Some statements are factual, but arguably not “true.” It is factual that fixed network or terrestrial network coverage gaps exist in rural and other “hard to reach” areas. In many rural areas, especially mountainous areas where few people live, there might be zero mobile network coverage, to say nothing of fixed network coverage.

The existence of such gaps might, or might not, bear much relationship to the state of service quality in dense, suburban and other areas with greater population density. In other words, it is not a “failure” of government or industry that some areas have poor to no terrestrial network coverage. Some areas simply have such low population density that only satellite service is commercially viable, even with deployment subsidies.

The simple reality is that coverage of the “last couple of percent” of people in most countries with rural, mountainous or island geographies is quite expensive. In the U.S. market, for example, it is coverage of the last one percent of people that is most tellingly expensive.

The point is that coverage gaps can exist without necessarily telling us very much about the state of internet access on a wider basis within any country.


Saturday, October 13, 2018

5G Millimeter Wave Capacity: Bits per Hertz Matters

There are several reasons why the advent of millimeter wave spectrum for 5G vastly increases bandwidth, and thereby creates new business opportunities for mobile operators. Not only will millimeter wave spectrum represent a vast increase in mobile capacity (an order of magnitude to two orders of magnitude effective new spectrum), but millimeter wave spectrum also is more efficient.


Where spectrum below about 2 GHz has a spectral efficiency up to 2.5 bits per Hertz in a 4G context, and up to 3.8 bits per Hertz on a 5G network, millimeter wave spectrum has an efficiency up to seven bits per Hertz.


Basically, not only does millimeter wave spectrum represent an order of magnitude more capacity (Hertz), it also represents more bits per Hertz, as much as double what is possible on a 5G network using spectrum below 2 GHz or so. The reason has much to do with frequency and its relationship to symbol representation.  


source: T-Mobile US

By 2028, 90% of All 5G Traffic Will be Video

The importance of content, especially video content, delivered on mobile networks can be glimpsed from a new forecast by Ovum. By 2028, about 90 percent of 5G traffic is expected to be video.

Between 2019 and 2028, Ovum analysts predict, media and entertainment companies will compete for about $3 trillion in cumulative mobile content revenues, of which about $1.3 trillion will be earned on 5G networks, Ovum suggests.

5g tipping point

By 2025, 57 percent of mobile revenue globally will be earned on 5G networks, say researchers at Ovum. By 2028, Intel and Ovum expect that number to rise to 80 percent.

he report, sponsored by Intel,  predicts that augmented reality and virtual reality will generate cumulative revenues of $140 billion (£106 billion) between 2021 and 2028.

Immersive and new media applications which don’t even exist today could generate $67 billion (£50.8 billion) a year by 2028, equivalent to the value of the entire global media market in 2017, including games, music and films, the study suggests.

Digital Real Estate Destroys Physical Real Estate in Advertising

The “real estate” metaphor long has been applied in the “virtual” spaces created by operating systems ( homescreens and notifications), app...