Wednesday, December 12, 2018

Video Streaming Increases Content Fragmentation

In the streaming era, ability to offer unique content, and lots of new content, has emerged as a strategic advantage. And that has lead to a new emphasis on production of new and unique content.

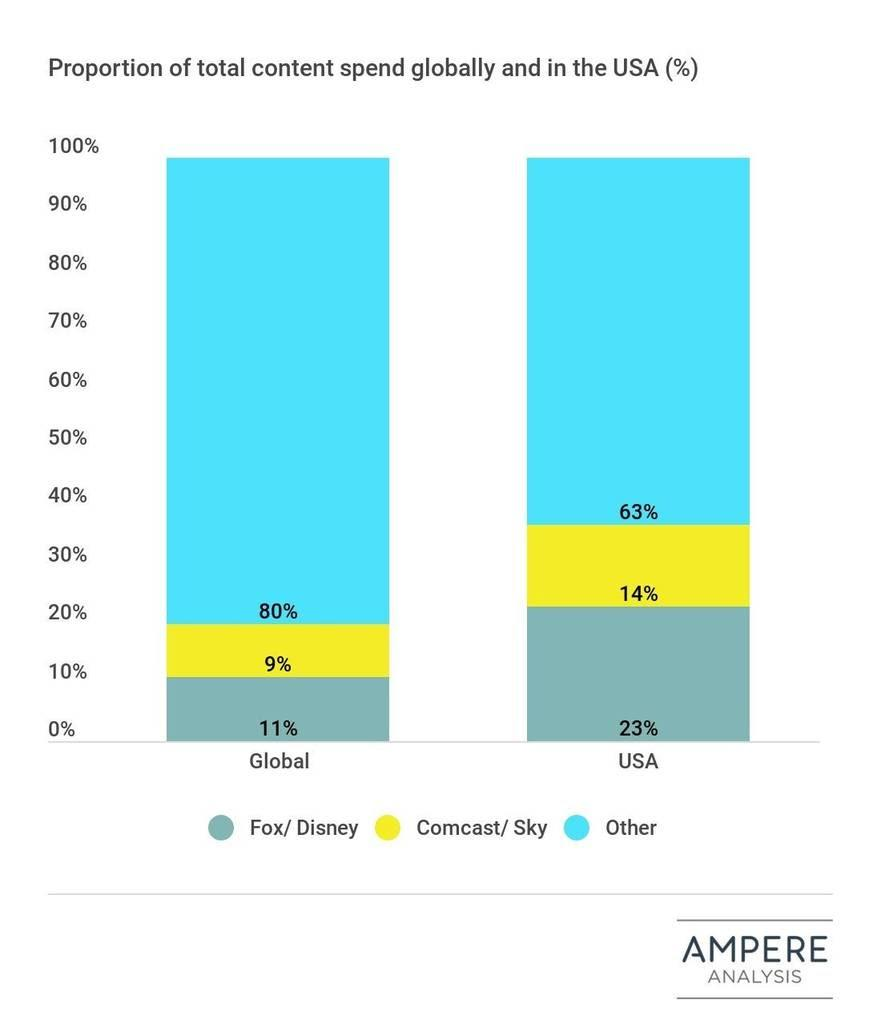
About $43 billion is spent every year by Disney and Comcast to create new content. Altogether, some $116 billion is spent to produce new video content in the United States each year, according to Ampere Analysis.

Such spending on unique content matters now that Netflix has dramatically changed the economics of the content business.

For decades, virtually all suppliers of linear subscription video services offered the same fare: a big bundle of channels. Differences were at the margins, namely the specific mix of channels offered to customers on each tier of service.

In the video streaming business, content exclusivity is the norm. And that emphasis on unique content is going to increase in the future.


The same pattern holds for TV series content. There is some overlap of programs, but most of the video is unique to Netflix, Amazon Prime or Hulu, for example.

Netflix spent about $13 billion in 2018, about 85 percent devoted to creation of new series and original content. By way of comparison, all “Hollywood” investment in new movies might be about $10 billion in 2018.

Eventually, consumers faced with a huge palette of streaming services with mostly-unique content are going to be buying multiple subscriptions to assemble the mix of content they prefer. So aggregation services are sure to arise. Ironically, increasing fragmentation is also likely to increase the perceived value of traditional big bundles, if providers of those services can win rights to offer much of their content in both linear and on-demand fashion.

Internet Access Speeds Increase 36% in One Year

Fixed broadband speeds in the United States are rapidly increasing, according to Ookla. Over the last year, average (mean) download speeds grew 36 percent, while upload speeds increased 22 percent.

In the third quarter of 2018, the average download speed over U.S. fixed networks in the U.S. was 95.25 Mbps. Average upload speed was 32.88 Mbps, Ookla says.

“On average, U.S. consumers should have few complaints about recent increases in internet speeds,” says Ookla. Of course, rarely is anything “average” relating to the internet. There are wide variances by state, rural and urban areas, anyone would note.


Comcast was was the fastest provider in the United States as a whole, in nine states and in 17 of the country’s largest cities. Cox tied for second fastest at the national level and was fastest in three states and 19 cities. Charter Communications tied with Cox at the country level and was fastest in six cities, tying for a seventh. Charter was also the fastest provider in 19 cities.

Comcast was the fastest provider in the U.S. with a “Speed Score”  of 104.7 Mbps. Verizon and Cox are close behind in a tie for second with a Speed Score of 102.57 and 101.84, respectively. Spectrum was next, followed by AT&T and CenturyLink.

The Speed Score incorporates a measure of each provider’s download and upload speed to rank network speed performance (90 percent of the final Speed Score is attributed to download speed and the remaining 10 percent to upload speed).

“The Speed Score uses a modified trimean to demonstrate the download and upload speeds that are available across a provider’s network,” says Ookla. “We take speeds from the 10th percentile, 50th percentile (also known as the median), and 90th percentile, and combine them in a weighted average using a 1:2:1 ratio, respectively.”

“We place the most emphasis on the download speeds and median speeds as those represent what most network providers’ customers will experience on a day-to-day basis,” says Ookla.

Ookla says the speed upgrades has had a significant impact on global speed rankings. The United States now ranks about seventh globally in terms of download speed.

Tuesday, December 11, 2018

App, Content Providers Have Invested $300 Billion in Internet Infrastructure Last 4 Years

In the four years since 2014, app and content providers have invested over US$300 billion in internet infrastructure. This amounts to US$75 billion per year, which is more than double the 2011– 13 average annual investment of US$33 billion, says Analysys Mason.  

Some 90 percent of that investment has been for hyperscale data centers and third-party data center colocation.

The balance of investment includes including terrestrial transport networks and international submarine cables and edge content caching.

The goal of the growing investment in infrastructure is to move content and services ever closer to end users, which helps to optimise service quality while controlling costs, Analysys Mason says.

There is a good reason why all wide area and local access network have become computing networks: most computing now occurs at cloud data centers, which requires communications with edge devices.  


In substantial part, content and app performance also drives demand for edge caching. Also, since most cross-network traffic now is video, including entertainment video, edge caching reduces the amount of traffic that has to be carried over the wide area networks.

Over time, enterprises (content and app providers) also are building their own private content delivery networks, instead of buying service from third parties.


App and content providers do, however, buy a substantial amount of hosting space from third parties. Amazon, for example,  holds more leased square footage than it owns, Analysys Mason says.

IoT Devices Already Half of Global Connected Devices

Most observers might agree that the internet of things is a future opportunity for most participants. But at least by the measure of “devices in use,” IoT already constitutes a huge share of connected devices. In fact, IoT devices might already represent half of all global connected devices, far outstripping mobile phones, according to StorageNewsletter.


Monday, December 10, 2018

Appliance-Based SD-WAN Market Perhaps $2 Billion in 2019

Appliance-based SD-WAN suppliers sold about $284 million in the third quarter of 2018, according to IHS Markit, implying an annual market in excess of $2 billion in 2019.

If managed SD-WAN services are about half the market, that also implies a service provider SD-WAN market of about $2 billion in 2019.

If the U.S. market accounts for about a third of global activity, then U.S. service providers might expect 2019 sales of perhaps $667 billion.

source: IHS Markit

Sunday, December 9, 2018

8% of U.K. Customers Buy Fastest Internet Services

Supply is different from demand. Though perhaps obvious, it is an often-confused principle when looking at the ways people buy and use internet access services. This illustration of actual fixed network internet access take rates in the United Kingdom, sorted by speed tiers, provides an example of the demand picture.

In every market, it seems, the percentage of customers who buy the fastest tier of service--typically the most expensive as well--is a small percentage of total buyers. In the U.K. market, about eight percent of buyers choose the fastest tier of service, perhaps 14 percent buying the fastest tiers.

Still, 42 percent buy the slowest tiers of service, with 21 percent paying for 10 Mbps or slower service, while another 21 percent buy speeds between 10 Mbps and 20 Mbps.

In the U.S. market, those 42 percent of customers, though buying internet access service, are not buying “broadband” service, defined as a minimum of 25 Mbps. About 44 percent of U.K. customers buy services with speeds ranging from 20 Mbps up to 100 Mbps.

The point is that, to the extent speed and price are directly related, customers generally do not buy the most-expensive product, but instead other products are are deemed good enough (enough value for the price).

Increasingly supply of the most-expensive product does not necessarily translate into an equivalent amount of buying, especially as speeds tend to increase over time, while price declines or remains the same.

How Big a Deal is Video in 5G Era?

Just how big a revenue driver mobile video will be for mobile operators in the 5G era is an open question.

That video will drive mobile data consumption seems not to be contentious. By perhaps 2024, 75 percent of mobile data consumption will be video, most would agree. Of course, consumption and revenue for various participants in the ecosystem is not the same thing.

Connectivity providers learned long ago that though a symbiotic relationship exists between demand for use of internet apps creates demand for internet access services, there is no necessary and direct relationship between use of the internet and revenue generated by provided connectivity.

Quite the reverse, in fact, is most often the case: supply has to be increased without incremental revenue being earned.

Still, many service providers have found that the most-tangible new sources of significant present revenue--troublesome as growth trends might be--come from video subscription services. There simply are not many new revenue sources capable of generating $1 billion or more in incremental revenue for any tier-one service provider.

The problems are compounded for suppliers of fixed-network communications, as voice revenues are falling, while in most developing nations, internet access is slow growing, as nearly all the growth of internet access occurs on the mobile networks.

As Ovum analysts have outlined it, linear (SLIN) and on-demand (SVOD) accounts continue to grow, even if there are gross revenue and profit margin implications from faster SVOD growth.


As this graph indicates, in developed nations, fixed internet access is saturated, or nearly saturated, implying slow future growth. Mobile broadband is reaching high levels in developed and now even in some developing markets.

Also, though it would seem that subscription video is fairly well adopted in many markets, total market statistics can mask the market share held by different suppliers. In some markets, most of the video share is gotten by cable TV operators, not telcos.

So where video is a big revenue stream, and mostly earned by cable TV, telcos can grow their own revenues by taking market share, as cable TV operators were able to grow in saturated voice markets or business services by taking share from telcos.


The bottom line is that there are few “new” revenue streams as immediately large as subscription video (both linear and fixed) that have mass market demand and drive subscription or advertising revenue at high levels.

So though much remains to be seen, prospects for mobile subscription video, given the significant and growing consumption of video on mobile devices, is an obvious place to look for future growth.


Will AI Disrupt Non-Tangible Products and Industries as Much as the Internet Did?

Most digital and non-tangible product markets were disrupted by the internet, and might be further disrupted by artificial intelligence as w...