Sunday, December 30, 2018

Smart Speakers Might Set a Record for Adoption

It looks like smart speakers might be the fastest-adopted product in consumer electronics history. By some estimates it took about five years for smart speakers to be adopted by half of U.S. homes.

By other estimates, adoption reached 41 percent only in 2018. Either way, that is fast.

source: Xapp Media

The Science Behind the Definition of Broadband as 25 Mbps

Some criticize the Federal Communications Commission for wanting to keep a minimum 25 Mbps broadband definition instead of boosting it to some other figure.  Keeping in mind that figure is a minimum floor, not a ceiling, there is clear science behind the chosen definition.


After about 20 Mbps, there is little to no improvement in user experience when using webpages, for example. The key caveat, however, is that multiple users on any account make a difference, if multiple users or devices are used simultaneously.


Generally speaking, even in a household with multiple users, only 4K ultra-high-definition streaming will stress the connection.


That noted, even in many rural gigabit speed service is available at levels that would surprise many.


And typical speeds in cities routinely are far above the minimum. “The median download speed, averaged across all participating ISPs, was approximately 72 Mbps in September 2017,” according the most-recent Federal Communications Commission report on U.S. broadband service.


Platform continues to matter. “While cable and fiber providers had median speeds ranging from 78 to 120 Mbps (with only one outlier provider with 56 Mbps median speed); the DSL and satellite providers had median speeds that ranged from 2 to 20 Mbps,” the FCC notes.


source: FCC

Is It the "Year of X"?

It’s that time of year when some feel compelled to prognosticate on “what will happen next year,” while others remind us of what did happen “last year.” And there always are a brave few who will try to capture the essence in a single phrase: “the year of X,” whatever X is said to be.

At a high level, we might well look back at such highly-distilled “year of X” predictions and note that it almost never happens. “The year of X,” whatever X is said to be, nearly always occurs (in the sense of commercial adoption or inflection point of adoption) some future year.

My simple way of describing this situation is to say that “whatever is said to be the ‘year of X’ trend almost ensures it will not be.” Of course, some will argue that is not what they mean.

Instead, they tend to mean this is the year some trend is popularized or discovered. Okay, in that sense, there is firmer--yet still tenuous--ground to stand on. Rarely does a big new thing just burst on the scene, in terms of public awareness, in a decisively-new way,

What does happen is that some arbiter “proclaims” that this has happened. It’s arbitrary.

The point is that any truly-significant new technology, platform or commercial activity takes quite some time to reach commercialization, and typically quite long after all the hype has been crushed by disillusionment.


The point is that even highly-successful new technologies can take decades to reach commercial ubiquity, even if today’s software-driven products are adopted faster than innovations of the past.

It still can take a decade for widespread consumer use of any product or service to reach 50 percent to 60 percent adoption.


Also, recall that most new products, and most new companies fail: they simply never succeed as commercial realities. Also, we sometimes overestimate the actual time any innovation takes to reach 10 percent or some other level of adoption on a mass level.

There is debate about how fast smartphones were adopted for example. Was it seven years or something greater than a decade for usage to reach half of consumers? Some estimate it took just seven years. Others have argued adoption never reached 50 percent after a decade.

And depending on how one defines “smartphone,” adoption levels of 50 percent took a couple of decades to nearly three decades.


For all such reasons, some of us tend to discount the notion of a “year of X.” Truly-significant innovations which achieve mass usage often take longer than expected to reach mass adoption levels. On the other hand, there arguably are points in time when public awareness seems to reach something like an inflection point.

In most cases it is difficult to measure the actual year when a shift becomes significant. Is it the point where 10 percent of people recognize a term, or say it is important? Or when 20 percent, 30 percent or 40 percent say so?

More significantly, at what point of innovation purchase or regular usage has something “arrived,” in a commercial sense?

80% of Results from 20% of Actions, Firms, Products, Services

Only 20 percent of actions lead to 80 percent of results, in business, life or telecom.

It usually is surprising how often a Pareto distribution occurs in business or nature. Most underlying trends in any business follow a Pareto distribution, commonly known as the “80/20” rule, where 80 percent of results flow from some 20 percent of the instances. That applies for consumer manufacturer warranty claims, for example.

In the telecom and most other businesses, as much as 80 percent of the profit is generated by serving 20 percent of the customers, while 80 percent of the revenue is generated by 20 percent of the products.

Apparently equity market returns also show a Pareto distribution.

Most workers make tradeoffs between housing costs and commuting time and hassle that show a Pareto distribution.


In the domain of athletic training roughly 20 percent of the exercises and habits have 80 percent of the impact

It is likely that similar Pareto distributions exist for all forms of internet access and communications infrastructure, where 80 percent of the value comes from 20 percent of the decisions or instances.

As a practical matter, Pareto means I have to spend more of my research time on the relatively few connectivity firms that generate 80 percent of the revenue in any particular market, even if much of my work has included managed services providers, distribution partners and others that are part of the 80 percent of firms that generate 20 percent of the revenue.

Saturday, December 29, 2018

Why Low Cost Bandwidth Now is an Imperative

Low cost bandwidth always has been a prerequisite for commercial video networks, whether of the satellite, over-the-air TV or cable TV variety, and now for any internet service provider or telco (access or connectivity provider) that wishes to sell its own subscription video products.

The reason is simple and straightforward: video is the most bandwidth-intensive consumer application, by far. Text messaging and voice require use of almost no bandwidth, while video consumers nearly two orders of magnitude more capacity, for each minute of use.

H.264 Skype video conferencing, for example, uses four orders of magnitude (10,000 times) more bandwidth than Skype messaging, for example.

So revenue per bit and data consumption are inversely related: video consumes the most bandwidth, and produces the lowest revenue per bit for a connectivity provider, while text messaging and voice use the least bandwidth and produce the highest revenue per consumed bit.


Internet traffic is in between, with some apps consuming little capacity (email), some apps consuming a moderate amount of capacity (web browsing) while others are heavy capacity consumers (video).

Mobile networks have had cost per delivered bit an order of magnitude (10 times) higher than fixed networks, as well.

The point is that,  in an era where 70 percent of traffic is video, revenue per bit becomes a major issue. That is especially true when the video is supplied by third parties, generating no direct revenue for the connectivity provider.

There are both supply and demand drivers of lower cost-per-bit performance. On the supply side, there is a tendency for communications cost per bit to fall towards zero, resulting in near-zero pricing.

Over time, better technology has resulted in networks that can deliver far-more bandwidth at far-lower costs. Moore’s Law, optical fiber, satellite and microwave platforms, hybrid fiber coax, digital subscriber line, better codecs and radios, better modulation schemes, radios and compression algorithms are some of the drivers of better performance and lower cost per bit.

But there also are demand issues. In an era where transport and access economics are driven by entertainment video, networks and retail pricing must be optimized for delivery of video, including video that has to be delivered without direct revenue earned by the ISP (third-party video).

And that dictates very-low-cost bandwidth platforms, as consumer propensity to pay is sharply limited. Any given household or any single consumer will only be willing to pay so much on all communications and entertainment services. That figure typically is single digits worth of income.

Developed nation consumers generally pay about 0.7 percent of gross national income per person for mobile internet access. Fixed network internet access, in developed countries, costs less than one percent of GNI per person.


All U.S. household spending on entertainment of any sort represented about five percent of household spending in 2017, according to the U.S. Bureau of Labor Statistics.

If about 37 percent of entertainment spending is for video subscriptions, then perhaps two percent of household spending is devoted to video subscriptions.


The point is that consumer propensity to spend on communications and subscription video is limited to relatively fixed percentages of income that do not change much, year to year. And that puts a cap on potential supplier revenue.

The implications for networks are obvious: platforms can only afford to spend so much on infrastructure, as there are limits to consumer willingness to spend on communications and subscription video.

Friday, December 28, 2018

Cable and Telco Spend 4.4 to 5 Times As Much as Mobile Operators on Capex, as a Percent of Revenue

At least in the Canadian communications market, mobile networks are three to four times less costly than fixed (cabled) networks, based on capital intensity.

With the caveat that the mobile figures might be periodically higher when a next-generation network is under construction, ongoing capital investment is about nine percent of revenues.

Telcos tend to invest about 40 percent of revenues on their networks, while cable operators tend to invest about 45 percent of revenue. Those figures probably require some explanation.

In other words, telco networks spend about 4.4 times as much on capex as mobile networks, as a percentage of revenue. Cable operators spend five times as much as mobile operators.

Cable networks have historically been less capital intensive than telecom networks. But cable operators also are energetically investing in gigabit internet access, while most telcos are more measured in their spending. In part, that is because of the high cost of upgrading copper to fiber access facilities.

But telcos likely also are measured in their assessment of revenue upside from fiber upgrades. In other words, they might rationally conclude that there is no business case for rapid fiber upgrades, especially given revenue declines and a cable TV advantage in internet access and video services.


Mobile services revenue generated 51 percent of all service provider revenue in Canada in 2017, the CRTC reports. Fixed network internet access generated 23 percent of total revenue.

Only mobility services and fixed network internet access sources grew; all others declined in 2017, CRTC says. And 34 percent of total revenue is earned by cable TV companies.


source: CRTC

Wednesday, December 26, 2018

Not Every Service Provider Can Enter the Video Content Business

Even when connectivity providers agree that development of new revenue sources beyond connectivity is essential, much disagreement remains about precisely how to develop those opportunities.

In large part, the differences of opinion arise from scale requirements. Simply put, many new opportunities require scale that most service providers do not have, and cannot get. Consider the matter of ownership of video content, or acting as a distributor of video content.

Telefonica, for example,  has been a big believer in the value of revenue sources beyond connectivity, and in recent years has boosted its video subscription revenue to about seven percent of total revenues.

And video revenues also have emerged as a huge driver of “digital” revenues. Video subscription revenue now accounts for more than half of total “digital revenues,” for example.

Digital revenues account for nearly 14 percent of total revenues, and are among the fastest-growing revenue sources available to Telefonica. Digital revenues grew more than 25 percent in the third quarter of 2018.

In part, Telefonica’s optimism about video distribution and content ownership flows from its strategic footprint in Spanish-speaking countries, which create a large market for video assets. Such footprints are hard to assemble.

Even if they wanted to become major owners of content assets, as Comcast and AT&T have become, even firms as large as Charter Communications and Verizon cannot afford to do so.

AT&T has joined Comcast as a major owner of video content, movie studios and related assets. But AT&T also has taken on huge amounts of debt to do so.

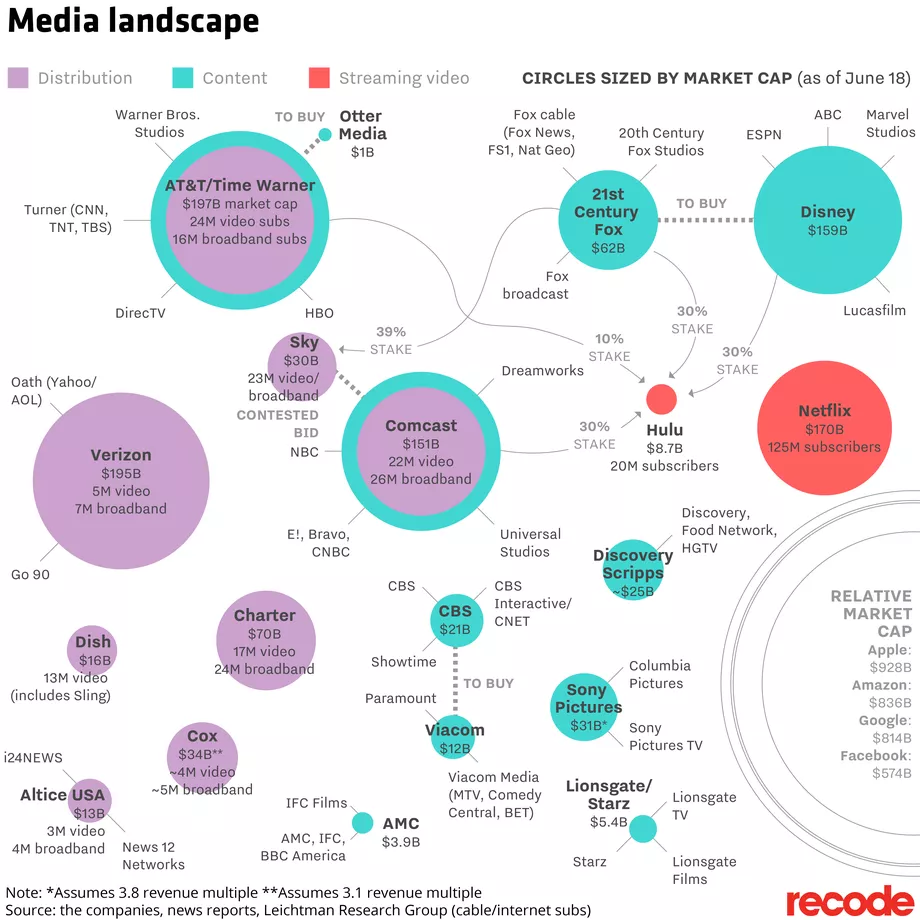
Verizon, at $126 billion annual revenue, and Charter Communications at about $40 billion annual revenue, do not have subscriber bases, free cash flow and other attributes of scale to acquire major media assets, for example, with CBS, Viacom, Discovery Scripps, AMC and Lionsgate possible acquisition targets, eventually.

Some might argue Netflix remains an acquisition target, but only for a very-well-heeled buyer, and likely far beyond the realm of possibility for a telco or cable company.


Both Comcast and AT&T are big video distribution outlets as well. In fact, AT&T is the largest provider of linear video subscriptions; Comcast the number two provider.

Of course, there also is the example of Netflix, which has become a major owner and producer of original video content, without acquiring major content production assets. Amazon Prime arguably has been less successful than Netflix, to date, but is on the same path.

One might well argue that there are few firms left with the strategic rationale and cash to consolidate the few remaining content assets of any scale in the U.S. market (Disney, CBS). And one might also argue that the logical path forward, for firms with strategic intent, is to follow the Netflix and Amazon Prime approach of directly funding and owning unique content assets.

With the development of the over-the-top streaming, firms such as Netflix and Amazon Prime have found they do not need to build, own or lease network assets to act as video distributors. Importantly, perhaps, the firms already in content include giant technology firms with lots of cash to make acquisitions and investments.

Alphabet, with $59.6 billion in media revenue (advertising revenue or content sales revenue), dwarfs Comcast, with $19.7 billion in media revenue, plus some portion of the 21st Century Fox revenues of $18.67 billion. Facebook already has about $11.49 billion in “media” revenues.

The simple conclusion is that a few connectivity providers have scale to make content ownership a viable strategy. Others will not be able to attempt that strategy, but can make a business out of content distribution. For some, not even distribution will make sense.

For many such firms, horizontal mergers, including out-of-market expansion, might be the only realistic opportunities.

Don't Expect Measurable AI Productivity Boost in the Short Term

Many have high expectations for the impact artificial intelligence could have on productivity. Longer term, that seems likely, even if it mi...