Wednesday, May 22, 2019

About 2% of Consumers Tracked by OpenVault Buy Gigabit Service

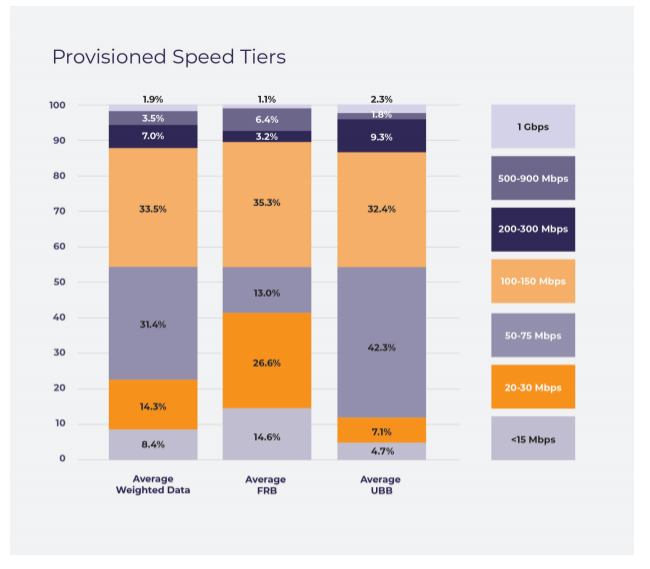
Looking at internet service provider data generated by OpenVault in the United States and Western Europe, about 1.85 percent  of subscribers tracked by OpenVault buy gigabit-speed service.

Some 3.5 percent buy services running between 300 Mbps and 500 Mbps, while seven percent buy service at speeds between 200 Mbps to 300 Mbps.

About 65 percent buy services running  between 50 Mbps and 150 Mbps.

A reasonable person might guess that the percentage of customers buying speeds of at least 200 Mbps, up to 1 Gbps, is higher in the United States than Western Europe, largely because cable TV operators, which sell the highest speeds, dominate the U.S. market.

The mid-range Comcast Xfinity services, for example, seem to run at speeds up to 200 Mbps or 250 Mbps  across most of its markets.


Home Prices and Broadband: Correlation and Causation

Does the quality of broadband service affect home prices in the United Kingdom, and if so, what is the impact? In some surveys, conducted in 2014 and since indicate consumers would pay more for a home with fast broadband.

Likewise, studies of the link between broadband and economic growth show correlation, at the very least. One study by the World Bank noted that “almost every study, despite the methodology and whether it was cross-country or single country, found a positive economic impact from fixed broadband.”

First of all, note the language: “correlation,” not “causation.”

Also, the “results were sometimes not statistically significant (particularly for developing countries).” In those cases, even correlation cannot be assumed.

A study conducted by the Public Policy Institute of California likewise notes a “positive relationship between broadband expansion and economic growth.”

But “the data and methods do not definitively indicate that broadband caused this economic growth,” the institute says. Still, some claim a causal relationship.

And some studies suggest U.S. home prices might also be affected in the same way, some suggesting difference in value could be three percent to as high as 20 percent.


But “correlation does not necessarily equal causation,” say some researchers studying broadband and home prices.

It is possible that fiber availability drives real estate prices upwards. It also is possible that other  variables “may jointly determine both real estate prices and fiber presence.
“Residential properties in markets with high-speed broadband access would be expected to have greater value,” they say. “However, good quality broadband infrastructure is also expected to be rolled out first in high-income areas with high-valued real estate.”

Logic suggests there is some room for such effects in areas with highly-variable internet access service and virtually zero effect in areas where fast internet is ubiquitous.

Some studies suggest there is a relationship between home prices and fast broadband. But lots of variables, including age, income or wealth and race also are correlated with home prices.

A recent study by Housesimple in the United Kingdom looked at the relationship between low-speed broadband and faster broadband within a single postcode. That study shows significant differences on particular streets.

Address
Postcode
Average broadband speed on the street (Mbps)
Current average house price, street (£)
Current average house price, postcode district (£)
% difference - prices on street vs postcode district
Poplar Avenue, Oldham, Greater Manchester
OL8 3TZ
0.221
105,977
116,033
-8.7
St David's Close, Worksop, Nottinghamshire
S81 0RP
0.290
107,819
185,936
-42.0
Milton Road, Cowplain, Waterlooville, Hants
PO8 8LD
0.338
270,134
329,028
-17.9
Cross Lane, Bebington, Wirral, Merseyside
CH63 3AD
0.354
195,553
231,846
-15.7
The Willows, Acaster Malbis, York, NYorks
YO23 2XE
0.463
215,593
356,282
-39.5
May Tree Lane, Waterthorpe, Sheffield, SYorks
S20 7HA
0.467
108,782
185,681
-41.4
Turnpike Road, Connor Downs, Hayle, Cornwall
TR27 5DT
0.483
282,182
256,084
10.2
Rothbury Gardens, Plymouth
PL6 8TU
0.492
241,516
224,665
7.5
Lancaster Road, Out Rawcliffe, Preston
PR3 6BN
0.549
236,558
262,371
-9.8
Moseley Wood Gardens, Cookridge, Leeds
LS16 7JB
0.551
250,796
339,084
-26.0
Blackstone Avenue, Glasgow
G53 5DW
0.669
90,834
165,505
-45.1
Fosbrooke Road, Small Heath, Birmingham
B10 9JS
0.679
147,905
153,421
-3.6
York Crescent, Stourbridge
DY8 4RT
0.718
226663
224,042
1.2
Graham Park, South Dell, Isle of Lewis
HS2 0SP
0.718
86,679
118,718
-27.0
Coppice Farm Park, St. Leonards, Tring
HP23 6LG
0.719
211,333
556,974
-62.1
Oak Close, Little Stoke, Bristol
BS34 6RA
0.831
230,314
259,671
-11.3
Maesyrhendre, Ammanford, Carmarthenshire, Wales
SA18 2BW
0.839
81,399
142,626
-42.9
Phoenix Boulevard, York
YO26 4WX
0.853
250,205
305,653
-18.1
Gratrix Lane, Sowerby Bridge, Calderdale, SYorks
HX6 2PX
0.922
123,098
188,444
-34.7
Laburnum Drive, Milton of Campsie, Glasgow
G66 8HY
0.948
196,328
198,557
-1.1


The research revealed that house prices were on average 24 percent lower on the streets with the slowest broadband speeds, about £182,983 compared to £240,031 for the postcode district.

What we do not know is whether there are other explanations for lower house prices on those streets.

Tuesday, May 21, 2019

U.S. Consumers Do Not Like Their ISPs. Price is Not the Issue

With the caveat that progress in terms of speed is improving very rapidly in the U.S. market, when adjusting for purchasing power parity, internet access in developed countries is not expensive. In this study of 2010 prices, developed country internet access costs were among the lowest in the world.


In 2016, that still was the case. Of a sampling of developed nations, adjusting for purchasing power, U.S. prices were among the lowest of the highlighted countries. But some studies show speeds and costs vary widely by city.


Still, for reasons I cannot explain (others might cite slow speeds, high prices, poor customer services, reliability) internet service providers consistently rank at the bottom of industries for customer satisfaction.

That did not change in 2018, apparently. ISPs as an industry “remain at the bottom of the ACSI rankings, unchanged at a score of 62” out of a possible score of 100.  

Mediacom improved satisfaction most in 2018, with consumer satisfaction scores up six percent, in an industry whose scores were unchanged in 2018, compared to 2017. That is partly a reflection of its status as the ISP with the worse satisfaction scores in the ISP category.

Will AI Disrupt Non-Tangible Products and Industries as Much as the Internet Did?

Most digital and non-tangible product markets were disrupted by the internet, and might be further disrupted by artificial intelligence as w...