Monday, October 12, 2020

Split Computing After Edge Computing?

These days, all networks are becoming computing networks. Also, computing and communications historically have been partial substitutes for each other. Architects can substitute local computing for remote, in other words. Mainframes, onboard, client-server, cloud and edge computing use different mixes of communications and computation resources. 


Edge computing, most agree, is among the hottest of computing ideas at the moment, and reduces use of communications capital by putting computing resources closer to edge devices. 


But technologists at Samsung believe more distribution of computing chores is possible. They use a new term “split computing” to describe some future state where computing chores are handled partly on a device and partly at some off-device site.


In some cases a sensor might compute partially using a phone. In other cases a device might augment its own internal computing with use of a cloud resource. And in other cases a device or sensor might invoke resources from an edge computing resource. 

source: Samsung


Conventional distributed computing is based on a client-server model, in which the implementation of each client and server is specific to a given developer, Samsung notes. 


To support devices and apps using split computing, an open source split computing platform or standard would be helpful, Samsung says.


With split computing, mobile devices can effectively achieve higher performance even as they extend their battery life, as devices offload heavy computation tasks to computation resources available in the network.


You might agree that the split computing concept is in line with emerging computing and communications fabrics that increasingly operate by using any available resource. Up to this point, that has been seen most vividly in device or app use of Wi-Fi. 


In the future we may see more instances of devices using any authorized and available frequency, network, tower or computing resource.


Sunday, October 11, 2020

Why Did Deregulation Happen in Telecom?

It is not so easy, even in hindsight, to explain why the world moved from viewing telecommunications as a natural monopoly to the current view that the industry is at least substantially amenable to competition, especially when using mobile and wireless platforms. Facilities-based competition remains a tougher challenge in the fixed networks area, though.


In 1996, U.S. policymakers ratified a huge shift in regulation by passing the Telecommunications Act of 1996, which deregulated local telephone and communications service. 


By doing so, lawmakers decided to test the theory that telecommunications really was not a natural monopoly, challenging more than a century of regulatory thinking and practice. In the subsequent years, regulators globally also moved to deregulate telecom. 


New technology, a desire for higher rates of innovation and higher consumer welfare were among the drivers of the change in thinking. 


It might seem obvious now, but the change from analog to digital signal processing and transmission was seen to have huge implications, such as making possible multi-purpose networks where the current state of the art was application-specific networks. 


But existing telecom law effectively prevented existing firms from exploring changes in their core businesses that technology was making possible. Local telephone service once was a monopoly, as was cable TV service. Radio and TV broadcasters were limited in each market to a few providers. 


Earlier, even attachment of personal equipment to the AT&T networks was forbidden. Users could not attach their own modems, for example, or their own phones. That was the case until 1968, when the Carterphone decision legalized attachment of personal customer premises equipment to the network.  


That change followed on smaller steps taken since the mid-1980s, when small changes in competitive regime were introduced at the edges of the business, allowing some competition to the monopoly provider AT&T in two-way radio services to some customers in a few markets. That then began a slow process of widening the amount of competition, including long-distance signal carriage. 


Electrical, gas and water systems, on the other hand, remain regulated as natural monopolies, with only a single legal supplier. As predicted, consumer benefits have been produced, in both mobile and fixed network realms. 


Between 2008 and 2019, for example, communications prices dropped, while prices for the other utility services increased. 


One example of the impact of competition in a capital-intensive industry can be seen by comparing retail price trends in the European, Japanese and South Korean electricity, natural gas and water industries--still regulated as natural monopolies--and the telecommunications business, which is deregulated and competitive. 

source: ETNO


The other trend we can note in those same markets is relatively inelastic demand for communications. In other words, people will only spend so much for communications. As a percentage of gross domestic product, for example, communications spending by households fell between 2006 and 2019, for example. 


source: ETNO


Basically, households tend to spend between 1.5 percent to 2.25 percent of GDP on communications. Other studies of household spending in developed markets show the same pattern. 


Over time, household spending on connectivity services has fallen. Nor has business spending moved much, either.  


Consumer spending does not change too much from year to year. Nor does the percentage of income spent on various categories change too much. 

source: IDC


In Myanmar, a new mobile market, spending per household might be as high as eight percent of total spending. In Australia, communications spending (devices and services) might be just 1.5 percent of household spending.  


In South Africa, households spend 3.4 percent of income is spent on communications (devices, software and connectivity). In Vietnam, communications spending is about 1.5 percent of total consumer spending.


In the United States, all communications spending (fixed and mobile, devices, software and connectivity, for all household residents) is perhaps 2.7 percent of total household spending. U.S. household spending on communications might be as low as one percent of household spending, for example.

Common Carrier Industry Prices Rise, Telecom Prices Fall

One example of the impact of competition in a capital-intensive industry can be seen by comparing retail price trends in the European, Japanese and South Korean electricity, natural gas and water industries--still regulated as natural monopolies--and the telecommunications business, which is deregulated and competitive. 


Between 2008 and 2019, for example, communications prices dropped, while prices for the other utility services increased. 

source: ETNO


The other trend we can note in those same markets is relatively inelastic demand for communications. In other words, people will only spend so much for communications. As a percentage of gross domestic product, for example, communications spending by households fell between 2006 and 2019, for example. 


source: ETNO


Basically, households tend to spend between 1.5 percent to 2.25 percent of GDP on communications. Other studies of household spending in developed markets show the same pattern. 


Over time, household spending on connectivity services has fallen. Nor has business spending moved much, either.  


Consumer spending does not change too much from year to year. Nor does the percentage of income spent on various categories change too much. 

source: IDC


In Myanmar, a new mobile market, spending per household might be as high as eight percent of total spending. In Australia, communications spending (devices and services) might be just 1.5 percent of household spending.  


In South Africa, households spend 3.4 percent of income is spent on communications (devices, software and connectivity). In Vietnam, communications spending is about 1.5 percent of total consumer spending.


In the United States, all communications spending (fixed and mobile, devices, software and connectivity, for all household residents) is perhaps 2.7 percent of total household spending. U.S. household spending on communications might be as low as one percent of household spending, for example.

Saturday, October 10, 2020

What is Cloud Native


A "cloud native" network is virtualized, fully based on apps using application program interfaces, self-healing, auto-scaling, using software as a service principles and resources. It is, in essence, no longer a nailed-up telecom network with an embedded operating system but a modern computing network that has fully separated the transport and physical layers from higher layers. 

Friday, October 9, 2020

IoT for Business Continuity During Pandemic?

Fully 84 percent of Internet of Things adopters surveyed by Savanta say IoT was “a key factor in maintaining business continuity” during the Covid-19 pandemic. IoT has helped by improving operational efficiency and creating new connected products and services, the report says. 


Savanta surveyed 1,639 businesses globally about how they’re using IoT now, on behalf of Vodafone


One example was use of IoT sensor data to allow semiconductor engineers to work remotely in Singapore, Vodafone says. An energy firm in Ireland was able to continue monitoring outside plant when technicians were unable to visit the sites in person. 


Vodafone also argues that IoT can help office managers manage social distancing as people return to the office. “The V-Space solution allows us to manage occupancy in real-time and understand where people are and whether we are maintaining social distancing,” says Richard Muraszko of Vodafone Group property. 


“V-Space also gathers data about energy use, air quality and desk occupancy, allowing us to manage the use of space and plan our real estate for the future,” he says. The system uses IoT to connect anonymous motion sensors located at each desk, as well as energy and environment management devices. 


The gathered data allows building manager to quickly identify busy areas and ensure social distancing takes place, Vodafone says.


Why Telcos Cannot Innovate

All other things being equal, people and firms who have a choice are better served choosing to work in growing industries rather than declining ones. They arguably are best served choosing new and potentially fast-growing industries. 


Likewise, connectivity providers would prefer to operate as "fast moving" innovators in new developing markets. The problem is that many such markets do not initially represent revenue scale, and for that reason are difficult for big firms to justify chasing.


Small firms have other problems, as they cannot generally compete successfully in any parts of the business that require scale (capital, people, large and extensive networks, lots of customer support). Any large connectivity market that requires scale are the best places for large tier-one providers to succeed.


That is more than a little troubling for firms and people in connectivity industries, and explains the common observation that "telcos cannot innovate."


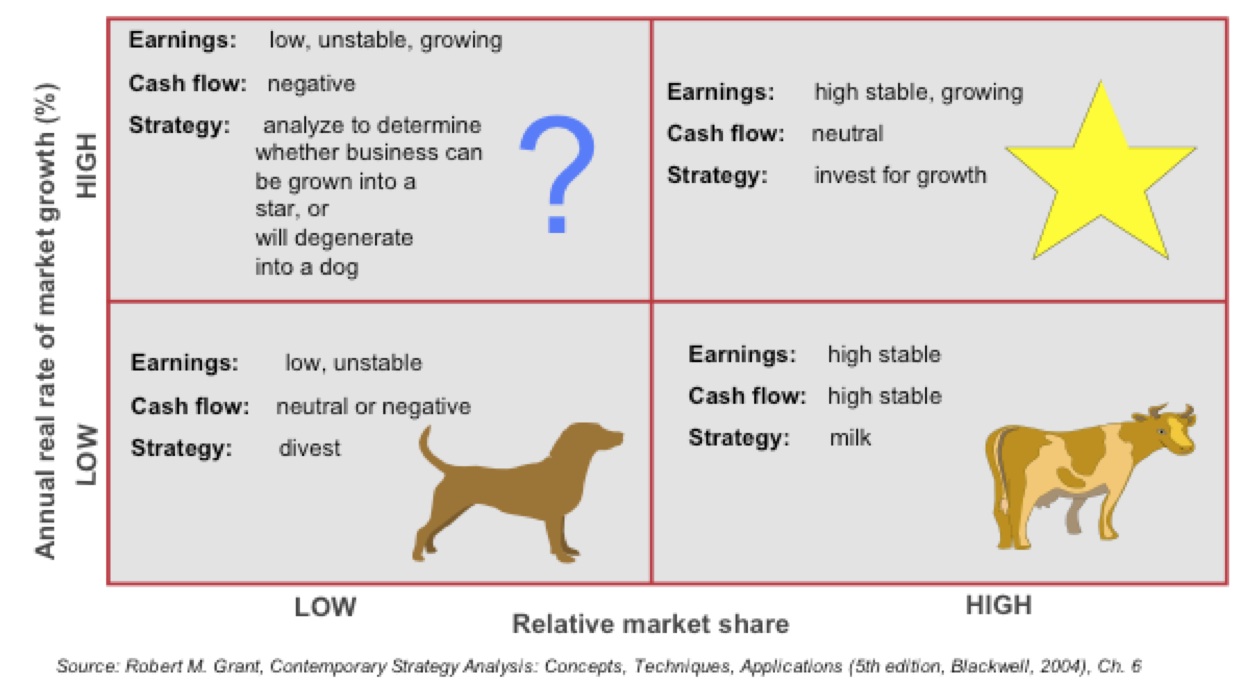
Until recently, mobile phone services have been an industry “star,” driving strong revenue growth. But mobile revenue growth rates are stalling, and overall global industry growth rates have dipped to somewhere between one percent and two percent annually (not adjusted for inflation). 


source: GSMA 


Other fixed network services have been “cash cows” at best, “dogs” at worst. For most of the 1990s, international long distance calling was a cash cow, whose revenues were to be harvested. In the second decade of the 21st century, voice services generally are products with shrinking demand, slim revenues and marginal--if any--profits.  


New high growth markets are believed to exist in the internet of things and edge computing, but remain untested, and are “question marks.”


source: John Wiley, BCC


Over the past two decades, many potential lines of business have been proposed as growth engines, including VoIP, data center operations, app stores, entertainment video services, advertising, content ownership and cloud computing (to a smaller extent)/ 


Few of those initiatives have proven viable, with the exceptions, in some cases, of entertainment video and content ownership. There is much truth to the notion that “telcos cannot innovate,” but the broader observation might be the difficulty of carving out sustainable new roles in an ecosystem. 


In a by-now familiar pattern, CSG notes that 79 percent of telecom executives are concerned about becoming commodity providers of “dumb pipe” services in an ecosystem where value and profit migrate elsewhere in the value chain. 


Those beliefs also are clear in an Accenture white paper produced about digital transformation in the telecom industry by the World Economic Forum. To some extent, the industry’s problems are perhaps even deeper. Until recently, mobile subscription growth, and a shift of revenue drivers from voice to texting--then texting to mobile broadband--have been revenue “stars,” offering high rates of growth. 


But the mobile market clearly is maturing, with negative to slow rates of growth in developed markets, and slowing growth rates in developing markets. Note that the present growth driver in developed markets--mobile broadband--has been slowing since 2008. 


source: Researchgate 


Subscriptions still have room to grow in developing markets, but at some point even those markets will saturate. So growth (revenue and accounts) is a key industry challenge. 


Connectivity services firms with small market share have to compete differently from firms with large market share. For starters, small firms do not typically have access to huge amounts of capital, or the ability to hire huge numbers of people. 


That means they always must find niches of one sort or another, specializing and segmenting their customer opportunities. Where tier-one service providers must “think big” when chasing new revenue sources, smaller firms have to “think small.” 


Where a $1 billion opportunity is almost the bottom limit of what a tier-one service provider can try to address, a $1 billion opportunity is too large for many small firms to try and seize. Basically, the small firm strategy is to “go where the big guys will not follow” and will not try and compete. 


Historically, that has been clear in segments such as enterprise phone switches, local area networking, Wi-Fi and specialty mobile segments, for example, where connectivity providers have been content to leave those segments to others. 


The early broadband access market using digital subscriber line as the platform initially was left to independent retailers, for example. Prior to that, the dial-up internet access market similarly was left to third party providers. 


LIkewise, small firms typically lack the resources to diversify into new parts of a value chain, innovate technologically or compete by offering superior credit policies or other financial inducements. They typically cannot be leaders in high-growth, low-share new markets with high investment costs and low sales volumes.


source: Robert Grant  


Where small firms often can try and add value is by providing more intensive or customized support, especially for any market segments or products that are relatively low volume and routinely customized. 


Rule of Three in Kenya Mobile

Stable industries tend to have a market share pattern, as noted by Bruce Henderson, founder of the Boston Consulting Group. "A stable competitive market never has more than three significant competitors, the largest of which has no more than four times the market share of the smallest,” Henderson argued.


Sometimes known as “the rule of three,”  he argued that stable and competitive industries will have no more than three significant competitors, with market share ratios around 4:2:1.


The mobile services market in Kenya illustrates that pattern, where Safaricom, the market leader, has more than twice the share of the number-two provider Airtel, which in turn has twice the share of the number-three provider Telekom Kenya. That same pattern tends to hold for profit margins as well.  


source: Communications Authority of Kenya 


One sees this pattern in some telecom markets. Looking at market share and return on invested capital for the three largest telecom providers in Thailand, China, and Indonesia since 2015, you can see that financial return and market share tend to be directly related.


The real-world structure does not precisely match the rule of three predictions, of course, with Thailand having the almost-perfect correspondence between predicted results and actual results, according to a 2016 analysis by Reperio Capital. 


In many other markets, two observations are apt: where the 4:2:1 pattern does not exist, markets either are not competitive, or not stable, or both. And though we might be tempted to think such patterns exist mostly for capital-intensive industries, the pattern seems to hold in most industries.  


Source: Reperio Capital


My rule of thumb incorporating the “rule of three” is that the leader has twice the share of number two, which in turn has twice the share of provider number three. In Thailand, the general pattern holds.China and Indonesia do not fit the stable pattern so well. 


In Thailand the pattern holds well. The leader has 53 percent share, number two has 31 percent and number three has 17 percent share.


If those markets are actually competitive, some further change in market share would be expected, with the market leader losing share, gained by a clear and stronger number two.


AI Will Improve Productivity, But That is Not the Biggest Possible Change

Many would note that the internet impact on content media has been profound, boosting social and online media at the expense of linear form...