Monday, December 14, 2020

Most Big IT Projects--Including "Digital Transformation"--Fail

Of the $1.3 trillion that was spent on digital transformation--using digital technologies to create new or modify existing business processes--in 2018, it is estimated that $900 billion went to waste, say Ed Lam, Li & Fung CFO, Kirk Girard is former Director of Planning and Development in Santa Clara County and Vernon Irvin Lumen Technologies president of Government, Education, and Mid & Small Business. 


That should not come as a surprise, as historically, most big information technology projects fail. BCG research suggests that 70 percent of digital transformations fall short of their objectives. 


From 2003 to 2012, only 6.4 percent of federal IT projects with $10 million or more in labor costs were successful, according to a study by Standish, noted by Brookings.

source: BCG 


IT project success rates range between 28 percent and 30 percent, Standish also notes. The World Bank has estimated that large-scale information and communication projects (each worth over U.S. $6 million) fail or partially fail at a rate of 71 percent. 


McKinsey says that big IT projects also often run over budget. Roughly half of all large IT projects—defined as those with initial price tags exceeding $15 million—run over budget. On average, large IT projects run 45 percent over budget and seven percent over time, while delivering 56 percent less value than predicted, McKinsey says. 


Significantly, 17 percent of IT projects go so bad that they can threaten the very existence of the company, according to McKinsey . 


Beyond IT, virtually all efforts at organizational change arguably also fail. The rule of thumb is that 70 percent of organizational change programs fail, in part or completely. 


There is a reason for that experience. Assume you propose some change that requires just two approvals to proceed, with the odds of approval at 50 percent for each step. The odds of getting “yes” decisions in a two-step process are about 25 percent (.5x.5=.25). In other words, if only two approvals are required to make any change, and the odds of success are 50-50 for each stage, the odds of success are one in four. 


source: John Troller 


The odds of success get longer for any change process that actually requires multiple approvals. Assume there are five sets of approvals. Assume your odds of success are high--about 66 percent--at each stage. In that case, your odds of success are about one in eight for any change that requires five key approvals (.66x.66x.66x.66x.66=82/243). 


So it is not digital transformation specifically which tends to fail. Most big IT projects fail.

Saturday, December 12, 2020

Work from Home and the Solow Productivity Paradox

It is easy, but perhaps wrong, to attribute many types of change to “Covid-19” or the responses made to the pandemic. To be sure, the prevalence of work-from-home, learn-from-home modes required by governments to slow the spread was a precipitating event. It arguably speeded up trends already in place and convinced larger numbers of people and firms to consider joining trends, such as substituting Zoom video conferences for older meeting formats. 


With good reason, increased amounts of work from home are viewed as a permanent shift in venues where many types of work are done on a routine basis. The conventional wisdom is that hybrid models will dominate, with more workers spending parts of the week working from home, rather than “in the office.”


source: Researchgate  


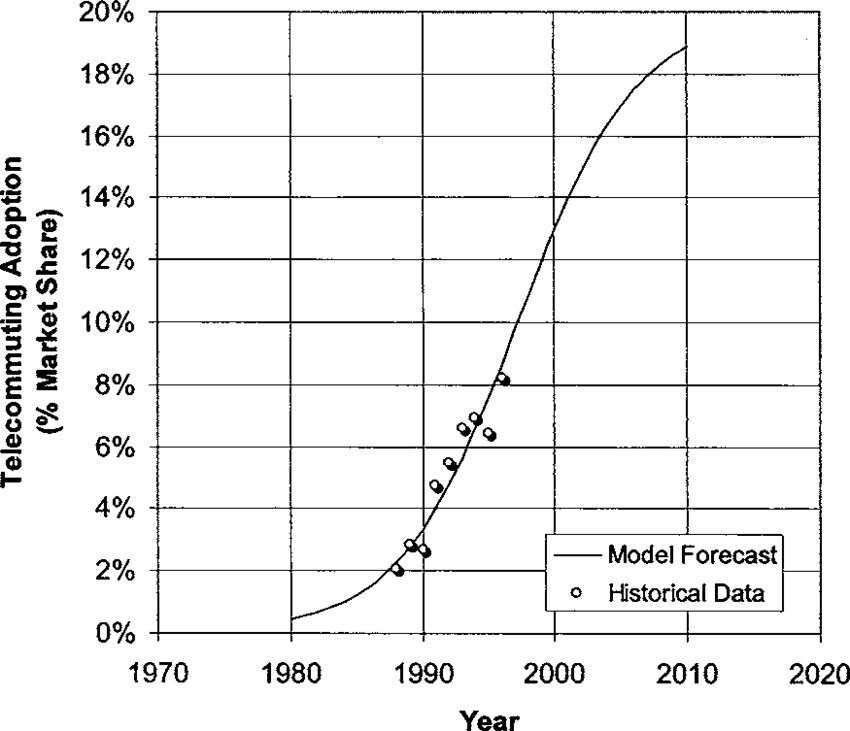
But it is worth noting that this “remote work” trend has been in place and growing for more than 50 years, though we used to call it “telecommuting.” 


source: Federal Reserve Bank of St. Louis 


The point is that forecasters have expected a huge increase in remote work patterns for quite some time. 
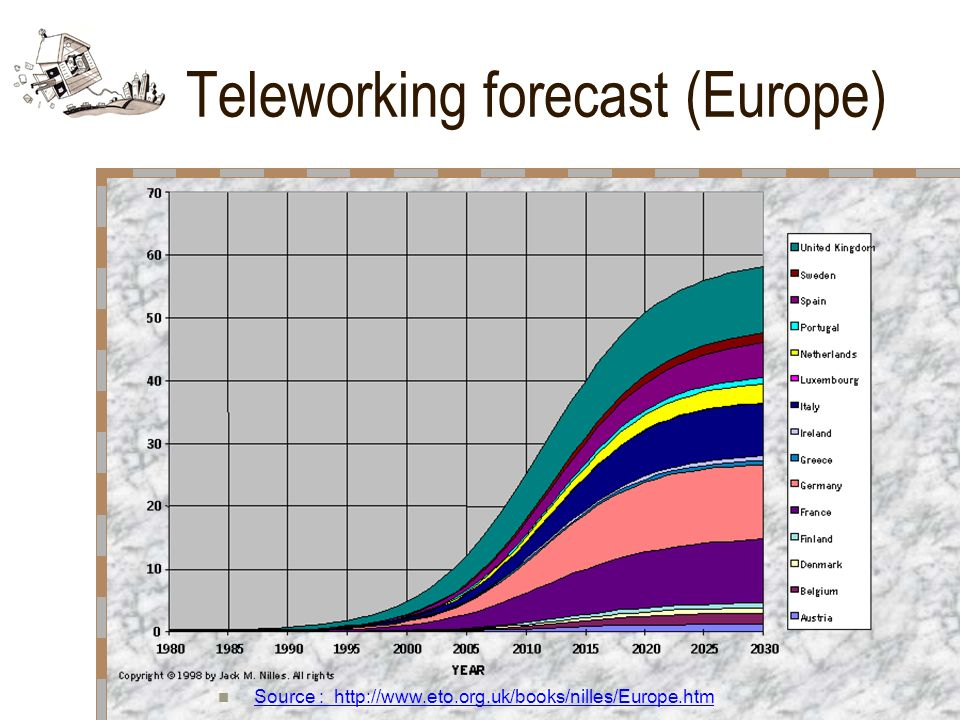
Source


So it might be safe to say that belief in permanent change of remote work arrangements will happen. But the change might be more gradual than some believe. 


There might be unexpected barriers in the form of cost issues, as has proven true in the past, for at least some firms. 


More importantly, it is hard enough to measure office worker productivity at all. It will be devilishly difficult to determine what impact on productivity remote work in large doses might produce. 


Obviously, at some level of productivity (higher, same, lower), many types of work can be performed remotely, at home. 


source: McKinsey


But productivity is an issue. To be sure, most of us assume that higher investment and use of technology improves productivity. That might not be true, or true only under some circumstances. 


Investing in more information technology has often and consistently failed to boost productivity.  Others would argue the gains are there; just hard to measure.  There is evidence to support either conclusion. 


Most of us likely assume quality broadband “must” boost productivity. Except when it does not. The consensus view on broadband access for business is that it leads to higher productivity. 


But a study by Ireland’s Economic and Social Research Institute finds “small positive associations between broadband and firms’ productivity levels, none of these effects are statistically significant.”


“We also find no significant effect looking across all service sector firms taken together,” ESRI notes. “These results are consistent with those of other recent research that suggests the benefits of broadband for productivity depend heavily upon sectoral and firm characteristics rather than representing a generalised effect.”


“Overall, it seems that the benefits of broadband to particular local areas may vary substantially depending upon the sectoral mix of local firms and the availability of related inputs such as highly educated labour and appropriate management,” says ESRI.


Most of us are hopeful about the value of internet of things. But productivity always is hard to measure, and is harder when many inputs change simultaneously. Consider the impact of electricity on agricultural productivity.


“While initial adoption offered direct benefits from 1915 to 1930, productivity grew at a faster rate beginning in 1935, as electricity, along with other inputs in the economy such as the personal automobile, enabled new, more efficient and effective ways of working,” the National Bureau of Economic Research says.  


There are at least two big problems with the “electricity caused productivity to rise” argument. The first is that other inputs also changed, so we cannot isolate any specific driver. Note that the automobile, also generally considered a general-purpose technology, also was introduced at the same time.


Since 1970, global productivity growth has slowed, despite an increasingly application of technology in the economy overall, starting especially in the 1980s. 


A corollary: has information technology boosted living standards? Not so much,  some say. The absence of huge productivity gains has created what economists call the “productivity paradox.”


Basically, the paradox is that the official statistics have not borne out the productivity improvements expected from new technology.


Still, the productivity paradox seems to exist. Before investment in IT became widespread, the expected return on investment in terms of productivity was three percent to four percent, in line with what was seen in mechanization and automation of the farm and factory sectors.


When IT was applied over two decades from 1970 to 1990, the normal return on investment was only one percent.


This productivity paradox is not new. Information technology investments did not measurably help improve white collar job productivity for decades. In fact, it can be argued that researchers have failed to measure any improvement in productivity. So some might argue nearly all the investment has been wasted.


Some now argue there is a lag between the massive introduction of new information technology and measurable productivity results, and that this lag might conceivably take a decade or two decades to emerge.


Work from home trends were catalyzed by the pandemic, to be sure. Many underlying rates of change were accelerated. But the underlying remote work trends were there for decades, and always have been expected to grow sharply. 


Whether that is good, bad or indifferent for productivity remains to be seen. The Solow productivity paradox suggests that applied technology can boost--or lower--productivity. Though perhaps shocking, it appears that technology adoption productivity impact can be negative.

Friday, December 11, 2020

Is Gigabit Speed Really Available to more than 80% of U.S. Housing Units?

Some question statistics that gigabit internet access now is available (can be purchased) by about 84 percent of U.S. residents, especially when based on data reported to the Federal Communications Commission. 


Others might find the claim that gigabit access is not that widely available a bit incongruous, but not for reasons of FCC data reporting. The NCTA says 80 percent of U.S. homes now can buy gigabit speed internet access, up from about 63 percent in 2018.  


And since cable TV operators in the U.S. market have at least 70 percent installed base, looking only at cable TV data provides a non-duplicated view of access speeds. Assume for the moment zero supply of gigabit services by other internet service providers. 


According to the U.S. Census Bureau there are about 137.9 million U.S. housing units. Not all those units are occupied at any particular time, but ignore that for the moment, 


Roughly 8.8 percent of units are not occupied, typically. Vacant year round units represented 8.8 percent of total housing units, while 2.6 percent were vacant for seasonal use. 


Approximately 2.2 percent of the total units were vacant for rent, 0.7 percent were vacant for sale only and 0.6 percent were rented or sold but not yet occupied. Vacant units that were held off market comprised 5.3 percent of the total housing stock – 1.5 percent were for occasional use, 1.0 percent were temporarily occupied by persons with usual residence elsewhere (URE) and 2.9 percent were vacant for a variety of other reasons.


Add it all up and 88.6 percent of the housing units in the United States in the first quarter of 2020 were occupied and 11.4 percent were vacant, according to the U.S. Census Bureau. 


For the moment, ignore that. Retail consumer networks are not built to pass only “occupied” dwellings, but all dwellings in an area. If there are 137.9 dwelling units, with an average of 2.6 persons per household, then coverage of 80 percent of U.S. homes equates to 110.3 million locations. At 2.6 persons per home, that suggests 287 million people are in living units able to buy gigabit internet access from cable operators alone. 


If the U.S. population is 382.2 million, then some 75 percent of the U.S. population can buy gigabit internet access from cable operators alone, assuming no coverage provided by telcos or independent internet service providers. 


Those figures track closely with the FCC figures for “people” able to buy gigabit internet access. If you know anything about the way hybrid fiber coax networks are built, you also know that internet access speeds are designed to be the same at every end user node on the network. 


The architecture uses an optical fiber to node design, with very short electrical repeater segments (generally a few amplifiers) between the optical node and any location. Compared to the archaic all-electrical designs, that means top speeds do not decline with distance to any appreciable extent. 


The point is that if an HFC network is designed and built to support gigabit speeds, it will provide speeds close to that at all locations reached by the network, much as a fiber-to-home network would do. 


The point is that I cannot think of a good reason why the cable claim of passing 80 percent of U.S. home locations with gigabit service available is not believable. 


And that is assuming zero non-overlapping coverage by all other ISPs. After all, all ISPs build gigabit facilities where they believe the demand is greatest. Those also are the places where competition arguably is greatest, such as high-income suburban areas. 


That noted, surveys of rural telcos conducted by the NTCA have found that 25 percent of respondents offer gigabit internet access, while gigabit speeds are offered by a growing number of U.S. ISPs.  


Both Cloud Computing and U.S. Mobile Markets Remain Contestable

Neither the global cloud computing or U.S. mobile markets are stable, in the sense that a clear market share pattern has settled in, with challengers largely unable to change their share positions. That means the markets remain contestable.


After the merger of T-Mobile and Sprint, Verizon has about 42 percent market share (subscribers). But T-Mobile has 29 percent and AT&T about 27 percent. 

source: Evercore 


We should anticipate eventual changes in share. 


"A stable competitive market never has more than three significant competitors, the largest of which has no more than four times the market share of the smallest,” Bruce Henderson, founder of the Boston Consulting Group has argued.


Sometimes known as “the rule of three,”  he argued that stable and competitive industries will have no more than three significant competitors, with market share ratios around 4:2:1.


If you look at market share in the “cloud computing as a service” industry, one also does not yet see that pattern, suggesting major market share shifts are likely. But most of the activity, all other things being equal, will happen at positions two to four. 


AWS now has 32 percent share. By some estimates Microsoft has 19 percent share. Google Cloud about seven percent share. The rule of three would predict either that AWS eventually would have more share, or that number two would have less share, or both. 


I believe the reported numbers overstate Microsoft’s share and understate Google’s share, however. 


source: Canalys 


If a “like to like” analysis of “computing as a service” revenues are made, Microsoft’s actual cloud revenues are far smaller than reported. 


The problem is that the way Microsoft reports revenue dramatically skews the results. 


Azure, which includes cloud computing revenue, also includes sales of the Windows operating system, productivity suites, Xbox, Surface and advertising. 


Also, keep in  mind that Azure cloud computing also includes server sales, not just “cloud computing as a service” revenues. 


The “intelligent cloud” segment of Azure represents only about 35 percent of total Azure revenue. Another third of Azure revenue comes from productivity suite revenues. Also, 32 percent of Azure revenue comes from operating systems, productivity suites, Xbox, Surface and advertising. 


I personally do not consider those revenue sources a “like to like” comparison with AWS cloud computing as a service revenues. Actual Azure cloud computing revenue. might be as low as $4 billion a quarter. The point is that any analysis of cloud computing market share based on Azure revenue is incorrect. 


Azure cloud computing might be only a bit larger than Google Cloud, which generated about $3.4 billion quarterly revenues recently. 


If so, AWS market share is understated and Microsoft’s share is vastly overstated. At $4 billion quarterly revenue, Microsoft likely has about 11 percent share. Google might have about nine percent share. 


If AWS generated about $11.6 billion in revenue in the third quarter of 2020, then AWS did have about 32 percent of global cloud computing market share. 


A corollary is that, all things being equal, it will be very hard to supplant Amazon Web Services as the market leader. It is unclear at this point which firm emerges as a stronger number-two provider. Many seem to be betting on Microsoft, based on its apparent or reported growth rate. 


In the absence of better data, it is hard to say.


Thursday, December 10, 2020

When Commuting Time Lessened, Did Productivity Increase?

The productivity impact of work-from-home rules--especially the reduction in commuting time--will be hard to assess, but one new study suggests little change for independent contractors, but an increased work day for managers.


Reviewing time-use diaries of 1,300 U.S.-based knowledge workers, collected in the summers of 2019 and 2020, professors Andrew Kun, Raffaella Sadun, Orit Shaer, and Thomaz Teodorovicz found a reduction in commuting time to work of about 41 minutes, on average, because of extensive work-from-home rules. 


Intuitively, you might guess that has led to an increase of productivity. The study is far more nuanced. 


“Independent employees (i.e., those without managerial responsibilities) reallocated much of it to personal activities, whereas managers just worked longer hours and spent more time in meetings,” the researchers note. 


Independent contractors simply used the extra free time for non-work activities. Managers had to spend more time in meetings. 


“For managers, the increase in work hours more than offset the loss in commuting time: Their work day increased on average by 56 minutes, and the time they spent replying to emails increased by 13 minutes,” the researchers say.


That might imply that productivity did not increase, since there was “no increase in total time spent working,” but the work day lengthened a bit, the researchers note.  “The work-day span increased by 56 minutes for managers but did not change for independent employees.” 


It is not possible to directly assess “productivity” results based strictly on the input measure of “time spent,” but if measurable “output” did not change, then productivity measured as “results divided by work time” might well have dropped, for managers, as they had to spend more hours working to produce the same output. 


“These changes were even larger for managers employed by large firms, who spent 22 minutes more per day in meetings, and 16 more minutes responding to emails,” (compared to the average manager) they report. 


Without quantitative output measures, all we can do is look at inputs, when trying to assess the impact of lessened commuting time. If output remained constant, which is what proponents of WFH productivity believe, then longer work hours for managers translates into lower productivity (more hours to create the same output).


As always, it is nearly impossible to quantify the output of an office or knowledge worker, which is what we would need to have to assess productivity changes. That is not going to stop suppliers of remote work products from claiming productivity is higher, the same or at least not impaired by remote work.


When Will IoT Growth Return to Pre-Pandemic Levels?

The impact of COVID-19 on the demand for IoT applications has been mixed, the World Economic Forum says in a report.  Still, by 2025 or so, the growth pattern should return to its 2019 growth pattern, if not accelerate, WEF says. 


“Many enterprise and smart city projects have been put on hold as businesses cope with the pandemic-driven economic slowdown and governments reprioritize budgets in response to the health crisis,” WEF says.


There has been an increase in use of connected cameras and contact-tracing uses, however.


But IoT deployments arguably have dipped because of the pandemic, at least momentarily. Overall, global consumer spending on smart home devices may drop to $44 billion in 2020, from $52 billion in 2019, Strategy Analytics estimates.


source: World Economic Forum 


Growth in demand among consumers for connected cars has slowed to less than two percent in 2020, GSMA estimates. 


But global shipments of voice-controlled smart home devices are expected to grow by close to 30 percent in 2020, driven by the dramatic increase in people working from home, according to ABI Research.


IDC forecasts that global IoT spending will return to double digit growth rates in 2021 and achieve a CAGR of 11.3% through to 2024. The GSMA's 2025 forecast remains unchanged as well.  


Wednesday, December 9, 2020

Messaging Business Models Based on Ads? Probably Not

No task is more fundamental for any business or organization than finding a sustainable revenue model. And the task is doubly important whenever any successful revenue model is under attack. And that is the case for most firms, in most industries these days. 


In the computing, retailing, lodging, travel, transportation, software, communications and media industries, business models--all the functions any company or organization must undertake to sustain its business or mission--have changed over the last 20 years. 


And chief among the changes is the task of discovering” a revenue model, either to replace a dying source or create one for a “free to use” application. Text messaging (short message service) and provide an obvious examples.  


source: Ovum 


The same problem exists with mobile voice. As subscribers grow, and usage grows, revenue has remained flat, or shrunk. By 2021, Ovum researchers have predicted, fixed network voice will represent only about 7.7 percent of total global telecom revenues, compared to mobile at 59 percent of total. 


Fixed network broadband will represent 18 percent of total revenues, while subscription TV represents about 15 percent of total revenues.


The global telecoms & media market will generate $1.58 trillion in revenues in 2021 from 11.96 billion connections, according to Ovum, which counts fixed network, mobile network and video services in its tally.


source: techneconomyblog.com 


For mobile operators, the devastation of text messaging revenue drives the effort to create new roles for text messaging as a business-to-consumer marketing platform. In many instances, unlimited use of domestic text messaging has become a feature of a mobile subscription, and not a direct revenue source. 


“Unfortunately for most telcos, P2P SMS has become essentially valueless, since they have had to bundle unlimited SMS into mobile tariffs to remain relevant to their customers, an increasing number of whom use chat apps such as WhatsApp, WeChat and Facebook Messenger,” said Pamela Clark-Dickson, practice leader of Ovum’s Communications and Social team. 


For Facebook, the effort is to monetize WhatsApp without relying on advertising, Facebook’s traditional revenue model. And Facebook believes it can create e-commerce, payment and marketing service revenue using WhatsApp, without relying on advertising. 


Though it once was unthinkable that a market-leading software company could base its revenues on advertising rather than sales of shrink-wrapped software licenses, it has happened. But reliance on a single revenue model will strike most executives as risky, especially if there are customer objections and there are other viable additional models. 


So it is that Facebook is working to monetize personal messaging as part of a broader effort to create a marketing and commerce platform that makes money as a “platform” connecting merchants and customers, instead of messaging remaining a person-to-person communications function.


That is the same application-to-person business mobile operators and app providers are trying to create with text messaging, as global text messaging revenues fall


The issue, as always, is whether text messaging can be built into a platform, as Facebook hopes WhatsApp--combined with other Facebook resources--hopefully can become. At this point, few likely believe mobile operators are positioned as well as Facebook to create such a platform. 


But the effort must be made, if mobile operators hope to stem the erosion of text messaging revenues overall. And that is a core business model issue.


AI Will Improve Productivity, But That is Not the Biggest Possible Change

Many would note that the internet impact on content media has been profound, boosting social and online media at the expense of linear form...