Tuesday, May 25, 2021

Is IoT Digital Transformation?

The global IoT market is projected to reach $1.5 trillion by 2030, says Ericsson. Presumably that includes the value of devices, software and services used to support IoT. Ericsson also links that growth to possibilities for “digital transformation.” 


Ericsson does not specifically define the term, but suggests it has to do, at least in part, with listening to customers; focusing on users; using data to generate insights and applying insights to create new products. 


It is that last suggestion--creating new products--that is the connection to “digital transformation.” One working definition of DX is that it is the application of technology to change current business models.


A business model is everything an organization does to make a profit, including customers, products, sales methods, fulfillment and monetization methods. To the extent that IoT creates new customers and products; uses different sales methods or fulfillment or new revenue sources, IoT is applied digital transformation.  


By 2026, there will be almost 27 billion connected devices, says Ericsson.


Friday, May 21, 2021

Telcos Have Stopped Losing Home Broadband Market Share to Cable

U.S. telcos have about 31 percent share of the installed base of U.S. home broadband connections, while cable operators continue to hold about 69 percent share, according to Leichtman Research data. 


Cable operators garnered about 92 percent of the net new additions in the first quarter of 2001, while telcos added about eight percent of the net new additions. 


That is modestly good news for telcos. For most of the last 20 years telcos have seen modest, if any, market share gains and almost continual shrinkage of the installed base. In some years past cable operators have gained more than 100 percent market share, as telco subscriber counts were negative. 


Over the past decade or so, cable has gained a bit more than 80 percent market share in every quarter, so one might argue that telco net additions have waned a bit, even if telcos have stopped losing market share every quarter in 2020.


Broadband Providers

Subscribers at end of 1Q 2021

Net Adds in 1Q 2021


Cable Companies


Comcast*

31,034,000

460,000

Charter

29,234,000

355,000

Cox**

5,435,000

55,000

Altice

4,370,800

11,600

Mediacom

1,454,000

16,000

Cable One

880,000

23,000

WOW (WideOpenWest)

823,800

10,000

Atlantic Broadband

511,004

6,383


Total Top Cable

73,742,604

936,983


Wireline Phone Companies


AT&T

15,435,000

51,000

Verizon

7,193,000

64,000

CenturyLink/Lumen^

4,728,000

(39,000)

Frontier

3,052,000

(17,000)

Windstream

1,122,300

13,000

Consolidated

794,224

2,024

TDS

501,700

8,400

Cincinnati Bell

437,600

1,500


Total Top Telco

33,263,824

83,924


Total Top Broadband

107,006,428

1,020,907


source: Leichtman Research 


While the turnabout does not necessarily mean telcos will challenge cable for the lead in installed base or market share, small gains are a vast improvement over installed base and share losses for two decades.


Wednesday, May 19, 2021

Can Tier-One Telcos Grow Enterprise Revenue?

Can Verizon Business grow revenue four percent per year? It might be able to do so. It is not so clear that more than a handful of tier-one service providers will be able to do so, though. 


One might ask the question in a broader way: can most tier-one service providers in mature markets do so?


Service providers in developing markets arguably can do better, but major service providers in developed markets have generally seen enterprise revenue contract in recent years.


U.S. fixed network business revenues are expected to keep falling. “The U.S. business wireline telecom services market will continue to slowly decline, shedding roughly $7 billion in revenue from 2019 to 2024,” said Amy Lind, IDC research manager, 


Globally, the GSMA says, “enterprise revenue is not growing significantly (at low single digit rates for many operators).


Many would argue T-Mobile is poised to grow far faster than that, based on the 10 percent share T-Mobile now has of enterprise customer spend in the mobile segment of the business. 


T-Mobile expects to grow its enterprise share (mobility) to more than 20 percent by 2025. That would require a growth rate of nearly 19 percent annually. Verizon has both fixed and mobile assets to leverage, and includes enterprise; wholesale; small and medium business and public sector customers in its domain. 


Other service providers lump small business customers into a mass market category primarily representing consumer revenues. 


T-Mobile also expects to grow its share of rural and suburban area customers from the low teens to nearly 20 percent in the same time frame. 


Challengers can grow by taking share, but market share leaders will likely have to look for new revenue sources, as the share leaders will be challenged to keep the share they presently have. 


That might come in a variety of ways. 


source: CapGemini 


source: CapGemini 


Verizon arguably already earns more IoT revenue than many other service providers. 

source: GSMA


And Verizon has a faster enterprise revenue growth rate than many other major providers. 


source: GSMA


Tuesday, May 18, 2021

Faster Decline Coming for Linear TV Business

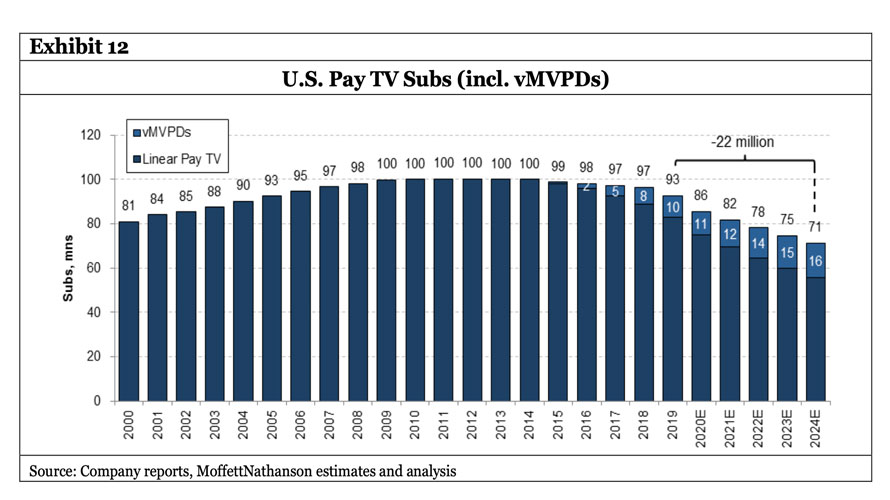
Subscription TV revenue appears poised to begin a faster and non-linear rate of decline, after relatively muted rates of change since revenue in the U.S. business peaked about 2011. 


And that decline might hit both the subscription revenue stream as well as advertising, the twin drivers of revenue in the linear TV subscription business. To about 2025, forecasters believe the rate of decline of linear TV will accelerate. 


Some believe the rate of decline--while accelerating--will only amount to about a 20 percent in the four years between 2020 and 2024, for example. That would be a relatively mild decline of about five percent a year. But that is significantly less than others believe will be the case. 


source: MoffettNathanson


Linear TV ad spend, for example,  is likely to drop more than 50 percent in the next five years, from $70 billion to roughly $34 billion, according to Ark Invest. Since ad buys are based on viewership, that suggests a drop in subscribers and viewing by half, as well, or a rate of decline between 13 percent and 16 percent per year. 


source: Ark Invest 


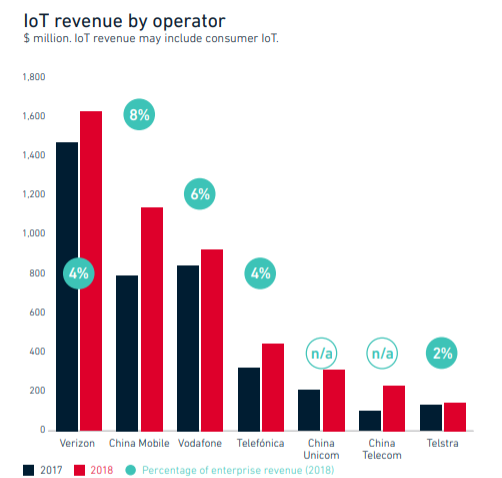
For most connectivity-based services, usage is correlated with perceptions of value, and ultimately is a sign of future consumer behavior, whether that be messaging, voice communications, data consumption or use of video services. 


In that regard, a huge drop in linear video viewing has recently occurred, on the order of 50 percent in 2019 alone, ThinkNow Media says. 


Convergence Research estimates 2020 U.S. linear video revenue declined six percent to $94.7 billion. The group forecasts a decline of 6.5 percent to $88.5 billion in 2021 and a decline of 10 percent in 2023 to $73.4 billion. 


That rate of decline matters because any quantity that declines 6.5 percent a year is cut in half in 10 years. If the higher 10 percent attrition rate continues, linear video revenue is cut in half in less than seven years. 


But the rate of change is accelerating, the group says. By about 2023, the rate of abandonment of linear video will reach 13 percent, Convergence Research estimates. 


“At current run-rate OTT access revenue will exceed TV access revenue in 2024,” the group says. 


Convergence Research estimates that US OTT revenue grew by 35 percent to $29.6 billion in 2020, and forecasts 35 percent growth to $39.9 billion for 2021, and $59.4 billion for 2023 (double 2020). 


Convergence Research forecasts average OTT subscriptions will increase to five per OTT household in 2023, up from an average of three subscriptions in 2020.


All of that explains the high interest in growing video streaming services, the importance of broadband access in retail connectivity supplier business plans, the move by cable operators into the mobile business and the hopes many have for edge computing and internet of things as drivers of new revenue.


Monday, May 17, 2021

Cash Flow or Ownership: Does it Matter?

AT&T’s decision to merge Warner Media with Discovery will inevitably be seen as an unwinding of prior company strategy, following the DirecTV partial asset sale. 


It would not be the first time, as AT&T decades ago assembled and then disassembled the largest collection of cable TV assets in the United States. 


But some might argue it does not matter very much whether AT&T derives cash flow from assets it has a stake in, or owns outright. The new combination of Discovery with Warner Media leaves AT&T with 71 percent ownership of the larger new aset but also $43 billion in cash the firm can use to reduce debt. 


As a full owner, Warner Media generated a bit more than $30 billion in 2020 revenues for AT&T.
The bigger new firm is expected to generate about $52 billion in revenue. That provides AT&T with about $37 billion in annual revenue, based on its 71 percent ownership of the asset. 


So one way to look at the deal is simply to note that, in addition to $43 billion in cash, AT&T immediately gets ownership of a larger revenue stream. 


As some might argue, owning assets in full is less important than generating cash flow. The new collection of assets is poised to produce significantly higher cash flow than the 100-percent-owned Warner Media. 


Some might say that is an example of using leverage productively. 


Others might say AT&T is making a strategy shift, back to focusing on its core connectivity assets. There is a ring of truth there. As much debt as firms such as Verizon and AT&T have taken on to acquire rights to 5G spectrum, it makes sense to deleverage, and content asset sales are one way to do so.


On the other hand, there is significant uncertainty about how much incremental new revenue 5G can generate, and whether it will be enough to compensate for an almost certain loss of half of legacy revenue over the next decade.


Though Verizon and AT&T do need to deleverage, they both also arguably must create big new revenue streams from new services, and not simply a billion dollars here and there. They need to create new businesses producing scores of billions in annual new revenue. 


They might hope to do so with enterprise 5G, but as in the case of fixed network internet access services, even significant gains in market share--if possible-- will not be enough. Though single-digit billion additions to revenue are helpful, they will not be big enough to replace half of current revenue in a decade. That requires scores of billions.

Friday, May 14, 2021

Internet Access Might Not be the Problem Some Claim

Though it always seems to be a contentious matter, virtually all U.S. homes have access to broadband internet access, including cabled networks, satellite providers and fixed wireless internet service providers. A significant number of consumers also prefer to use mobile networks for internet access. 


In November 2019 86 percent  of U.S. residents lived in households that have fixed network high-speed Internet services in the home, says George Ford, Phoenix Center for Advanced Legal & Economic Public Policy Studies chief economist. 


Satellite providers cover virtually the entire continental United States and some 2,000 fixed wireless providers also provide service in rural areas. 


“Almost all broadband providers offer a capable broadband connection for $10-to-$20 per month for qualifying low-income consumers,” says Ford. 


Comcast’s Internet Essentials offers a 50 Mbps service for less than $10 per month for qualifying households, he notes. 


Spectrum’s Internet Assist program offers a 30 Mbps service for $14.99 per month.


Verizon offers a 200 Mbps service for $19.99 per month.


Also, a significant percentage of U.S. consumers and households prefer to use mobile networks exclusively for internet access. Today, mobile substitution  might represent 15 percent to 20 percent of U.S. households. 


Far greater substitution is likely in the future, as mobile networks get faster and per-gigabyte prices drop to levels we associate with fixed networks. At some point, mobile speeds will reach hundreds of megabits per second, probably about the time of 6G. By 7G we might routinely see headline speeds in the terabits per second.

Are U.S. Broadband Prices Too High?

From time to time, the cost of broadband internet access becomes a public policy issue. Some claim prices are too high, the typical argument being that U.S. a la carte prices (the retail tariff for internet access, not purchased in a bundle) are higher than prices in other countries.  


Adjusting for currency and living cost differentials, however, broadband access prices globally are remarkably uniform. 


The 2019 average price of a broadband internet access connection--globally--was $72..92, down $0.12 from 2017 levels, according to comparison site Cable. Other comparisons say the average global price for a fixed connection is $67 a month. 


Looking at 95 countries globally with internet access speeds of at least 60 Mbps, U.S. prices were $62.74 a month, with the highest price being $100.42 in the United Arab Emirates and the lowest price being $4.88 in the Ukraine. 


According to comparethemarket.com, the United States is not the most affordable of 50 countries analyzed. On the other hand, the United States ranks fifth among 50 for downstream speeds. 


Another study by Deutsche Bank, looking at cities in a number of countries, with a modest 8 Mbps rate, found  prices ranging between $50 to $52 a month. That still places prices for major U.S. cities such as New York, San Francisco and Boston at the top of the price range for cities studied, but do not seem to be adjusted for purchasing power parity, which attempts to adjust prices based on how much a particular unit of currency buys in each country. 


The other normalization technique used by the International Telecommunications Union is to attempt to normalize by comparing prices to gross national income per person. There are methodological issues when doing so, one can argue. Gross national income is not household income, and per-capita measures might not always be the best way to compare prices, income or other metrics. But at a high level, measuring prices as a percentage of income provides some relative measure of affordability. 


Looking at internet access prices using the PPP method, developed nation prices are around $35 to $40 a month. In absolute terms, developed nation prices are less than $30 a month. 


According to a new analysis by NetCredit, which shows U.S. consumers spending about 0.16 percent of income on internet access, “making it the most affordable broadband in North America,” says NetCredit.  


In Europe, a majority of consumers pay less than one percent of their average wages to get broadband access, NetCredit says. In Singapore, Hong Kong, New Zealand and Japan,  10 Mbps service costs between 0.15 percent and 0.28 percent of income. 


A normalization technique used by the International Telecommunications Union is to attempt to compare prices to gross national income per person, or to adjust posted retail prices using a purchasing power parity method. 


source: ITU 


Gross national income is not household income, and per-capita measures might not always be the best way to compare prices, income or other metrics. But at a high level, measuring prices as a percentage of income provides some relative measure of affordability. 


Looking at internet access prices using the purchasing power parity method, developed nation prices are around $35 to $40 a month. In absolute terms, developed nation prices are less than $30 a month.

Customers Not Too Fond of ISP, Linear Video, Social Media Providers, ACSI Shows

Some things do not seem to change all that much, among them consumer satisfaction with home broadband or linear video subscriptions . Though...