Tuesday, November 9, 2021

Home Broadband ARPU is One Thing, Prices Another

Nobody will be surprised that U.S. households are buying fewer service bundles featuring internet access and a linear TV subscription. According to Parks Associates, buyers of such bundles have decreased since 2017. 


It might be more significant that home broadband average revenue per account is rising, up to about $65 per account in the second quarter of 2021. 

source: Parks Associates 


In part, that increase in ARPU is the result of consumers upgrading service plans to faster tiers of service, notably at the fastest tier of service. 

source: Openvault 


In the second quarter of 2021 it also was clear that many fewer customers were buying service at speeds below 50 Mbps. Also, retail prices tend to creep up annually, so that makes a difference as well. 


source: Openvault 


It also can be argued that home broadband costs actually have fallen, adjusting for inflation. That might be especially true for the  plans most people buy. Also, home broadband prices have fallen while other consumer product prices have climbed. 

Reemergence of "Structural Separation?"

Structural separation of retail opeations from network ownership was a bigger idea several decades ago than at present, even if a handful of markets have moved that way in a formal sense in Southeast Asia, Australia, New Zealand and the United Kingdom.


The key idea is to create an independent network faciltiies supplier and allow all retail service providers to use that one platform.


Whether mandated by regulators or as a business choice, wholesale access remains contentious in both fixed and mobile segments of the business. Over the decades, one has heard much criticism of the “I build it, you get to use it” argument from facilities providers selling wholesale capacity and services to retail competitors. 


Such complaints happen in a variety of settings, including mobile and fixed network wholesale; whether featuring mandated pricing set by regulators or market mechanisms; and by business strategy and market share (attacking or smaller facilities-based suppliers often see greater advantages than dominant providers). 


It remains unclear how attitudes of underlying carriers could change in the future, if greater functional separation of mobile or fixed assets were to occur, especially if it is not mandated by government authorities. 


In other words, if the ownership of access or core network  facilities continues to evolve, with greater ownership by private equity, institutional investors and other “patient” investors, how much could attitudes shift?


If “core” network assets are only partially owned or even divested by dominant retail suppliers, do attitudes also shift? If core infrastructure no longer is considered strategic by dominant suppliers--as unlikely as that might seem--do most, if not all retail service providers wind up having similar attitudes about the value of wholesale access and their business models?


As an example, what if BT Openreach is fully separated from BT? How does BT’s valuation of core network assets (access, especially) evolve? Does BT not acquire the same positon as any existing wholesale customer of Openreach?


Beyond that, what emerges as the core competency of a dominant retailer once ownership of the scarce access facilities is no longer an issue? The perhaps obvious answers are market share itself, installed name, brand name awareness and value, influence on the regulatory process, other complementary assets and so forth. 


Right now, the mobile virtual network operator business model provides some baselines. 


MVNOs are not legal in every market, but in some markets represent  significant portions of the installed base and market share. That is especially true in Europe. 

source: McKinsey 


Margin potential varies. Simple branded “resellers” who add little additional value also face the least risk, at the cost of expected profit margins. Basically, this business model relies on sales and marketing skill, as the basic “product” is sourced completely from a facilities-based service provider, with no fundamental differentiation. The reseller is not able to set its own retail prices. 


An MVNO operating as a “service provider” assumes more risk, for more potential reward.  A service provider operates its own direct billing and customer care operations and can set its own prices. Revenue is typically earned on outbound traffic. 


The “asset light” MVNO earns revenue on both outbound and inbound traffic, and is obliged to pay the underlying carrier on a pattern similar to the “service provider” MVNO. The main advantage is that this type of MVNO is free to add any sort of additional value and differentiation. 


A “full MVNO” itself supplies all of the infrastructure except the radio access network, which is leased from a facilities-based mobile operator. This model offers perhaps the highest ability to differentiate the user experience, with the highest amount of risk, however. 


As a rule, an MVNO has to have operating costs 30 percent or more lower than the host provider’s cost structure. Perhaps for that reason, the full MVNO model is rarely chosen. The center of gravity is arguably either the service provider or asset light approach. 


Much can hinge on the anticipated gross revenue and  profit margins to the wholesale services supplier. Bulk accounts have their attractions. If some customers want to defect to a lower-cost mobile virtual network operator--and that is the primary attraction for nearly all MVNOs--then supplying access to a retail competitor still makes business sense.


The underlying carrier makes revenue off a “lost” customer account. Some argue that asset-light MVNOs can earn higher profit margins than facilities-based retailers. 


source: Oxio 


If a dominant mobile service provider could achieve margins between 15 percent and 20 percent as do other light MVNOs, but avoid capex and opex, further boosting margins, would that not be a reasonable choice? 


And if so, the historic value of owning scarce access assets decreases substantially, perhaps nearly entirely. So the business model becomes more disaggregated.


Structural separation, in past decades mostly viewed as a regulatory solution, might eventually become a preferred marketplace solution.


What Zoom Fatigue Tells Us About the Present Value of Video Conferencing

For decades we have been told that video conferencing would be a useful replacement for face-to-face meetings or an enhancement of remote communications. That is true, up to a point. 


But, generally speaking, we are a long way from holographic telepresence that replicates the full sensory experience of communicating with a real person in real time, in person. 


The mass “remote work” social experiment caused by Covid has provided an actual test of the value of video conferencing--and its issues and limitations--over most of the past two years. 


And most of us might agree that it is a mixed blessing. 


Zoom fatigue--the feeling of exhaustion many feel after too many video conferences--seems directly related to the amount of time spent videoconferencing every day, a study suggests. The feeling of burn out 


source: Meetric.app 


There are physiological reasons, including the fact that cognitive load during a video conference is higher than would be the case for a face-to-face, in person meeting, scientists at Stanford University say. Other researchers agree that video conferencing requires  higher cognitive load.  


Video conferencing also inhibits the non-verbal clues humans use when communicating in person. So people are working harder to figure out what is going on. 


Another study suggests that 49 percent of videoconference users report feeling “exhausted” after video conferencing. 


source: Virtira.com 


Many surveys show that remote workers participate in more meetings than when they are in the office. And there is some evidence that younger workers experience more fatigue than older workers, according to a survey of 1700 employees and managers surveyed by Virtira. 

source: Virtira.com 


Video conferencing has a way to go before it can hope to avoid Zoom fatigue.

Monday, November 8, 2021

Historic Shift of U.S. Internet Access Market Share is Coming

Though U.S. cable operators have steadily added to their installed base of internet access customers for two straight decades, at the expense of telcos, that might be on the cusp of significant change. 


Verizon, for example, seems to be taking share from Altice, despite that firm’s conversion from hybrid fiber coax to a fiber to home platform continues, and even as most of the footprint is offering gigabit levels of service. 


In some markets, independent FTTH providers also are gaining share. Tucows, which operates Ting Internet, has been getting market share.of about 31 percent where it chooses to build its symmetrical fiber-to-home networks. 


Coming next is an expansion of the addressable telco FTTH market, based on $65 billion in subsidies to be enabled by a new infrastructure bill passed by the U.S. Congress. 


The passage of an  infrastructure bill by the U.S. Congress means as much as $65 billion in support for broadband access across the United States. While the specific allocations are not yet available, that essentially means the business case for deploying fiber to the home--and other access platforms--is better by about that amount. 


The big implication is that the business case for deploying high-performance broadband networks will improve by a substantial margin, bringing millions of locations to the point where such networks are justified in terms of business case, where they had not been deemed feasible in the past. 


The obvious issue is where to prioritize the spending of money and for how many different types of platforms. As always, there will likely be an effort to award subsidy funds in a “platform neutral” manner, or largely so. 


George Ford, economist at the Phoenix Center for Advanced Legal and Economic Public Policy Studies, argues that about 9.1 million U.S. locations are “unserved” by any fixed network provider. 


Though specifics remain unclear, it is possible that a wide range of locations might see their deployment costs sliced by $2,000 or more. Lower subsidies would enable many more locations to be upgraded to FTTH, for example: not the unserved locations but possibly also many millions of locations that have been deemed “not feasible” for FTTH.


Much hinges on the actual rules that are adopted for disbursement. Simple political logic might dictate that aid for as many locations as possible is desirable, though many will argue for targeting the assistance to “unserved” locations. 


But there also will be logic for increasing FTTH services as widely as possible, which will entail smaller amounts of subsidy but across many millions of connections. The issue is whether to enable 50 million more FTTH locations or nine million to 15 million of the most-rural locations. 


Astute politicians will instinctively prefer subsidies that add 65 million locations (support for the most-rural locations plus many other locations in cities and towns where FTTH has not proven obviously suitable). 


The issue is the level of subsidy in various areas. 


“According to my calculations, if the average subsidy is $2,000 (which is the average of the RDOF auction), then the additional subsidy required to reach unserved households is $18.2 billio,” Ford argues. “If the average subsidy level is $3,000, then $22.8 billion is needed. And at a very high average subsidy of $5,000, getting broadband to every location requires approximately $45.5 billion.”


Such an extensive subsidy system would change the FTTH business model for all telcos operating in rural and even many urban or suburban areas. might affect cable operators and also could affect demand for all satellite and fixed-wireless operators. 


It just depends on the eligibility rules. 


Generally speaking, both AT&T and Verizon, where they offer fiber-to-home service, have been getting installed base a bit higher than 40 percent, in markets where they have been marketing for at least a few years. AT&T is hopeful it can, over time, boost share to about 50 percent of the market. 


Unless cable operators fail to respond, and that is highly unlikely, their installed base could  drop from about 70 percent to perhaps 50 percent if telcos adopt FTTH on a wide scale. That obviously leaves little room for third providers at scale, on a sustainable basis. 


To be sure, Ting Internet is “cherry picking” its markets, picking locations where it believes it has the best chance to gain share. 


Those typically are higher-income suburban areas where the main competitor, in terms of speed, is the cable operator, and where a telco remains wedded to copper access. Market share should be lower in areas where both the incumbent cable operator and telco offer gigabit speeds. 


In those markets, assuming pricing is relatively comparable, Ting’s advantage in part will rely on upstream bandwidth capabilities, at least where compared to the cable operator. 


It is harder to predict what might be the case in a decade, when telcos and cable operators alike might be offering access routinely in the gigabit to multi-gigabit ranges, possibly with upstream bandwidth high enough that return bandwidth is not an issue for nearly all customers, even if not fully symmetrical. 


To be sure, terms and conditions and general customer expectations about experience will matter. Internet service providers as a class do not score highly in the American Customer Satisfaction Index, for example. Whether specialist providers can do better, on a sustainable basis, is the issue.  


Brand name preferences and product bundling might also help the largest incumbents. According to ACSI, for example, in 2021 AT&T and Verizon both are ranked higher in customer satisfaction scores than any of the cable companies. 


That is surprising, especially for AT&T, which has not yet converted most of its plant to FTTH. The infrastructure bill is likely to accelerate AT&T deployments of FTTH, if it significantly changes the business case.


Big Change in U.S. FTTH Business Case

The passage of an  infrastructure bill by the U.S. Congress means as much as $65 billion in support for broadband access across the United States. While the specific allocations are not yet available, that essentially means the business case for deploying fiber to the home--and other access platforms--is better by about that amount. 


The big implication is that the business case for deploying high-performance broadband networks will improve by a substantial margin, bringing millions of locations to the point where such networks are justified in terms of business case, where they had not been deemed feasible in the past. 


The obvious issue is where to prioritize the spending of money and for how many different types of platforms. As always, there will likely be an effort to award subsidy funds in a “platform neutral” manner, or largely so. 


George Ford, economist at the Phoenix Center for Advanced Legal and Economic Public Policy Studies, argues that about 9.1 million U.S. locations are “unserved” by any fixed network provider. 


Though specifics remain unclear, it is possible that a wide range of locations might see their deployment costs sliced by $2,000 or more. Lower subsidies would enable many more locations to be upgraded to FTTH, for example: not the unserved locations but possibly also many millions of locations that have been deemed “not feasible” for FTTH.


Much hinges on the actual rules that are adopted for disbursement. Simple political logic might dictate that aid for as many locations as possible is desirable, though many will argue for targeting the assistance to “unserved” locations. 


But there also will be logic for increasing FTTH services as widely as possible, which will entail smaller amounts of subsidy but across many millions of connections. The issue is whether to enable 50 million more FTTH locations or nine million to 15 million of the most-rural locations. 


Astute politicians will instinctively prefer subsidies that add 65 million locations (support for the most-rural locations plus many other locations in cities and towns where FTTH has not proven obviously suitable). 


The issue is the level of subsidy in various areas. 


“According to my calculations, if the average subsidy is $2,000 (which is the average of the RDOF auction), then the additional subsidy required to reach unserved households is $18.2 billio,” Ford argues. “If the average subsidy level is $3,000, then $22.8 billion is needed. And at a very high average subsidy of $5,000, getting broadband to every location requires approximately $45.5 billion.”


source: Cartesian


Such an extensive subsidy system would change the FTTH business model for all telcos operating in rural and even many urban or suburban areas. might affect cable operators and also could affect demand for all satellite and fixed-wireless operators. 


It just depends on the eligibility rules.


How Much Room for Indpendent ISPs in U.S. Markets?

A key issue for potential internet service providers operating as  overbuilders is market share. When competing against two incumbent ISPs, and picking markets, what is a reasonable expectation for market share, and eventually installed base? 


Tucows, which operates Ting Internet, has been getting adoption of about 31 percent where it chooses to build its symmetrical fiber-to-home networks. 


Generally speaking, both AT&T and Verizon, where they offer fiber-to-home service, have been getting installed base a bit higher than 40 percent, in markets where they have been marketing for at least a few years. AT&T is hopeful it can, over time, boost share to about 50 percent of the market. 


Unless cable operators fail to respond, and that is highly unlikely, their installed base could  drop from about 70 percent to perhaps 50 percent if telcos adopt FTTH on a wide scale. That obviously leaves little room for third providers at scale, on a sustainable basis. 


To be sure, Ting Internet is “cherry picking” its markets, picking locations where it believes it has the best chance to gain share. 


Those typically are higher-income suburban areas where the main competitor, in terms of speed, is the cable operator, and where a telco remains wedded to copper access. Market share should be lower in areas where both the incumbent cable operator and telco offer gigabit speeds. 


In those markets, assuming pricing is relatively comparable, Ting’s advantage in part will rely on upstream bandwidth capabilities, at least where compared to the cable operator. 


It is harder to predict what might be the case in a decade, when telcos and cable operators alike might be offering access routinely in the gigabit to multi-gigabit ranges, possibly with upstream bandwidth high enough that return bandwidth is not an issue for nearly all customers, even if not fully symmetrical. 


To be sure, terms and conditions and general customer expectations about experience will matter. Internet service providers as a class do not score highly in the American Customer Satisfaction Index, for example. Whether specialist providers can do better, on a sustainable basis, is the issue.  


Of All Mobile Operator Assets, Perhaps Spectrum is the Enduring Driver of Value

"Assets" and "value" are not the same thing. The former can be shown on financial statements; the latter not so much. And an argument might be made that mobile operator asset value is becoming more driven by spectrum licenses and troves than other network-related physical assets.


By some measures, the capital investment in spectrum of the largest three U.S mobile operators ranges from 30 percent to nearly half of the committed capital investment of those firms. Also, as the growing involvement of infrastructure investment in telco access networks continually grows, we must ask new questions about the value of the actual access networks and assets.


Infrastructure investors are playing a bigger role in access network capital investment, often for the same reason they invest in airports, seaports and other forms of long-lived infrastructure. They see “moats” and stable, long-term demand with predictable cash flows. 


As did other investors of 30 to 40 years ago, connectivity infrastructure and the cash flows built on it are seen as relatively stable sources of free cash flow bolstered by their relative scarcity. It started with cell towers but increasingly is moving towards optical fiber access networks, small cell network providers and data center infrastructure.  


All of that raises new questions about where value lies in the connectivity business. To use the obvious analogy, money can be made operating a seaport or airport as money is to be made moving goods from manufacturers to end users and retail buyers. 


The best connectivity industry examples are wholesale access platforms, where one entity owns the infrastructure and retail service providers all use the one infrastructure. 


The business choice between facilities-based versus leased network access is an issue in other contexts as well.  At scale, the former tends to offer better economics than the latter. That is why the leading mobile service providers in almost-all markets own their own networks. 


At lower volumes, and especially “outside” the core geography, leased access  typically offers better economics. 


Hybrid models seem to be developing, though, where the access infrastructure is partly owned by a service provider and an infrastructure investor. The advantage is lower capital investment by the service provider, at the cost of shared revenues and profit. 


Monetization opportunities will often depend on the ability to sell infrastructure access to multiple buyers, where traditionally a network has been virtually exclusively for the use of the network owner or its wholesale customers. As data centers arguably do best when they are “carrier neutral,” access assets might in some cases also benefit from multi-customer business models. 


Indoor coverage by small cell networks provides an example. It will make sense for all mobile operators to take advantage of an indoor coverage network, for example. 


It is not yet clear just how far changes in the physical platform could evolve. It might be fair to say that if value tends to migrate elsewhere in the ecosystem or value stack, away from the “access” function, such moves create new possibilities. 


As networks increasingly are virtualized, it is conceivable that a new division of labor could develop in some markets, with asset owners providing physical facilities and other participants providing the service enablement or services. 


As we presently see with wholesale-only infrastructure, one entity might provide the access functions, while all retail service or app providers pay to use that infrastructure. Though this might always make more sense for fixed networks, even mobile networks might eventually consider such a pattern, if capital intensity were to increase for future very-dense networks. 


As we have already seen, perhaps a consortia of mobile operators might join together to create and own the physical plant. The odds of such developments increase with potential infrastructure intensity and cost.


As the U.S. spectrum auction of 3.4-GHz spectrum nears an end, $22 billion already has been bid on those assets, with an average price per MegaHertz per person of about 65 cents. Some will argue that directly increases capital investment by the winning entities. Others will agree, but enumerate those investments separately from other mobile operator capex. 


How much capital investment mobile operators invest each year depends on how one counts such investments. Often, physical plant and spectrum investments are tallied separately. 


Consider a CTIA report on U.S. mobile industry capital investment. Between 2016 and 2020, for example, “capex” is said to range from $25 billion to $30 billion per year. 


source: CTIA


Spending for spectrum licenses ranges is tracked separately, it appears, as it appears spectrum license spending has accelerated since 1994. 


Prior to 1994, spectrum license spending might have been tracked by decade. Between 1994 and 2001 CTIA used an eight-year interval. Since 2002 CTIA uses a five-year interval. 


That indicates a quickening of the tempo of license acquisitions; more competition for licenses as well as bigger spectrum allotments (more frequent auctions; more licensees; more capacity per auction). 
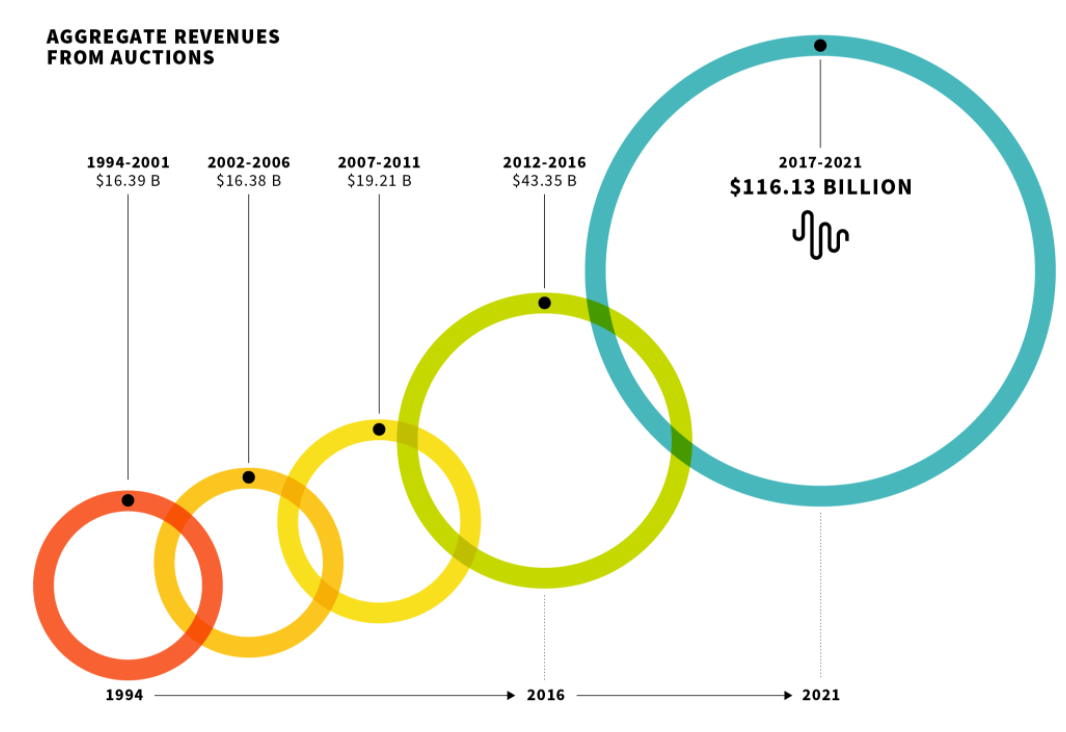
source: CTIA 


It appears CTIA, for purposes of tracking capital investment, does not include spectrum purchases in its chart on U.S. mobile industry “capital investment.” CTIA shows cumulative “capex” between 2016 and 2020 as a cumulative $138.5 billion total. 


CTIA also shows spectrum licenses paid for in the 2017 to 2021 period as $116 billion. So obviously, spectrum license spending, though “capex” for accounting purposes, is separated from spending on spectrum licenses, which also is categorized as “capex” by accountants. 


Standard and Poors includes spectrum licenses in the “capex” category, for example.  


So actual mobile capex often is portrayed as higher or lower, depending on the assumptions. “Network capex” often is separately portrayed from “spectrum capex.” Both have grown. 


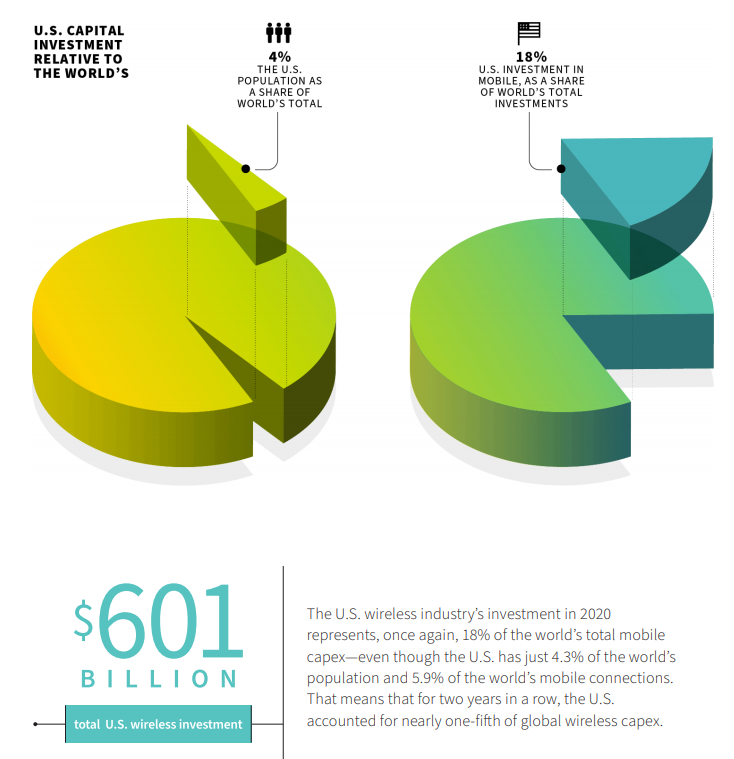
CTIA also says cumulative capex including 2001 to 2020 is $601 billion, an average of about $30 billion per year. That tends to correlate to separate tracking of network capex and spectrum license capex. At the same time, cumulative spectrum license fees are said to represent a cumulative $200 billion in spending.   


Spectrum licenses represent perhaps 25 to 35 percent of mobile operator assets in the United States and perhaps 10 percent to 20 percent of assets for other mobile operators globally.  


Overall, some might argue that total capex is rising. This chart from Standard and Poors Market Intelligence shows U.S. mobile operator capex (Just the three largest facilities-based providers) rising over time. As S&P includes spectrum spending in capex totals, that suggests spectrum spending is rising. 


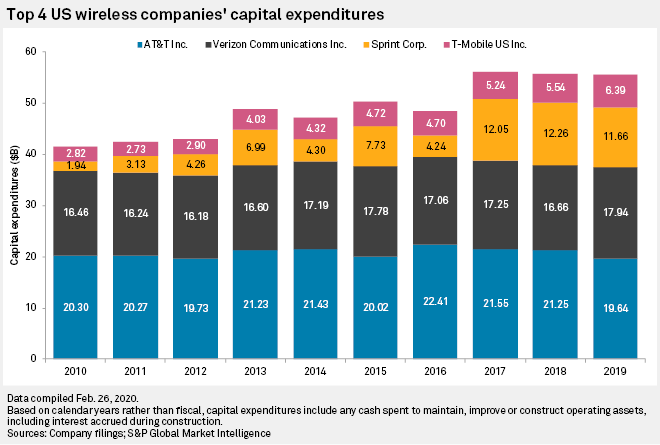
source: Standard and Poors 


But secondary transactions also happen. Including those investments, U.S. mobile operators have cumulatively spent about $601 billion in capital investment since 1994, according to the CTIA.


Spectrum license purchases since 1994 have amounted to at least $211.5 billion, not including the cost of spectrum licenses that have traded hands in the form of direct purchases or company acquisitions and mergers. 


Assume that about half of all spectrum originally acquired at auction then is resold on secondary markets, primarily as firms with those licenses are acquired by other firms. That would imply an additional $106 billion that mobile operators have spent on spectrum assets. 


source: CTIA 


If so, then spectrum represents about $317.5 billion in spectrum capex, or roughly 53 percent of total capex.


The larger point is that the value of access network assets might be changing. Such assets are viewed as desirable investments by private equity and institutional investors. At the same time, a greater share of access network plant might be viewed by telcos as not providing sustainable business advantage, or at least not enough value to consider 100-percent ownership of such assets.


At the same time, if capital investment intensity continues to rise, there will be greater business logic to considering partial divestment of access network plant.


That might well raise new questions about the value of structural separation--not as imposed by regulators--but as business choises made by the telcos themselves. It is conceivable that market participans themselves might revalue access infrastructure in ways that lead to more structural separation, as a way of managing capex while maintaining value.


AI Will Improve Productivity, But That is Not the Biggest Possible Change

Many would note that the internet impact on content media has been profound, boosting social and online media at the expense of linear form...