Friday, January 28, 2022

Mobile Operator Questions About 5G Payback Model Reflect 4G Experiences

Many in the mobile ecosystem ask the question “how will we make money from 5G? Fixed network operators have been asking themselves similar questions--"how do we get a payback from fiber-to-the-home?"--for several decades.


For mobile or fixed network operators, competition and changing demand make payback models uncertain and challenging. Where facilities-based competiton exists, the infrastructure cost per customer account always rises.


Stranded assets are the reason, though more an issue for fixed networks. In a monopoly market, the single provider might hope to get close to 98 percent take rates. In a competitive market with two equally-capable providers, each provider might hope to get 50 percent share of the installed base.


That effectively doubles the network cost per customer, as revenue is earned from about half of locations passed. In markets with three or more facilities-based competitors, cost-per-account increases more.


Demand changes also effect payback models. Fiber to the home once was underpinned by the assumption that there would be high demand for up to three services (voice, video and internet access).


As demand for fixed network voice and linear video subscriptions declines, the business model increasingly is built on home broadband. Voice and linear video help, but both are expected to keep declining.


But that has key revenue implications. Where a home location might have been expected to generate revenue of $80 to $200, the growing reality is that a location is expected to generate perhaps $50 in home broadband revenue, and then some amount of voice or other revenue from some locations.


Basically, revenue expectations--average revenue per customer or location--are effectively cut in half. That forces changes to the payback model on the cost side. Basically, costs must drop.


Those savings can come from intrastructure cost declines; operating cost drops; higher subsidies; lower maintenance costs; lower headcount and overhead or any combination.


The key point is that revenue assumptions for fixed networks increasingly are founded on lower gross revenue assumptions; revenue from additional sources; shared costs between mobile and fixed networks and more importance attached to defending market share or taking market share.


The parallel question asked by mobile operators--"how do we make money from 5G?--embeds some of the same issues faced by fixed network operators.


What the question likely means is less an uncertainty about revenue drivers and more a concern about the distribution of value within the ecosystem: will mobile operators reap a fair share of 5G benefits (higher revenue, higher profits, higher market share, lower operating costs)?


Looking only at consumer retail costs--exclusive of experience advantages such as higher speed; lower latency; new services or capabilities--it is not yet completely clear that average revenue per 5G account is higher than 4G ARPA.


5G has proven to generate higher ARPA in some markets, however.


It is a virtual certainty that 4G and older connections will be replaced by 5G. So the baseline for 5G revenue is 4G revenue. Beyond that, there is expected upside from private networks, network slicing (virtual private networks), edge computing and new enterprise connections to support internet of things use cases. 


To be sure, many wonder whether “we can charge more for 4G?” The long-term answer is not yet knowable, but the practical answer might well be “yes.” 


And that can be true even when direct tariffs for 5G are not that different, if different at all, from 4G tariffs. Some mobile operators do not charge a premium for 5G, but expect to gain market share, which drives higher 5G revenue.


Other service providers provide incentives for customers to use 5G but with a price increase coming in the form of unlimited usage. The actual driver of higher revenue per account is the shift to a higher-priced “unlimited usage” tier, not 5G as such, though such plans include 5G access at no extra charge. 


And though we have not seen it much, if at all, some mobile operators might decide to institute speed tiers for mobile service that mimic the ways access is sold on fixed networks. Customers might be offered lowest prices for lowest speeds; mid-tier pricing for mid-tier speeds and premium prices for the higher speed tiers. 


But there is another sense in which the question of “how will we make money from 5G?” can be understood.


Customers got value in terms of higher speeds when 4G was introduced. Mobile operators expected to sell more data, which would generate more revenues, and also create new services that would further increase revenues. 


But tough competition in many markets meant that mobile operators were not able to charge a price premium for 4G access. So the benefits went largely to consumers, according to ING analysts. “They got more data, better speeds and often paid less,” ING says. 


Governments also raised billions in revenue from spectrum auctions.


So one way of understanding the question about 5G revenues is the distribution of value and revenue for mobile operators within the 5G ecosystem. The downside for mobile operators is lower recurring revenues from 5G, compared to 4G. 


“Operators do not want to repeat these mistakes” seen in the transition from 3G to 4G, ING notes. But some might argue that the long-term trend will be difficult to break. 


source: Statista 


source: Strategy Analytics


source: Researchgate  


Taking market share, shifting customers to pricier accounts and increased usage charges are the immediate ways mobile operators have boosted 5G revenues over 4G levels. 


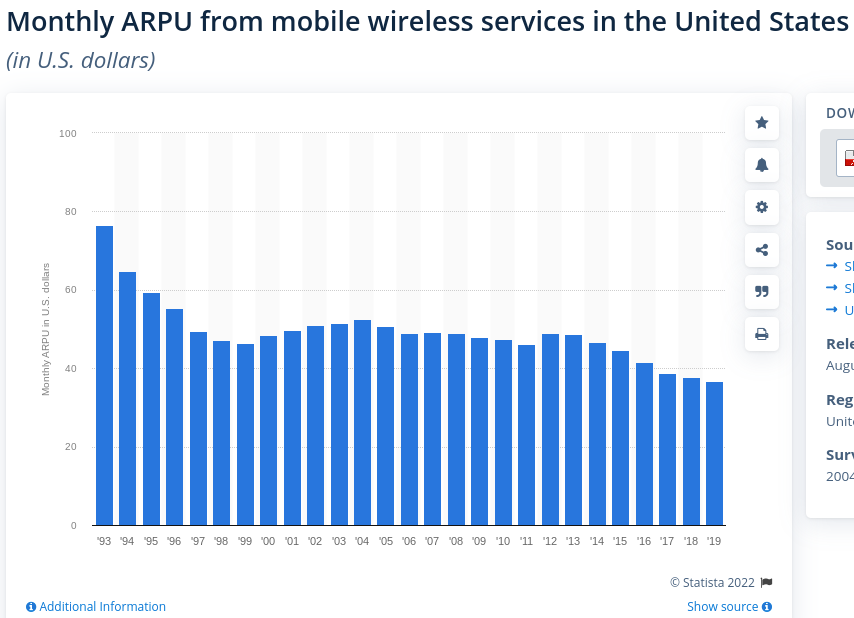
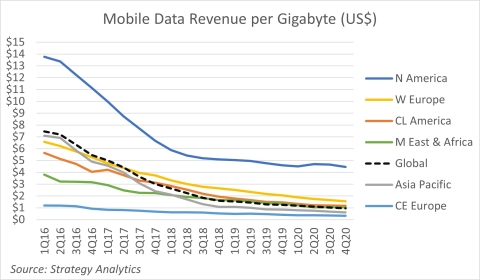
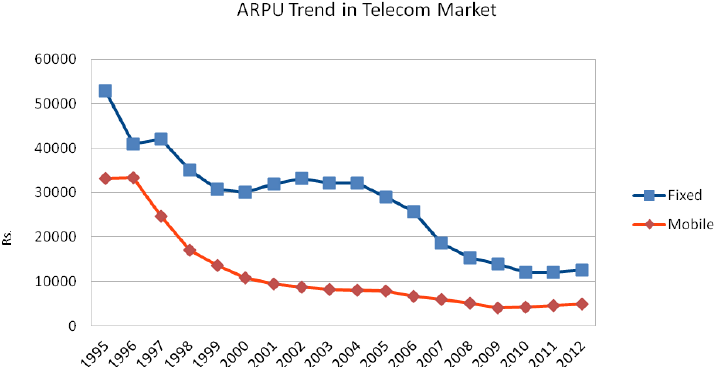
Longer-term pricing trends, though, might be difficult to change, as prices have been declining since 1996. 


On the other hand, the whole reason we see a next-generation mobile network about every 10 years, since 3G, is that capacity demand by customers keeps climbing. And while mobile operators can increase effective capacity using small cells and better radios, at some point an increase in spectrum is required. 


Also, as modulation and coding gets better with each successive generation, the cost to deliver a bit drops, allowing mobile operators to supply data consumption demand at lower costs. 


So another way to look at the payback model is to ask “what happens to your business if you do not upgrade to 5G?” Defending existing market share is a legitimate business outcome. 


Creating a more-efficient data network that supplies demand affordably also is an important business outcome. And to the extent 5G network capabilities are required to support dense internet of things networks, edge computing networks and network slicing, not investing in 5G forsakes any revenue opportunities in those areas. 


In many ways, that is akin to the value of fiber-to-home networks. In many cases, higher revenue per account is not expected. The business value instead comes from consumer market share gains, market share defense and the ability to compete in those markets. 


There is incremental value in terms of backhaul support for mobile small cell networks or business-grade services for smaller businesses. There is value in reduced operating expenses and possibly headcount. 


In other words, there are lots of ways 5G contributes to overall business value for mobile operators that go beyond direct tariff increases.


Google Invests in Airtel: Why?

Google’s new $700 million investment in Airtel, with up to $300 million to follow over five years, is part of an initiative by Airtel to reduce the cost of Android devices in the Indian market. The deal includes a 1.2 percent ownership stake in Airtel. 


But that is not the first investment Google has taken in an India mobile operator Google in 2020 invested $4.5 billion for a 7.73 percent stake in Reliance Jio Platforms. 


Separately, Facebook invested $5.7 billion in Reliance Jio Platforms in 2020. 


In part, such investments can be driven by multiple different values. Securing market entry in a key new growth area is one reason for such hyperscale app provider investments in mobile service providers. Protection from overzealous regulation is another possible benefit. 


source: Mint 


Seizing early market share leadership and user base when there are rivals is another obvious value. To the extent that hyperscalers benefit from ingesting more data, that is another value. 


Such investments in mobile and other connectivity firms are not primarily driven by the desire to replace connectivity providers in the ecosystem. 


On the other hand, it is  hard to avoid noting that two hyperscale app providers are owners of stakes in India’s largest mobile services provider, while Google now becomes a stakeholder in India’s second-largest mobile operator. 


In other cases Google has worked with mobile operators to seek ways to reduce infrastructure costs, as the Telecom Infra Project is doing. TIP seeks to  “accelerate the development and deployment of open, disaggregated, and standards-based technology solutions” that deliver high-quality connectivity. 


As a clear byproduct, TIP expects costs of infrastructure to drop. 


Keep in mind the firm and ecosystem role advantages. Looking only at the internet of things value chain, suppliers of platforms and applications depend on the connectivity function to create their business models. In other words, Facebook and Google benefit from universal, high-quality broadband. Their businesses actually require that affordable, high-quality internet access be as widespread as possible, everywhere in the world. 


source: IoT Global Network 


Instead of a value chain, think of the concept of layers as incorporated in the Open Systems Interconnection model or TCP/IP. By design, applications can run independently of the ownership of networks. The modular design means different suppliers, vendors or entities can operate at each layer, independently of ownership. 


source: Medium 


Unlike the older “closed” model of telecom, where every app on a network was either directly owned by the infrastructure owner or operated with its permission, the layers model separates each layer. 


That creates the business model we call “over the top,” where any lawful applications can be used by any person or machine without the permission of the internet access provider. 


But layers also dictate possible business models. OTT exists precisely because any lawful app can be used by any user on any network. The bundled or closed approach to creating and using applications or platforms is replaced by an open and disaggregated model.


That has profound implications. Hyperscale app or platform suppliers benefit from universal, affordable, quality internet access. Anything that increases the ability to access the internet (such as home broadband, Wi-Fi, mobility networks, satellite and fixed wireless networks) is the foundation for app provider revenue models.  


Hence their interest in ensuring that internet access is easier to deploy, everywhere, at lower costs, since lower costs mean “everyone” can use the internet. 


Conversely, the same drivers operate almost in the opposite way for connectivity providers, in some ways. The business objective of driving down internet access costs obviously limits connectivity provider gross revenues and profit margins. 


For a hyperscale or any other app or platform provider, internet access is a cost of doing business. So there is an incentive to promote lower input costs. For a connectivity provider, the access is the business, so there is an incentive to raise prices when possible. 


On the other hand, TIP, for example, aims to help lower infrastructure costs by creating open approaches to infrastructure that lead to lower costs, as functions are disaggregated and designed according to open standards any supplier can build upon. 


Investing in important, fast-growing access providers sometimes is strategic when a big new market is opening and early scale is desired. But there are other potential benefits, such as deflecting regulatory opposition or gaining mobile operator marketing push. 


That explains why Facebook and Google made their investments.


But it also is worth noting that hyperscale application and platform providers now also operate as forces to reduce infrastructure costs in ways that are helpful to connectivity providers. 


In one sense, among the changes is a shift from supplier-driven technology development to connectivity-provider led development. 


We may see other forms of connectivity role encroachment over time. At least some of that activity is a logical drive by an ecosystem participant to lower the costs of an essential business input, while increasing the revenue opportunity it can chase.


Thursday, January 27, 2022

Telecom Employment Has Been Falling for Two Decades

Headcount reductions are nothing new for the world’s top-20 biggest connectivity providers over the past half decade. One also can note a longer-term trend as fixed network operations, in particular, need to be made more efficient to deal with declining revenues. 


source: Economic Policy Institute


source: Economic Policy Institute


But job cuts in the connectivity business have been occurring for 20 years. But sometimes the job cuts really are akin to outsourcing, where a firm shifts headcount to another entity. The net effect is lower headcount, but the jobs are not necessarily “lost.”


By selling assets, AT&T has significantly reduced headcount over the past year. 


Over the last four years, AT&T headcount has dropped by 77,400, largely driven by asset sales. 


About 12,000 employees were shifted when  DirecTV was sold to TPG, a private equity firm.


Another 12,240 jobs were shifted when AT&T  sold Vrio, a television business serving Latin America and the Caribbean, to investment company Grupo Werthein.


As Warner Media is merged with Discovery, possibly another 25,000 in headcount will be shifted. 


Measure Outcomes if You Can, But Can You?

Productivity measurement as it applies to intellectual or professional work is notoriously hard to measure, if it is truly possible at all. For starters, Person's Law and the Hawthorne Effect  illustrate the concept that people who know they are being measured will perform better than they would if they are not being measured. 


Pearson's Law states that “when performance is measured, performance improves. When performance is measured and reported back, the rate of improvement accelerates.” In other words, productivity metrics improve when people know they are being measured, and even more when people know the results are reported to managers. 


Performance feedback is similar to the Hawthorne Effect. Increased attention from experimenters tends to boost performance. In the short term, that could lead to an improvement in productivity.


In other words, “what you measure will improve,” at least in the short term. It is impossible to know whether productivity--assuming you can measure it--actually will remain better over time, once the near term tests subside. 


Many argue, and studies maintain that remote work at scale did boost productivity. One might argue we actually have no idea, most of the time. 

source: Deloitte 


That workers say they are more productive is not to say they actually are more productive. 


Also, worker satisfaction is not the same thing as productivity. Happy workers can be less productive; unhappy workers can be more productive. This is an apples compared to oranges argument, in all too many cases.  


The other issue is that we equate worker attitudes with outcomes. Happier workers might, or might not, be more productive. All we can measure is a subjective attitude. More happy or less happy does not necessarily correlate with outcomes. 


In principle, one could have happier but less productive workers; less happy but more productive workers. And most workers prefer remote work; hence the obvious subjective reporting that “we are more productive when working remotely.” Maybe so, maybe not. The point is that a subjective statement is not a measurable fact. 


Now some argue  the traditional focus on measuring inputs makes less sense than ever. There is merit to measuring outputs, rather than inputs. Either way, as we shift from quantifiable outcomes to qualitative outcomes, our measurement tasks do not become easier. 


“Previous models of productivity-focused on several now-outdated approaches to measuring the ‘quantifiable’ results of an employee’s work,” Deloitte consultants say. “This included measurement of outputs, such as units and/or deliverables completed, and production line management’s (and its white-collar equivalents) assessments of hours worked by watching over a sea of workers, cubicles, and offices.”


Still, measuring inputs--for the most part--tends to overshadow business outcomes, as difficult as that may be. 


But when “outcomes” can be defined in ways that--though believed to contribute to business outcomes--might or might not do so. 


Perhaps it sounds logical enough to substitute “desired outcomes and outputs of work visible to employees in order to achieve them.” The hard part is ensuring that the substituted outcomes really have some causal relationship to business outcomes. 


Perhaps not everything an entity produces can be measured quantitatively and directly. Perhaps everything is not “the bottom line.” Qualitative outcomes matter, even if we cannot measure them. 


So, yes, outcomes matter more than measurement of inputs. The problem remains: intellectual or non-tangible output is hard to measure, if we can measure it at all. By all means, measure outcomes if you can. 


The issue is whether we can, and to what extent.


Is Web3 Utopian?

Web3 proponents want to build a decentralized web “where users control their own data, identity and destiny.” In substantial part, blockchain and cryptocurrencies are seen as examples of Web3. 


According to its proponents, Web3 should be “open, trustless and permissionless.” It is hard to be against such a notion. People now generally believe open source software is a good thing.


“Trustless” refers to the ability of all participants to interact publicly or privately without a  third party gatekeeper. 


Permissionless means anyone can participate without authorization from a governing body. 

source: Fabric Ventures 


In some part, perhaps a substantial part, the motivation is to avoid huge concentrations of power such as we have seen with the emergence of “hyper” apps including Google, Facebook and Amazon. 


It is easy to agree with the sentiment, as it was easy to agree with the sentiment of early internet pioneers that the goal was the ability for any single person to communicate with any other person and share information


Some might say that vision was utopian. The internet and web now are fragmented behind national firewalls in some countries. Some applications are banned in some countries. And in all countries, a few apps--and firms--tend to dominate all others. 


As with the emergence of cryptocurrencies, we already see signs that central financial authorities are moving to gain control over such forms of value or payment. 


If Web3 is about ownership, you might see the problem. The impulse to create a system where individuals own their own activity records and data is a reaction to the monetization of human activity on the web. The thinking is that if money is to be made, the creators of that value should be able to do so. 


Perhaps non-fungible tokens provide an example, to some extent. Perhaps not. While it is true that NFTs can secure value by preventing unauthorized duplication, personal ownership is not essentially in conflict with the creation of other assets--such as platforms--to scale transactions. 


In other words, there is no essential conflict between an artisan creating and selling an object and the creation of marketplaces to make that easier. 


source: the Skimm 


No matter what visionaries may wish, powerful interests will seek to create, control and own  revenue flows Web3 might produce. And scale matters, after all. The existence of small business does not preclude the existence of “big business.” 


The argument is that the new architecture will prevent such control. 


source: Digital Native 


We might be skeptical. In some ways, we might liken the sentiment for an open, universal web to the dream of a world without rulers or social and economic classes.


Wednesday, January 26, 2022

What Contribution Does FTTH Make to AT&T?

AT&T added a million fiber-to-home fiber-to-home accounts in 2021, the fourth consecutive year the firm has done so. AT&T says it boosted broadband revenues up 5.4 percent  with average revenue per user  growth of 4.2 percent. 


Consumer fixed network revenue climbed 1.4 percent, adding $3.2 billion in additional revenue. 


To be sure, AT&T still makes most of its revenue from mobility services. In the fourth quarter of 2021, AT&T earned $41 billion in revenue. Mobility represented $21 billion of quarterly revenue, or about 51 percent of total.  


Business fixed network revenues were $5.9 billion, or 14 percent of total. 


source: AT&T 


Consumer fixed network revenue was $3.2 billion, or about eight percent of total revenue. 


Warner Media generated $9.9 billion, or 24 percent of revenue.  Latin America contributed about $1 billion in revenue, or two percent of total. 


Direct business and consumer revenues driven by access and other fixed network services amount to about 22 percent of AT&T revenues, compared to mobility at about 51 percent of total. 


Just how much revenue contribution overall hinges on the AT&T optical fiber network is a matter of some interpretation. To the extent that the optical fiber distribution networks supports the small cell mobile network, which will grow in importance over time, the value of optical fiber investments is more than what is shown by direct business and consumer service revenue. 


Indirectly, the FTTH investments also support the Warner Media streaming content business. 


Still, to the extent the fixed network now supports the key mobile business, plus supporting the business and consumer fixed network business, the relative revenue contribution from FTTH arguably understates the strategic value of those investments. 


Perhaps consumer FTTH, by itself, does not double consumer segment revenues. But investments in consumer FTTH also support the small, medium and enterprise portions of the business market, plus underpinning the small cell mobile network that will be increasingly important going forward. 


Still, the argument can be made that the fixed network retail business hinges on home broadband. To have a business at all--simply to “keep the business”--AT&T and other telcos have to shift to FTTH. 


In its competitive battle for home broadband customers, AT&T’s fortunes depend on three key drivers: fiber to home coverage; take rates and any average revenue per account gains that could supply, with the primary variable being coverage. 


The reason is simply that AT&T cannot challenge dominant cable TV providers for installed base and market share until the company has much-greater FTTH coverage. Simply put, AT&T and most other local exchange carriers cover too few homes to go head to head with cable home broadband. 


To be sure, AT&T and other telcos are pushing FTTH deployments at an accelerated pace. AT&T expects to have 30 million home locations passed by FTTH by about 2025, up from about 15 million to 15.5 million at the moment. 


source: AT&T 


Keep in mind that AT&T passes a total of about 57 million homes. So the company’s current FTTH coverage is between 26 percent and 27 percent of its total passings. 


AT&T will not be able to go head to head with cable, across the full range of home broadband speeds, until it has FTTH available to most homes in its fixed network footprint. By 2025, when AT&T expects to  have 30 million FTTH passings, it will be able to compete head to head in about 45 percent of its footprint. 


Take rates are arguably the second most-important variable, as there is a difference between an active account and a location able to buy. Over the past year, AT&T has boosted its FTTH take rate from 34 percent of passings up to 37 percent of passings. 


The goal is to approach 50 percent take rates, which would exceed the general take rate of about 40 percent telcos have been able to garner over the past couple of decades. 


Finally, it remains to be seen how average revenue per account changes as more customers take FTTH home broadband services. At the moment, AT&T’s bottom tier FTTH home broadband service (exclusive of taxes) runs about $55 per month. The mid-range tier costs about $65 a month, while the top gigabit tier sells for $80 a month.


In addition, AT&T has added two premium tiers offering 2-Gbps symmetrical and 5-Gbps symmetrical access for $110 and $225 per month, respectively. The mix of accounts could strongly affect AT&T revenues. 


The lowest FTTH tier--offering 300 Mbps--covers more than half of the U.S. home broadband buyer base. Another 17 percent of customers buy services operating between 200 Mbps and 400 Mbps. 


source: Openvault  


Assuming lower-income households take advantage of support programs, those households reached by AT&T could have internet access at 300 Mbps for about $25 a month. 


That is why the pace of FTTH upgrades matters so much for AT&T. To reach parity with cable TV operators, which AT&T defines as market share greater than 50 percent and installed base approaching 50 percent. Without nearly-ubiquitous FTTH deployment, those goals are likely unreachable. 


To be sure, competition at the lower speed levels--up to about 100 Mbps, is an opportunity for Verizon and T-Mobile. Verizon has a limited fixed network footprint of U.S. homes while T-Mobile has had zero share of the home broadband market. 


Even if those two firms use fixed wireless to reach the lower and middle tiers of buyers, that is about 65 percent to 70 percent of today’s home broadband market. 


For AT&T and other telcos, though, the pace of FTTH deployment will be the story. 


AI Impact on Data Centers

source: PTC