Friday, January 6, 2023

Taxing Hyperscalers to Fund ISP Networks has Losers, Including End Users

For every public policy decision, there are winners and losers. That is no different for proposals to tax a few hyperscalers to support home broadband networks. ISPs would gain; app providers would lose. Ultimately, so would users of internet-delivered apps and services.


Communications policy almost always is based on precedent and prior conceptions. All this might be relevant when thinking about how public networks are funded, especially not that regulators are looking at unprecedented funding mechanisms, such as levying fees on third parties that are not “customers” of connectivity providers. 


It’s a bit like taxing appliance makers whose products create demand for electricity. Today, the electrical networks are common carriers, all the devices are private and the cost of using electricity is borne by the actual end user customers. 


But some regulators want to essentially tax device manufacturers for the amount of electricity use they generate. 


There are simpler solutions, such as charging customers on a usage basis, based on their consumption. That would have a possible added benefit of not disturbing the data communications regulatory framework. 


And that matters, at least for observers who care about freedom of expression. Data networks have always separated the movement of data from the content of data. Devices and software do not require the permission of the data infra owner to traverse the network, once access rights are paid for. 


The important point is that all networks now are computer networks. 


To be clear, some will argue that changes in how networks are built (architecture, media, protocols) do not matter. It is the function that matters, not the media. If a network is used for broadcast TV or radio, that is the crucial distinction, not whether broadcasting uses analog or digital modulation; particular protocols or radios. 


If a network is a public communications carrier, the types of switches, routers, cables, protocols and software used to operate that business do not matter. What is regulated is the function. 


The function of a public network is to allow paying customers to communicate with each other. Each account is an active node on the network, and pays to become a node (a customer and user of the network). 


Service providers are allowed to set policies that include usage volume and payment for other features. In principle, a connectivity provider may charge some customers more than others based on usage. 


But one element is quite different in the internet era. Connectivity providers have customers, but generally do not own the applications that customers use their networks to interact with. There is no business relationship between the access provider and all the other application providers--as app providers. Every app provider is a customer of a local access provider or many access providers. 


Operators of different domains can charge each other for use of each others’ networks by other networks, which is where the intercarrier settlements function plays. And volume does matter, in that regard. 


The point is that it is the networks who settle up on any discontinuities in traffic exchange. Arbitrage always is possible whenever traffic flows are unequal, and where rules are written in ways that create an arbitrage opportunity. The classic example is a call center, which features lots of inbound traffic, compared to outbound. 


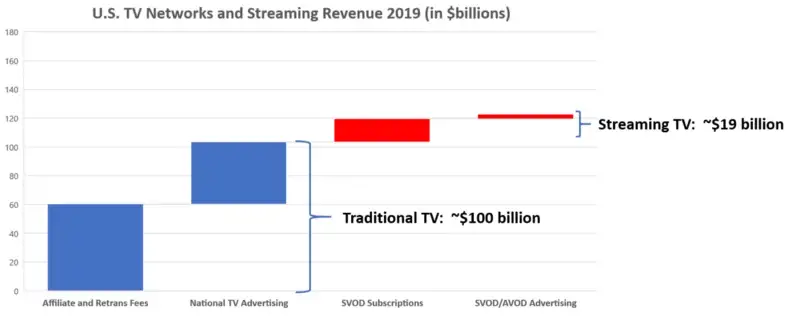
So some might liken video streaming services to a form of arbitrage, in that video streaming creates highly unequal traffic flows: little outgoing traffic and lots incoming, for the consumer of streaming content. 


But that also depends on where the servers delivering the content are located. In principle, traffic flows might well balance out--between connectivity domains-- if streaming customers and server sites are distributed evenly. 


Historically, big networks and small networks also have different dynamics. When the media type is voice, for example, bigger networks will get more inbound traffic from smaller networks, while smaller networks should generate more outbound traffic to the larger networks. 


For streaming and other content, traffic flows on public networks might largely balance, since the biggest content firms build and operate their own private networks to handle the large amount of traffic within any single data center and between data centers. Actual distribution to retail customers (home broadband users of streaming video, for example) likewise is conditioned by the existence of server farms entirely located within a single domain (servers and users are all on one service provider’s network). 


The point is that inter-domain traffic flows, and any compensation that different domains might “owe” each other, is a complicated matter, and arguably should apply only to domains and their traffic exchange. 


In other words, one might argue that traditional inter-carrier settlements, traffic peering and transit are sufficient to accommodate unequal traffic flows between the domains. 


In other words, the argument that internet service providers make that a few hyperscale app providers are sending much more traffic than they are receiving “should” or “could” be settled between the access provider domains, as always has been done. 


If the argument goes beyond that, into notions of broadband cost recovery, then we arguably are dealing with something different. Going beyond inter-carrier settlements, such notions add a new idea, that traffic sources (content providers and streaming services)  should pay for traffic demand generated by their traffic sinks (users and subscribers of streaming services).  


This is a new concept that conceptually is not required. If ISPs claim they cannot afford to build and operate their own access networks, they are free to change charging mechanisms for their own customers. Customers who use more can pay more. It’s simpler, arguably more fair and does not require new layers of business arrangements that conflict with the “permissionless” model.


Data networks (wide area and local area) all are essentially considered private, even when using some public network resources. Data networks using public network resources pay whatever the prevailing tariffs are, and that is that. Entities using data networks do not contribute, beyond that, to the building and operating of the public underlying networks. 


Public transport and access providers might argue that they cannot raise prices, or if they did, would simply drive customers to build their own private networks for WAN transport.


That obviously would not happen often in the access function. Local networks are expensive. But there already exists a mechanism for networks to deal with unequal traffic flows between access domains. 


So there is a clash here between private data networking and public communications models. What is new is that, in the past, the applications supported by the network were entirely owned by the network services provider. 


Now, the assumption is that almost none of the applications used by any ISP’s customers are owned by the ISP itself. So the business model has to be built on an ISP’s own data access customer payments. Application revenue largely does not factor into the business model. 


But that is the way private computer networks work. Cost is incurred to create the network. Revenue might be created when public network access and transport is required. But all those payments are made by an ISP’s local customers, even when the ISP bundles in access to other ISP domains required to construct the private network. 


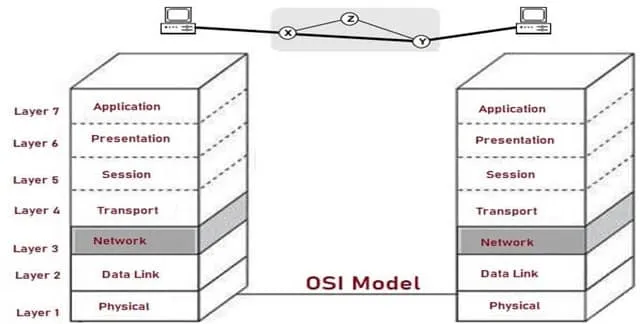
“Permissionless”  development and operation now is foundational for software design and computing networks. All networks now are computing networks, and all now rely on functional layers. 


The whole design allows changes and innovation at each functional layer without disturbing all the functions of the other layers. What we sometimes forget is that below the physical layer is layer 0, the networks of cables that create the physical pathways to carry data. 


Of course, any connectivity network must operate at several layers: physical, data link and network. By the “transport” layer functions tend to be embedded in edge devices. 


source: Comparitech 


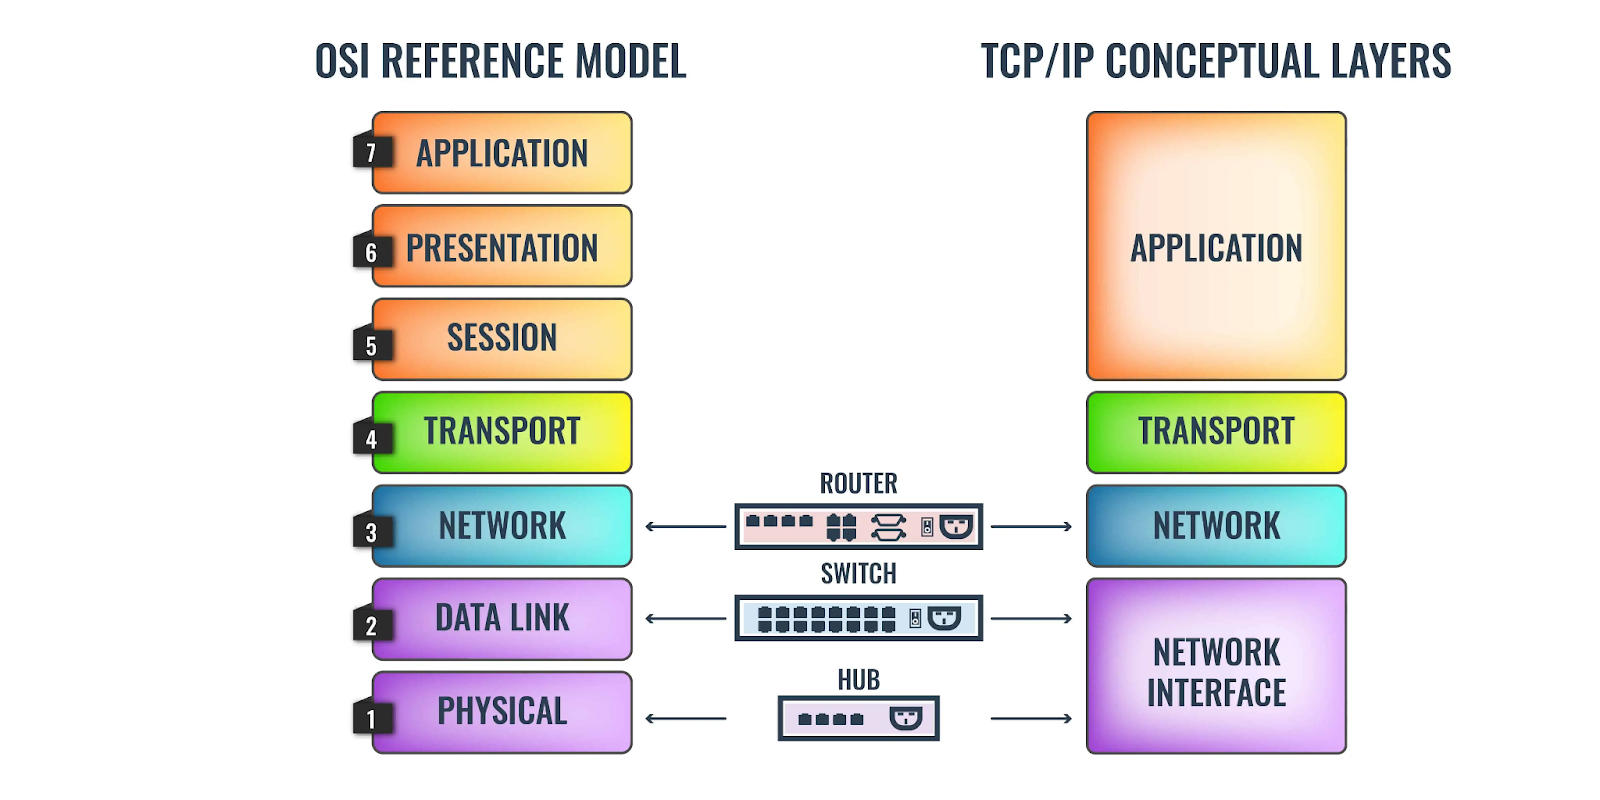
To be sure, connectivity networks--especially access networks that sell home broadband and other connectivity services to businesses--must operate at many layers, including the modems used to support broadband access. 


So some might add, in addition to a “layer zero” network of cables, a layer eight for software and applications that run on networks. 

source: NetworkWalks 


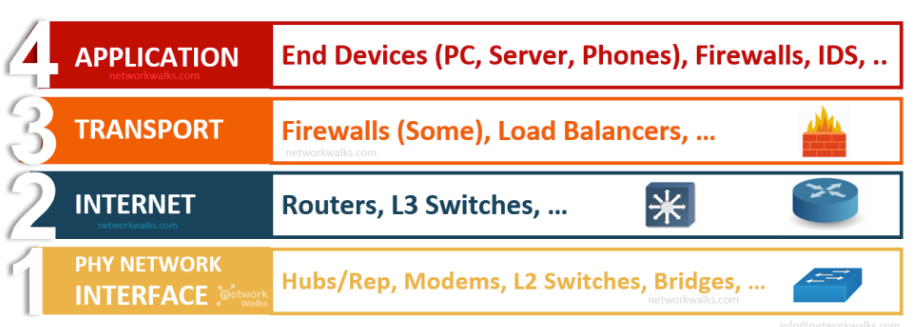
Local area networks typically are less complex, but still use the layers architecture. The difference is that LANs (Wi-Fi, Ethernet  or other) primarily rely on layers one to three of the model. 


source: Electricalfundablog 


“Permissionless” access and transport have sparked enormous innovation. That should remain the case. Additional taxes, which means higher costs, will not help that process. Other networks charge for usage. Public IP networks could do the same. Settlement policies between access domains already exist. And, to be clear, app domains can create facilities that do not cross access domains, if they choose. 


So ISPs can charge for usage if they choose. Unlimited usage could be a higher price. Lower amounts of usage can still be sold in tiers. Problem essentially solved.


Wednesday, January 4, 2023

U.S. Home Broadband Actually is Neither Slow Nor Expensive

Critics of U.S. home broadband often claim that service is slow and expensive. Both opinions can be challenged. In fact, U.S. median home broadband speeds were among the fastest in the world in 2021 and climbed in 2022. 

source: Ookla 


“Price” sometimes is a bit more subtle. Though prices have declined in every speed category, some might still argue “prices are too high.”


For example, ana analysis shows that U.S. home broadband prices have fallen since 2016, according to a study by Broadband Now. 


Broadband Now says that the average price for internet in each speed bucket starting in the first quarter of 2016 compared to the fourth quarter of 2021 has fallen:

  • The average price decreased by $8.80 or 14% for 25 – 99 Mbps.

  • The average price decreased by $32.35 or 33% for 100 – 199 Mbps.

  • The average price decreased by $34.39 or 35% for 200 – 499 Mbps.

  • The average price decreased by $59.22 or 42% for 500+ Mbps.


The analysis is subtle because if there is a movement by customers from lower speeds to higher speeds, which clearly is happening, then “prices” might climb, though not for the same products. Customers are choosing to buy higher-priced, higher-performance products, instead of the lower-priced, lower-performance products they used to buy. 


Other studies show the same trend.  


Also, because of inflation, price levels rise over time. So virtually any product can be accused of “costing more” in 2022 than it cost in 1996. 


Some may intuitively feel this cannot be the full story where it comes to digital products, which keep getting better, while prices either stay the same or decline. Such hedonic change applies to  home broadband. 


Hedonic qualIty adjustment is a method used by economists to adjust prices whenever the characteristics of the products included in the consumer price index change because of innovation. Hedonic quality adjustment also is used when older products are improved and become new products. 


That often has been the case for computing products, televisions, consumer electronics and--dare we note--broadband internet access services. 


Hedonically adjusted price indices for broadband internet access in the U.S. market then looks like this:

Graph of PCU5173115173116


source: Bureau of Labor Statistics 


Quality improvements also are seen globally. 


Adjusting for currency and living cost differentials, however, broadband access prices globally are remarkably uniform. 


The 2019 average price of a broadband internet access connection--globally--was $72..92, down $0.12 from 2017 levels, according to comparison site Cable. Other comparisons say the average global price for a fixed connection is $67 a month. 


Looking at 95 countries globally with internet access speeds of at least 60 Mbps, U.S. prices were $62.74 a month, with the highest price being $100.42 in the United Arab Emirates and the lowest price being $4.88 in the Ukraine. 


According to comparethemarket.com, the United States is not the most affordable of 50 countries analyzed. On the other hand, the United States ranks fifth among 50 for downstream speeds. 


Another study by Deutsche Bank, looking at cities in a number of countries, with a modest 8 Mbps rate, found  prices ranging between $50 to $52 a month. That still places prices for major U.S. cities such as New York, San Francisco and Boston at the top of the price range for cities studied, but do not seem to be adjusted for purchasing power parity, which attempts to adjust prices based on how much a particular unit of currency buys in each country. 


The other normalization technique used by the International Telecommunications Union is to attempt to normalize by comparing prices to gross national income per person. There are methodological issues when doing so, one can argue. Gross national income is not household income, and per-capita measures might not always be the best way to compare prices, income or other metrics. But at a high level, measuring prices as a percentage of income provides some relative measure of affordability. 


Looking at internet access prices using the PPP method, developed nation prices are around $35 to $40 a month. In absolute terms, developed nation prices are less than $30 a month. 


According to an analysis by NetCredit, which shows U.S. consumers spending about 0.16 percent of income on internet access, “making it the most affordable broadband in North America,” says NetCredit.


Looking at internet access prices using the purchasing power parity method, developed nation prices are around $35 to $40 a month. In absolute terms, developed nation prices are less than $30 a month.  


Methodology always matters. The average U.S. home broadband service  costs about $64 a month. In fact, U.S. home broadband inflation-adjusted costs have declined since the mid-1990s, according to an analysis  of U.S. Consumer Price Index data. 


U.S. home broadband is neither “slow” nor “expensive.”


Tuesday, January 3, 2023

How Many Video Streamers Have Sustainable Models?

Nobody can yet be sure how the TV business will reform for broadcast, linear video and streaming, except to note that streaming viewership is growing, while broadcast and linear subscription TV are shrinking.


Eventually, viewing audience share matters. So fragmentation also matters. So does consumer preference. Each medium, long term, has to find its greatest value and its sustainable model. As much as viewership of streaming services has grown, the economics of the business have remained challenging for most providers.


So a consolidation of video streaming services always was inevitable. The economics of a direct-to-consumer business, as attractive as the idea always has seemed for programmers, simply does not scale, for most content providers. Most networks do not have the audiences to operate DTC. Limited audience means  limited advertising upside and limited subscription revenue as well. 


At some point, most networks and content providers are going to have to become content suppliers to one or more streaming services, and get out of DTC. The advantage of the cable TV model was that smaller networks did not have to worry about distribution costs. 


The cable operators handled that. Moving to DTC means building a new distribution network, and investing in marketing as well. At least so far, that has proven daunting for most networks. 


In the linear model, smaller networks had a way to gain carriage (shelf space). Sometimes payments to operators worked. In other cases, “must-have” lead programming could be signed by a distributor only when lesser-viewed networks operated by the same content owner also were carried. 


As streaming providers rethink their business models, reducing investments in original content and adding advertising models, most content owners might eventually conclude that DTC simply does not work. 


Streaming is gaining viewing share, of course. The issue is how many entities will be able to survive long term, and what various competitors will have to do to sustain themselves. Up to this point, sports have been the enduring value of subscription video as pre-recorded content viewing has moved to streaming services. 


Even that could change as more sports rights are acquired by streamers. So some believe broadcast television's future is as a home for unscripted series. Major sports events and, for some, news also should contribute. 


Most consumers are eventually going to look at their actual viewing habits and conclude that the whole cable bundle comes down to a handful of networks or channels, with most of the pre-recorded content being watched on streaming services. 


In my own experience, live news and sports are the only forms of content being viewed on a linear service. Others might report reality TV as the key content type being watched. But that obviously shapes the value proposition of linear video, broadcast TV and streaming services, as well as the magnitude of possible monetization models.


Is Connectivity an Intangible Product?

Are connectivity products tangible or intangible? Are they products a customer can see and touch or are they services whose quality and experiences must be purchased first, before they can be evaluated? 


The answers matter, as intangible products require proxies for value, since the customer actually has no way of examining or testing the “product” before buying it. That is why brand is so important, or the quality of customer service. 

source: Simplicable 


Customers must use such proxies for value as a way of evaluating potential suppliers, and that arguably goes for connectivity service providers as well.


Some might argue connectivity is "tangible." Well, routes are quantifiable, so perhaps tangible in some sense. Addresses are tangible. Physical locations are tangible. Perhaps quoted capacity is tangible. Compute cycles are quantifiable.


But perhaps those attributes are similar to aircraft, crews and landing rights when people buy "air travel." Buyers might need compute cycles, access to certain buildings and locations and capacity at certain levels. But that is the equivalent of aircraft, departure frequencies, crews and landing rights.


No customer can really judge, before buying, the "quality" provided by one connectivity provider, compared to another, or one computing services host, compared to another. Computing and connectivity remain "intangible" products.


What Speed Tests Might, and Might Not, Indicate

What does this plot of speed tests conducted by U.K. consumers tell us? In principle, it only tells us that there are fewer tests on copper connections; about the same number of tests on hybrid fiber coax networks; declining tests on fiber-to-curb networks; while fiber-to-home customers conduct more tests.


Presumably, the number of tests is related to the number of accounts. But the number of tests also could be related to the number of trouble tickets or network issues. Most of us are prompted to test only when there is some obvious connectivity issue. 


But it also is possible that users on some of the latest networks (FTTH) are testing for other reasons, such as verifying that speeds are really faster than on the older networks. 

source: Think Broadband 


Also, since most such tests appear to be conducted from Wi-Fi-connected devices, the number of tests also likely reflects Wi-Fi issues that users are having, and that is more a reflection of indoor Wi-Fi issues than a reflection of the access network connection. 


Actual internet service provider delivered speed is going to be higher than what a Wi-Fi test shows, and also could be lower if multiple other apps or multiple users are active during the test period.


Testing algorithms also vary, which is why the same device, on the same network, yields different test results when different testing services are used. All this data appears to be from the ThinkBroadband test, so results should be comparable.

The point is that historical data on "speed" is shaped by the testing methodology: users mostly test on Wi-Fi, which almost always is slower than the ISP's "to the home" speed.

Monday, January 2, 2023

Which Path for Video Streaming?

It is not yet clear whether video entertainment facing internet disruption will follow the path of the music and print media industries, or somehow can evolve in a way similar to retailing. In other words, will the future video entertainment business be bigger or smaller than the linear business it displaces?


It is conventional wisdom these days that video streaming has failed to replace losses from linear TV subscription declines. In some ways, the comparison is a bit unfair. Streaming is a new business, which means development costs and investments are high, compared to customers and revenue, as generally is true for most new lines of business being created for the first time. 


Linear video subscriptions are a declining line of business, but can be harvested for revenue without undue investments. So we are comparing a declining business with a growing and new line of business. One can harvest revenues from a legacy business. One has to invest to grow a new one. 


Also, in a linear video model, content providers can spend less on delivery infrastructure, as the distributor takes care of that. In a streaming model, the delivery infrastructure has to be built. 


In the linear model, content provider marketing costs are lower, as the distributor takes primary charge of that function and absorbs the cost. In a direct-to-customer streaming model, the content provider has to spend more on marketing and sales. 


There are other differences as well. Customer churn--which increases operating costs--for streaming services is higher than for linear TV services. One big reason is that customers can binge watch a hot new series and then churn off once they are finished. 


Also, a linear video package is itself a bundle, with economy of scope advantages. Most buyers are aware that buying in bulk correlates with lower cost per unit. Unbundling content eliminates much of that advantage. To be sure, any single streaming service remains a bundle of content. 


If you think about one of the main complaints about linear TV, which is that customers pay for products they do not use, you get the idea. The linear bundle increases profits for the whole ecosystem because customers are forced to buy products they do not want, do not use, do not value. 


The economic argument is quite similar to that the industry debated a couple of decades ago: whether unbundled, a la carte network access would at least be revenue neutral compared to the existing cable TV bundle. A la carte sales models imply lower ad revenues, lower subscriber counts and therefore lower subscription revenues. 


In principle, ability to buy content “by the piece or by the episode”  allows customers to buy only what they want. And consumers resonate with that idea. The issue is whether content suppliers can afford to grant access at sustainable prices. Consumers almost always value a bit of content less highly than the content owners selling it. 


Most consumers already have discovered they need more than one streaming service to satisfy their needs. Ironically, that defeats the purported value of “lower prices” for any single streaming service. 


But content scope never is as great as with a linear package, which delivers many networks. Each streaming service is, in essence, a single network. Today, most content providers make most of their money selling content rights to cable TV providers. As that revenue stream shrinks, it is poised to shrink faster than streaming revenues can replace the losses.


source: MoffettNathanson


Of course, the linear video model has gotten more precarious for lots of reasons beyond the existence of video streaming alternatives. As content prices have kept climbing, it was inevitable that the cable TV bundle would reach a level where the value-cost relationship would be seen as unfavorable by a growing number of consumers.


Unbundling video content access almost inevitably leads to higher costs per unit, for suppliers and consumers. It is possible a smaller industry therefore results, as less-popular networks get squeezed out. 


Of course, under some circumstances, unbundling also might allow some niche content to thrive. As has become the case in the music industry, where consumers now buy “songs” a la carte rather than “albums” (a bundle), some niche formats might find a way to survive. 


But that survival also likely will hinge on creation of new revenue and monetization mechanisms, as most bands now make their money from concerts, not selling pre-recorded music. 


For programming “networks” (streaming services as well as broadcast TV or cable networks), survival might require expanded business models where the networks themselves are not required to generate high profits, but enable some other revenue model to to flourish. One thinks of Amazon Prime, where the revenue comes from memberships and higher e-commerce transaction volumes. 


Streaming has not, so far, proven able to replace lost linear video losses. Whether that always will be the case is the issue. 


E-commerce arguably has not led to a smaller retail industry, as much as it has reshaped the fortunes of legacy suppliers. But most would likely agree that newspaper/magazine (print) industry revenues are lower than before the online disruption.


The music industry might arguably also be smaller than before online music distribution. Whether video content follows the path of print media and music, or the pattern of retailing, is not yet clear.

Sunday, January 1, 2023

Methodology Always Matters When Measuring Price Changes for Home Broadband

When tracking any market, one has to be clear about what constitutes “the market.” If one wanted to track home broadband prices, for example, the inclusion of a huge amount of non-related services would skew the data. 


The U.S. Bureau of Labor Statistics, for example, includes “landline, telephone and TV services bundled with residential internet service; mobile internet access” in the definition. 


The BLS uses the same approach for “cable TV service.” The big problem, in the U.S. market, is that most consumers buy their services (home broadband, subscription video, fixed network and mobile voice) as a bundle. By some estimates, in the U.S. market, 60 percent to 75 percent of internet access plans are bought in a bundle. 


The same is true for European Union markets, where over a third of all consumer services--both fixed and mobile--are bought in a bundle.  


In some markets more than 90 percent of services are purchased as part of a bundle.  


So one has to make assumptions about how to apportion the “cost” of each bundle element. It is not clear that the BLS has a procedure for doing so, and if it does have a methodology, it does not publish the assumptions. 


What BLS does say is that “when selecting samples in either the residential telephone services, internet services, or cable and satellite televisions services categories, if a bundled service is selected, it is assumed the customer’s primary intent is purchasing the service defined by the CPI category,” says BLS. 


For example, phone service must be included in the service bundle along with either internet or television services when selecting the sample in the residential telephone services category, says BLS.


To be sure, in principle, it should not matter what the stated rates are. Only the cost differential matters. The issue is that if bundle elements change at different rates, or in different directions (up or down), the bundle price changes only partially reflect price changes for the “lead” service. 


In other words, if home broadband prices decline, but video and voice charges climb, there is some distortion. Prices could have risen or dropped based on implied price movements for the other components of the bundle. 


That is particularly the case when video prices are part of a home internet bundle. 


source: BLS 


The point is that when large percentages of consumers buy services in a bundle, BLS attributes all of the bundle cost to one service selected by survey respondents. The time series data, in principle, should then not be affected, as the only metric tracked is degree of change for the bundle. 


In practice, it might matter which of the bundle components are selected, as price change rates vary for each major bundle element. Video prices increase the most, followed by voice service. Home broadband prices decline. 


In other words, if a survey respondent chooses “home broadband” as the anchor bundle service, then the cost of TV and voice, when applicable, are said to be part of “home broadband” cost. In principle, home broadband costs then are inflated. 


The reverse is true when “video” is selected as the anchor service. Then the lower price of home broadband understates video price changes. 


Separately, the BLS now uses a hedonic method to account for changes in product quality. In other words, BLS accounts for qualitative changes to existing products (computers, home broadband, for example) where performance changes dramatically for a class of product, over time. 


source: BLS 


As always, when measuring price changes, the details and methodology do matter. 

---------------------------


How Much Revenue Do AWS, Azure, Google Cloud Make from AI?

Aside from Nvidia, perhaps only the hyperscale cloud computing as a service suppliers already are making money from artificial intelligence ...