Thursday, July 22, 2021

86% of U.S. has Home Density of 15 Homes or Fewer Per Plant Mile

Rural fixed network plant is expensive, on a per-location basis. Most of the land surface of the United States consists of areas where a mile of fixed network plan passes no more than 15 homes, for example. 


In the United States, areas with linear plant density of 15 homes or fewer represent nearly 86 percent of the area of the lower 48 states, yet contain just  12 percent of the locations.


source: CQA 


That is one reason why U.S. fixed networks often take so long to build. Earning a profit from investments in new plant is difficult, most places.


Mobility Still Drives AT&T, Verizon, T-Mobile Revenue, but Growth Options Differ

As is the case for Verizon, AT&T’s financial results hinge on its mobility unit performance. As always, it is helpful if revenue contributions from consumer fixed network and business services hold their own, but marginal improvement is driven by mobility segment performance. 


source: AT&T 


Verizon’s second quarter 2021 results show the same pattern. Revenue growth is driven primarily by consumer mobility services. Business customer revenue was flat sequentially. 


source: Verizon 


T-Mobile has no fixed line business, so all of its growth comes from mobility services. Also, T-Mobile has zero share of fixed network services for consumers, so will seek growth by taking home broadband share from cable operators and others. In its mobility business, T-Mobile has been under-represented in mobility sales to businesses, and will try to wrest share there as well. 


New lines of business remain important for all three firms, though opportunities vary. The easiest path for an attacker in any market is market share gains, as one can see with T-Mobile over the last decade. Incumbents have far fewer opportunities, but even so, gaining share is still possible outside the existing geography, which is what Verizon banks on with its fixed wireless services. 


AT&T has other constraints. It is the share leader in fixed network geography. So it has relatively less to gain if it seeks additional fixed network share outside its fixed network footprint (and regulators might not allow it to do so). AT&T plans to take additional mobility share, but 


The company also has fallen to third in mobility account share, so it will try to recapture some share there. The constraints are T-Mobile’s higher rate of growth and the coming impact of competition from Dish Network and cable operators as well. 


The point is that T-Mobile and Verizon are better placed to grow by taking market share in existing markets. AT&T is almost forced to look for growth elsewhere, as its opportunities to grow by taking share in existing markets is more limited. 


Though the strategy has been panned by most observers, AT&T’s forays into video entertainment and content were driven in large part by that set of circumstances. The company simply could not grow revenues and cash flow significantly by taking market share, in any of its major lines of business. 


Despite spinning out its Warner Media and DirecTV assets, AT&T still will capture 71 percent of the revenue and cash flow from both assets, even as those assets are removed from AT&T’s books. 


Most characterize the asset dispositions as a case of AT&T “getting out of” the content business. It might more properly be characterized as moves to reduce debt by monetizing some of the value of those assets, while retaining 71 percent of the cash flow and business upside, while allowing its workforce to concentrate on growing the mobility business.


Why Buy Rural Fixed Network Assets?

There is one good reason why any buyer would look to acquire rural telco copper-based network assets, and that is the assumption the assets can be made to produce higher revenue, higher profits and higher equity value, after reasonable capital investment and acquisition costs.


Perhaps the key assumption is that an upgrade to optical fiber would allow the firm to reach 50-percent market share (installed base, actually) of the home broadband market, with some incremental revenue contribution from voice, cell tower backhaul, business services and possibly other value-added services.


But all business cases will turn on consumer services. Assume consumer revenue of about $50 a month per connection, or about $600 per year per line, for copper facilities. That is a blend of voice service, subsidies and internet access service, with voice market share of perhaps 40 percent and internet access share of perhaps 30 percent. 


The big bet is that an upgrade to fiber-to-home facilities could boost average revenue per account to perhaps $100 per customer, per month, while also creating the means for boosting other revenue sources as well.


Some households conceivably could hit $200 to $250 per month, BCG has argued. That likely would happen in exurban geographies that are less rural than 15 homes per mile of linear plant, and likely also assumes high take rates for triple-play services.


That last assumption is the most questionable, as it has proven uneconomical for most smaller internet service providers to make money on video services, always a scale business but doubly so as demand declines.


source: BCG 


Most potential acquirers will likely focus instead on internet access and a few other incremental revenue sources, without factoring video entertainment into the model.


Potential buyers (private equity or other) might bet they can boost internet access share to 50 percent and boost average revenue per account by as much as 100 percent, the key change being an increase in internet access revenues from perhaps $30 to $80 per account. 


Many estimate that connecting a rural home could cost four to five times as much as connecting a suburban home, so the issue is whether there is a business model, including payback time for investments. 


As a rule of thumb, areas with home density less than 15 per linear plant mile probably represent fiber upgrade costs between $8,000 to $10,000 per home. At 50-percent penetration that implies per-customer costs between $16,000 and $20,000. Without subsidies, that is a daunting, if not impossible business case. 


The sweet spot might therefore be areas where capex requirements are a more-modest two to three times suburban cost, and where it is feasible to boost ARPU 100 percent or more.


Global Bandwidth Growth Reflects New Business Models, Computing Architectures, Media Types

Wide area network bandwidth used to be scarce, and therefore expensive, in the decades where the primary application requiring WAN bandwidth was voice communications. In the late 1980s, for example, the cost of WAN capacity of about 1 Mbps was significantly more than $10,000 a month. And speeds were in the kilobytes per second range. 


By 2012 costs had fallen to a few dollars a month, a difference of about four orders of magnitude. In part, we can credit Moore’s Law for the improvements. But business models and use cases also drove the demand for cheaper WAN bandwidth. `


source: Backblaze


Lead applications have changed. But so have whole business models and revenue streams. International and long distance voice used to be the profit driver for telcos. These days, mobility and internet access are the drivers. But voice never is a bandwidth hog, mobile or fixed.


As the internet has become the preferred delivery mechanism for high-bandwidth apps such as video entertainment, bandwidth requirements have shifted accordingly. The business case for streaming video does not exist without cheap bandwidth. In other words, cost for bit has to be orders of magnitude lower than previously.


With TCP/IP the global choice of "next generation platform," with the shift to cloud computing and remote storage, a shift from multicast (broadcast) to unicast content, plentiful and cheap bandwidth is the new requirement.

source: Telegeography 


At the same time, there are new locations where that demand is generated. 

These days, voice demand is paltry in relation to content bandwidth--largely video--that flows between hyperscale application provider data centers and internet points of presence where local internet service provider traffic pours onto the backbones. 


In other words, if you know the locations of the hyperscale app provider data centers, you also know the locations between which most data flows over WANs. 


source: Telegeography 


Also, it is hard to overestimate the role played by consumer content as the media type that underpins most WAN traffic need. 


source: Telegeography 


Though the role of content is not so dominant on every route, content dominates traffic moving across the Pacific and Atlantic oceans and within Asia. 

source: Telegeography 


Wednesday, July 21, 2021

Ecosystem, Platform, Value Chain: What's the Difference?

Ecosystem is one of those buzzwords used without explanation, all the time. Some appear to use the term “ecosystem” to describe the range of partners a firm may have. 


Others appear to use the word to describe third-party applications that interwork with, or are available to use, on a device or a network. 


Finally, the classic, pre-digital and pre-internet “ecosystem” was a vertically-integrated end-to-end solution. 


The term might be confused with platform. The issue there is that there are several different ways the term is used. In the computing business, a platform is a set of hardware or software upon which other third-party apps can run. So Windows has always been seen as a platform, as have the Intel line of processors. 


In that sense, the internet is a platform for both communications and applications. But there is a new sense of the term that refers strictly to business model, not computing or communications infrastructure. 


In the internet era a new meaning has emerged. A platform is a business model based on an entity that acts as an exchange, connecting buyers and sellers. 


source: Simon Torrence 


A platform business model essentially involves becoming an exchange or marketplace. A pipe model requires a firm to be a direct supplier of some essential input in the value chain.


A platform functions as a matchmaker, bringing buyers and sellers together, but classically not owning the products sold on the exchange. A pipe business creates and then sells a product directly to customers. Amazon is a platform; telcos and infrastructure suppliers are pipes. 


Amazon is a platform. Etsy is a platform. Uber and Lyft are platforms. Airbnb is a platform. All connect buyers with sellers; sellers with sellers or buyers with buyers. None of those platforms “owns” the assets traded on the exchange. 


It all boils down to “who makes the money” and “how” the money is made. Even when understood as a business-to-business marketplace, a bandwidth exchange, for example, a key principle is that buyer and seller transactions volume is how the platform makes money. 


A true platform in the digital commerce sense does not own the actual products purchased using the platform, and makes money by a commission or fee for using the platform to complete a transaction. A ridesharing platform does not own the vehicles used by drivers. A short-term lodging platform does not own the rooms and properties available for rental. An e-commerce site does not own the products bought and sold using the platform. 


“Ecosystem” sometimes also seems to be used in the sense of value chain, a business model that describes the full range of activities needed to create a product or service. 


source: Analysys Mason 


Also, firms have for decades been moving towards products that combine physical goods with software; content with appliances; implements and experiences. Among the classic examples in the mobile device business is Apple bundling devices with content; device with app store; device with payment mechanisms; sales with support. 


Almost by definition, ecosystems are loosely coupled. There might not be a direct business relationship between any two firms in an ecosystem. Ecosystem participants might come from distinct industries, geographies or roles. So digital ecosystems are quite complicated


“A digital ecosystem is a complex network of stakeholders that connect online and interact digitally in ways that create value for all,” says Tata Consulting Services. 


It is hard to organize an ecosystem. It is difficult to create a platform business model. It can be tough to develop a value chain. For most businesses, creating a simple role within a value chain is task enough. 


Acting as a retailer of products to end user customers, for example, can be complex enough. Creating ecosystems or platforms is quite something else.


Tuesday, July 20, 2021

Who Wins With 5G and Why

In retrospect, we might argue about whether the adoption rate of 4G globally or in any single country "has really mattered," and if so, how, and for whom. Without a doubt, 4G has mattered for video content providers, social media apps and platforms. Given widespread consumer use of such apps, it is arguably the case that consumers have benefited. It is less clear it has benefited mobile operators as much.


What happens with 5G is unclear at the moment.


We aren’t sure yet how fast 5G will be adopted, compared to 4G experience. For that reason, subscriber totals in five years will vary quite a lot: as much as 100 percent. What is more important is the average revenue per user or average revenue per account trend.


Can 5G lift ARPU or ARPA, and if so, by how much? 


If there is no ARPU or ARPA change, then the number of 5G accounts swapped for 4G will not matter much, in the near term. Longer term, it will matter if new use cases--requiring 5G capabilities--develop. 


Scale matters, so adoption rates matter. New use cases will develop faster when developers can assume a significant portion of users have the new 5G capabilities. 


There will be 3.9 billion 5G mobile subscriptions globally by the end of 2026, GlobalData predicts. GSMA, on the other hand, estimates there will be 1.8 billion 5G mobile subscriptions in 2025. At a 20-percent growth rate, that implies 2026 subscriptions of perhaps 2.2 billion. 


On a base of nearly nine billion accounts, those forecasts imply adoption ranging from a low of 20 percent to more than 40 percent by 2026. 


Statista estimates 2026 5G subscriptions at about 3.5 billion; Bankr suggests 5G subscriptions will reach four billion as early as 2025. Ericsson forecasts about 3.5 billion 5G accounts by 2026. 


Much hinges on the  predicted adoption rate, the expected adoption inflection point and the time of 5G availability. It took four to five years from launch for 4G to reach a growth inflection point, where the rate of adoption accelerates. 


source: Ericsson 


The issue is whether 5G is adopted at the same pace, faster or slow than 4G. It also matters when 5G is launched in each country and how fast mobile operators decide to deploy. Many operators are controlling 5G capital investment by deploying at a deliberate and measured pace. That also has implications for subscriber figures. 
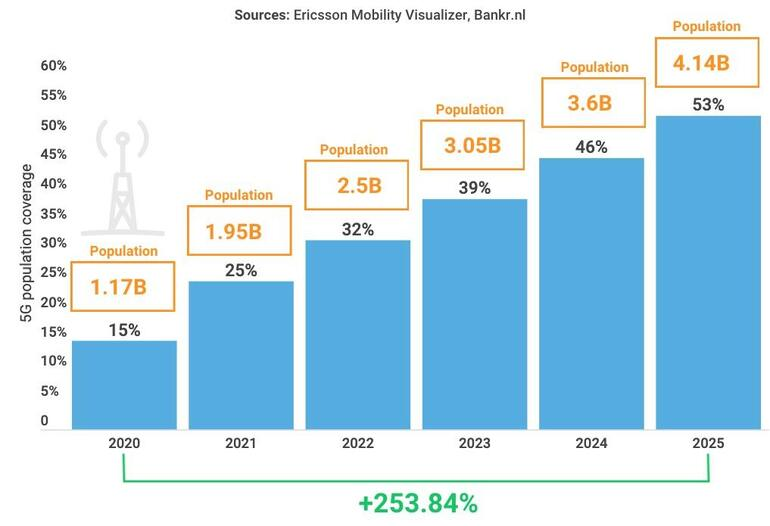

source: Bankr 


Perhaps of equal importance are 5G average revenues per account. GlobalData expects global 5G service revenues in 2026 of $609 billion, propelled by monthly average revenue per user (ARPU) of $14.15, more than double 4G’s monthly ARPU. That would be a really big deal, if it happens. 


As always, “average” might not mean much, as account revenue ranges from a dollar or two dollars in some countries to more than $40 in other countries. 


source: S and P Global Market Intelligence 


Still, the real question is not how fast 5G is adopted, but what the revenue implications might be. A bit faster or slower is an issue, but not so much as wether revenue per account is the same as 4G, lower than 4G or higher. 


A doubling of ARPU or ARPA would be truly significant. 


App providers might gain from new 5G platforms able to use specific 5G-enabled capabilities (speed, latency, network slices, edge computing, internet of things, private networks). As those features are rolled out, consumers should benefit from experiences not possible on 4G and older networks.


The big surprise would be if mobile operators also directly benefited in terms of business models, revenue and profit. Also, how much they could benefit will be important.


Sunday, July 18, 2021

70% or More Digital Transformation Initiatives Fail

When digital transformation initiatives fail--and there is no particular reason to believe the track record for DX will be much different than the history of all information technology projects--the reasons for failure will also likely be the same:


  • Company Culture is not aligned

  • CxOs do not really support it

  • Silos

  • Knowledge gaps about cause and effect

  • Indecision or tepid initiatives

  • Technology novelty not harnessed to business processes

  • Expectations not in line with reality

  • Not iterating fast enough

  • Human capital mismatch

  • Lack of continuity and consistency

  • Unclear vision

  • Business and IT execs do not agree on objectives

  • Organizational inertia

  • Lack of employee buy in

  • Governance not aligned


source: BCG 


Historically, up to 70 percent of information technology projects fail to meet their objectives. Some would argue the digital transformation failure rate is the same. Some industries do better than others, especially consumer-facing businesses and industries. The success of e-commerce is one likely reason why that occurs. 


The important point is that only 20 percent to 30 percent of digital transformation efforts are likely to succeed. 

source: KPMG 


And some industries do better than others. Consumer-facing businesses do better because e-commerce is such an easy decision to make. You might not be surprised that public sector initiatives are the least successful, according to an analysis by BCG. 


source: BCG


source: BCG


Directv-Dish Merger Fails

Directv’’s termination of its deal to merge with EchoStar, apparently because EchoStar bondholders did not approve, means EchoStar continue...