Tuesday, January 4, 2022

U.S. Population Density is a Bigger Problem Than Maps

Few observers, it seems, are completely happy with the state of home broadband maps. Some argue the maps distort availability by as much as 21 percent.  Others argue the degree of distortion likely is less than many believe, perhaps on the order of five percent, according to an analysis by George Ford, Phoenix Center for Advanced Legal and Economic Public Policy Studies chief economist.  


Others note that the lack of access to fixed network “broadband internet access” at a minimum of 25 Mbps is between five percent and six percent. If satellite access is included in the analysis then virtually all continental U.S. locations have access to service at 25 Mbps. 


Inaccurate maps are only part of the story, however. U.S. population density is quite thin across most of its geography. That directly affects the cost of building broadband networks, as hefty subsidies are required to reach the last one percent or two percent of remote locations. 


And the United States has a huge percentage of its land mass that is thinly settled, if at all settled. 


In Canada, 14 percent of the people live in areas of density between five and 50 people per square kilometer. In Australia, 18 percent of people live in such rural areas.


In the United States, 37 percent of the population lives in rural areas with less than 50 people per square kilometer.


Put another way, less than two percent of Canadians and four percent of Australians live in such rural areas. In the United States, fully 48 percent of people live in such areas.


Coverage is an issue in such rural areas. About six percent of the U.S. land mass is “developed” and relatively highly populated. Those are the areas where it is easiest to build networks. 


But about 94 percent of the U.S. land surface  is unsettled or lightly populated, including mountains, rangeland, cropland and forests. And that is where networks are hardest to build and sustain. 


Industry statistics often suggest coverage is far better than critics say. The reality is likely that the maps are faulty, but coverage is still far better than some believe. 


The Federal Communications Commission says 98 percent of U.S. homes have access to  internet access at a minimum of 25 Mbps and 84 percent subscribe. Critics say those numbers are inflated by bad maps. 


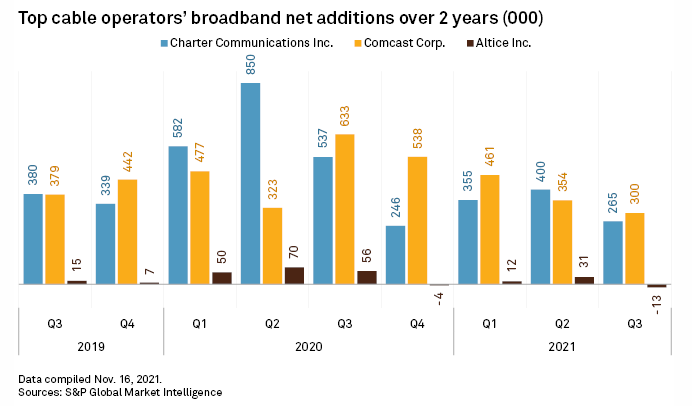
But one virtually never hears complaints that the leading U.S. cable companies do not, in fact, supply 500 Mbps (Charter Communications to 0gigabit internet access (Comcast) to nearly 100 percent of their customer locations. Add in Cox Communications and those three firms cover more than 75 percent of U.S. homes. Cox supplies gigabit access to 100 percent of its customer locations. 


Gigabit speeds now are available to more than 88 percent of all U.S. homes, according to the Federal Communications Commission. Other estimates peg the percentage of homes with cable high-speed access at 90 percent. 


One can disagree with the FCC statistics and still not quibble that cable operators generally do supply coverage within their franchise areas that is substantially at 100 percent and offering speeds between 500 Mbps and 1 Gbps. 


Consider rural telco networks. “Respondents to this year’s survey report an average of 4,467 residential and 469 business fixed broadband connections in service,” NTCA says, with an  average of 7,581 serviceable locations. 


Respondents report an average of 72 percent  of customers in their areas subscribe to a broadband service of some speed. 


“On average, three-quarters (75.0 percent) of serviceable locations are served by fiber to the home (FTTH) in 2021; this is an increase of 5.1 percentage points from the prior year’s survey, says the latest Broadband/Internet Availability report issued by NTCA says. 


An average of 15 percent of locations continue to be served via copper loops while fiber to the node (FTTN) is used to serve an average of six percent serviceable locations. Cable modems service 2.7 percent of locations, licensed fixed wireless 0.7 percent and unlicensed fixed wireless 0.6 percent of locations. 

source: NTCA 


As for maximum speeds 55 percent of locations can get speeds between 100 Mbps but less than 1 Gbps. Some 20 percent of locations have maximum speeds between 25 Mbps and 100 Mbps.


Some 10 percent of locations have maximum speeds between 10 Mbps and 20 Mbps. About 3.7 percent of locations get speeds below  10 Mbps. 


To be sure, the data is self reported. One might argue that firms that did not respond to the survey have coverage, speed or physical media attributes quite different from firms that did report. 


Still, coverage in rural areas might be less a problem that generally is talked about.


Sunday, January 2, 2022

More Drivers for U.S. FTTH Business Model

U.S. cable operators will face more home broadband competition from telcos in the years to come, according to S&P Global Intelligence. Increased telco investment in fiber to home facilities is the reason. 


But the bigger story arguably is a shift in the economics of fiber to home facilities and the business model. In the late 1990s FTTH was seen as the only sure way to take market share in the linear video subscription business. 


Bundling (triple play or dual-play) also was seen at that time as the way to compensate for competition-induced account losses. While telcos or cable each competing across the voice, business customer, internet access and video entertainment markets might have fewer total accounts, revenue per account from triple-play services would compensate. 


source: S&P Global Market Intelligence 


But something else now seems to have changed. A decade ago, independent internet service providers began to attack the market increasingly based on one service: home broadband. To be sure, many independent ISPs tried a dual-play or triple-play approach for a time. 


But nearly all eventually settled on a home broadband-only approach. Since virtually all independent ISPs face both telco and cable TV competitors, the single-product business model makes some concessions on potential revenue that necessarily must be balanced by lower capital investment and operating costs. 


The latest developments are that such tradeoffs are seen as feasible even for incumbent telcos: in other words, the business model increasingly relies on broadband as the foundation, with some contributions from voice. Video (linear or streaming) plays a lesser or no role in revenue assumptions. 


There are other changes. Subsidies have been rising for broadband deployment, and that also changes the capex requirements. Some of the investment in optical fiber also is helped by the denser optical fiber networks necessary to support 5G networks. Essentially, the payback model is bolstered by the ability to defray some optical media costs from mobile service revenue opportunities. 


Also, 5G supports home broadband using the same transmission facilities as does mobile service, often offering a chance for mobile operators to compete in the home broadband business at relatively low incremental cost. That also helps lower the cost of fixed network FTTH as more revenue is wrung from the installed assets. To the extent that higher revenue produces incrementally higher free cash flow, more capital is available to invest in additional FTTH facilities.


The incremental cost of consumer home broadband is lower once a dense trunking network must be put into place to support small cell mobile networks. 


Also, the value of FTTH facilities has changed as rival investors (institutional investors, private equity) view consumer broadband as a legitimate alternative investment. That boosts the equity value of an FTTH network and supplies new sources of investment. 


Also, the cost of FTTH construction has improved steadily over the past few decades. Also, the expected reduction of operating costs from fiber networks, as opposed to copper networks, now is well attested. So there are opex savings. 


FTTH remains a challenging investment, nonetheless. But it is noteworthy that assumptions about the business model now have changed for incumbent and new providers as well. Where it once was thought an FTTH upgrade virtually required revenue from three services, in an increasing number of cases the investment can be justified based on home broadband alone. 


In greater numbers of cases, the primary value of home broadband is supplemented by some revenues from other sources. But where a triple-play might have produced $130 per month to $200 per month revenues, home broadband might produce $50 to $80 a month. 


That projects increasingly are feasible with a $50 monthly revenue target and adoption around 40 percent to 50 percent shows how much the capex and opex assumptions have changed.


Friday, December 31, 2021

5G Fixed Wireless Might be the Biggest Near-Term New Use Case, in Terms of New Revenue Sources

As easy as it might be to dismiss fixed wireless, it might be equally easy to overstate its impact. At the end of 2021 there might have been about 70 million fixed wireless connections in service globally, according to Deloitte. Ericsson believes there were as many as 90 million fixed wireless connections in service in 2021.  


So how significant is that? Perhaps not so significant when service providers have other alternatives. But fixed wireless might be highly consequential for service providers that can use fixed wireless to compete in the home broadband market where they had not be able to do so, in the past.

source: Deloitte 


By the end of 2021 there were about one billion fixed network internet access subscriptions, according to Point Topic. So fixed wireless represented possible seven percent to nine percent of fixed network internet access connections globally. 

source: Point Topic 


So fixed wireless clearly is incremental to use of other platforms, though arguably of high importance to many infrastructure suppliers.


On the other hand, fixed wireless can be incrementally important for some service providers. For some service providers it might represent a business case that other platforms cannot match, allowing those firms to compete in the home broadband for the first time, or more effectively.


That might especially be true in geographies where the cost of building cabled networks is not feasible, or where subsidies of some sort are not available to help defray the cost.


Mobile-only firms formerly unable to compete in the home broadband market, or unable to compete for much of that market, might find 5G fixed wireless viable. 


5G fixed wireless connections could--in many cases--provide significant incremental revenue growth, allowing mobile operators to compete for home broadband accounts now largely the province of fixed network operators. 


Assume global  gross national income per capita of about $11,600 and a monthly home broadband cost of five percent of GNI per capita. That is about $580 in annual revenue per line. 


So 75 million new fixed wireless accounts represents perhaps $43.5 billion in new annual revenue for mobile service providers. That can take the form of new accounts or market share taken from other suppliers. 


Fixed wireless using 5G will by 2026 support 180 million connections globally and generate US$70 billion in revenue, accounting for 40 percent  of the total fixed wireless access market, according to ABI Research. 


Adoption likely will be highest in markets where the cost of deploying fiber to home or hybrid fiber coax remains unworkable, and where demand for moderate-speed internet access is high. Some might argue that 5G fixed wireless is most directly the successor for 4G fixed wireless and digital subscriber line. In some markets that opportunity might last for a substantial amount of time.


5G fixed wireless might be especially important for firms that have not yet been able to compete in all of most of the home broadband market. For T-Mobile in the U.S. market, that represents a huge opportunity, since T-Mobile has had zero percent share of the home broadband market. 


And Verizon expects that fixed wireless will underpin as much as 71 percent of the potential locations it will reach for home broadband service by about 2025. 


Some will counter that 5G fixed wireless speeds will not generally match those of fiber to home or cable modem services. That is likely to be true.


But 5G fixed wireless is likely to be attractive to a substantial portion of the market. In rural areas, where service might only be available in the 50 Mbps range, that still could be competitive.


Overall, about 20 percent of U.S. home broadband buyers purchase services operating no faster than 100 Mbps. So the issue is general availability of fixed wireless services offering speeds of 100 Mbps to  200 Mbps. 


source: Openvault


Nearly half the market presently buys service operating between 100 Mbps and 200 Mbps. And nearly 68 percent of the U.S. market buys service operating no faster than 200 Mbps. 


Also, the U.S. home broadband market is big enough that gaining just a couple of points of the installed base and market share generates substantial revenue. By 2023, fixed wireless might represent about 4.5 percent of all home broadband accounts , some estimate.  


To put that into perspective, consider projected revenue for other new services. In 2024, it is conceivable that  IoT connectivity revenues for mobile operators globally could  be in the low millions to tens of millions of dollars, according to Machina Research. Millions, not billions. 


In 2026 the global multi-access edge computing market might generate $1.72 billion. Even if one assumes all that revenue is connectivity revenue booked by mobile operators, it still is a far smaller new revenue stream than fixed wireless represents. 


In 2020 there were perhaps 80 million fixed wireless subscriptions in service. Researchers at Mobile Experts see that number growing to almost 200 million by 2026. 


Ericsson notes that more than 70 percent of all service providers now offer fixed wireless access   services. Ericsson also predicts that fixed wireless connections will exceed 180 million by the end of 2026.


By 2026, assuming these forecasts are accurate, fixed wireless will represent about 12 percent of fixed network broadband connections, Ericsson estimates.  


Keep in mind that the incremental revenue from 75 million 5G fixed wireless connections does not include the revenue from 4G fixed wireless connections, which might represent another 110 million connections. 


That represents an additional $104.3 billion in annual revenue, assuming a global average of $48 per month, per line. 


The point is that incremental revenue from 5G fixed wireless might dwarf new revenues earned by mobile operators from edge computing and internet of things.


Thursday, December 30, 2021

"Both And" Will Prevail for Network Slicing, Private Networks, Edge Computing

Engineers tend to be a practical lot. They are used to tradeoffs when considering any technology solution to a business problem. For that reason, though they can get involved in "religious" arguments about solutions, most of the time they will acknowledge that there almost are multiple ways to solve any particular problem.


To the extent that network slicing (virtual private networks) is a solution for some latency, bandwidth or availability issues, both private networks and edge computing provide possible substitutes. 


So some might theorize that private networks and edge computing will minimize the market for network slicing or virtual private networks. 


In the end, this likely will shape up to be another “both and” outcome. As we once debated the extent to which Wi-Fi could be a substitute for mobile connectivity, the likely outcome is that we will use virtual private networks, edge computing and private networks, for different use cases.


As often is the case in the communications and computing businesses, there is no one size fits all solution. Wide area private networks can optimize latency, bandwidth,  support for low-power devices and apps or availability and reliability. 


source: STL Partners 


But edge computing can address those same problems. So can private networks. Both network slicing and edge computing are suitable for mass deployment apps. Private networks are better for single-enterprise apps. 


Private networks and edge computing arguably are better for supporting compute-intensive apps that also have very low latency requirements as well. Network slicing arguably is better suited for mass market, high-scale, highly-distributed apps. 


In the end, private networks will not be a complete substitute for network slicing, any more than edge computing will be a universal substitute for network slicing or private networks.


Correlation is Not Causation, for Broadband, Internet or Mobility

Some problems are difficult to solve: wealth disparities, including Pareto distribuion patterns; population density and economic growth that benefits most geographies and regions instead of urban centers.   


Though it is widely believed that broadband access leads to economic growth, that cannot be proved, though many studies suggest a correlation. But correlation is not causation


“A  positive relationship between broadband expansion and employment growth could arise for other reasons,” says Jed Kolko of the Public Policy Institute of California. “For example, if

broadband providers expand in locations where they anticipate future growth, then the positive relationship would in part or entirely reflect this strategic decision of providers rather than a causal effect of broadband on growth.”


“Alternatively, population growth could cause both broadband expansion and employment

growth: Broadband providers could invest in areas where population (and therefore demand for broadband) is growing, while at the same time population growth could cause employment growth in industries (such as retail, restaurants, and personal services) that serve local populations<” Kolko says. 


Virtually everyone believes it is “a good thing” for people to have access to roads, clean drinking water, electricity and internet access. Yet even when these goods are nearly-universally supplied, disparities in economic growth; job creation; wealth and income persist. Those forms of infrastructure are perhaps necessary but not sufficient to cause the outcomes. 


Likewise, economists Chris Doucouliagos, Professor of Economics, Deakin University and 

Tom Stanley, Professor of Meta-Analysis, Deakin University, examined 59 studies of economic growth in developing and developed countries. 


Even some studies reporting correlation between digital technology use and economic development note the uneven outcomes, ignoring for the moment the issue of correlation or causation. 


As always, we must separate causation from correlation. They find “evidence that ICT has indeed contributed positively to economic growth, at least on average.” In other words, as we all might expect, information and communications technology are correlated with economic growth.


But “benefit” or “contributed” value is not necessarily the same as causation. It is correlation and presumed “advantage,” to be sure.


The researchers find a greater “benefit” from mobile phones than landlines, for example. They argue that mobile service has a growth effect “twice as strong as landlines.” 


source: Researchgate 


But we can note the correlation in the reverse: since mobile phones have a global penetration rate in excess of 100 percent, while landline telephones have adoption only in the 

12 percent range. So one would expect greater correlation between mobile use and fixed telephone impact. 


Perhaps economic growth leads to higher mobile phone use. Perhaps the cost of building mobile networks, compared to fixed networks, is high enough to cause much-higher mobile availability. Perhaps mobile costs are lower, and value are higher,  than for fixed service. 


In other words, perhaps mobile usage is so high because its availability is so high; its costs relatively low; its value considerable for all sorts of reasons not dependent on contribution to economic growth. 


“In contrast, we find little evidence that the Internet has had a positive impact on growth,” say the economists at Deakin University. 


As a matter of public policy, virtually everyone believes all citizens should have electricity, internet, mobile and fixed communications, clean drinking water and sanitation. Most likely believe income and wealth disparities are a problem to be fixed, if possible. 


Most likely believe that economic growth, education and other quality of life measures in rural areas should be close to that of urban areas. 


But disparities stubbornly persist. It is one thing to prefer ubiquitous access to infrastructure. But it is quite something else to believe that once provided, such ubiquitous infrastructure actually can overcome all the other background factors that create disparities of wealth, income, economic growth rates or other social amenities. 


Perhaps another way of stating the issue is that it is one thing to assure that necessary infrastructure is in place. It is quite something else to expect that what is “necessary” is therefore “sufficient” to cause different economic and social outcomes. 


Universal broadband access is a “good thing” to achieve. But it is no panacea for economic growth. In fact, we cannot actually prove that broadband “causes” growth. It might be easier to argue that broadband quality is itself an artifact of economic growth.


Wednesday, December 29, 2021

Wi-Fi Value Has Changed Since 3G

The perennial debate over Wi-Fi ability to substitute for mobile network access will not change in the 5G era. But user behavior could change as moble access speeds become a functional substitute for fixed (Wi-Fi) access and as unlimited-usage plans eliminate the financial incentive to switch to Wi-Fi access. 


Beyond a fairly low threshold (perhaps 25 Mbps to 50 Mbps), most apps do not benefit from higher access speeds. With a few exceptions, the primary benefits of higher-speed connections (500 Mbps to a gigabit per second) are enough bandwidth to support multiple devices and users simultaneously, plus any financial advantages of unlimited-usage plans, higher return bandwidth or other values bundled with the connection. 


As has been the case in the 4G era, Wi-Fi access might have more value for multi-user households; less value for single-user households and households where every inhabitant pays for their own mobile access. 


Mobile-only access wil have higher value for lower-income households and users, phone-centric users and younger adults. 


Unlimited-usage data plans will eliminate the financial incentive to switch to Wi-Fi, at least when mid-band spectrum is available to support 5G access, as there will not generally be a speed incentive to switch to Wi-Fi access. 


On the other hand, signal strength could be a more-inportant driver of behavior. Indoor signal coverage has been an issue since mobile operators began using frequencies around 2 GHz. Should that become a worse problem when other mid-band frequencies in the 3.5 GHz to 6 GHz range are used, then Wi-Fi offload will still make sense. 


In the 3G era, the advantage of switching to Wi-Fi was speed. In the 4G era the advantage was cost. In the 5G era, the advantage could often be signal strength. 


But T-Mobile believes customers of its unlimited usage  5G service are starting to rely on the 5G network and not shifting access to Wi-Fi. 


In mid-December 2021, T-Mobile said “13 percent fewer MAX users are connecting to Wi-Fi, 80 percent more are hosting a Wi-Fi hotspot and their hotspot usage is up 20 percent on average during the weekends.”


That is not unexpected, as the leading mobile service providers shift users to higher-priced unlimited usage plans that eliminate the financial incentive to switch to Wi-Fi. 


In 2021, Wi-Fi represented as much as 46 percent of total global end user IP traffic, according to Cisco. Mobile networks supported about 17 percent of total end user IPtraffic in 2021. Fixed networks delivered nearly 53 percent of internet traffic in 2021, compared to the share delivered by mobile networks, at about 21 percent, Cisco says. 


Usage varies by market. In India, about 98 percent of total internet access uses a mobile device. Globally, mobile users consume as much as 60 percent of total data on fixed networks (Wi-Fi).


In recent years, U.S. mobile customers have spent about half their connected time on Wi-Fi (fixed network), not the mobile network


By 2023, U.S. mobile users might offload as much as 75 percent of data consumption to fixed networks, some in the Wi-Fi community believe. But much hinges on how consumers behave when they have unlimited usage plans, which might reduce Wi-Fi consumption. 


source: Cisco, WiFiForward 


It might also matter how mobile tariffs are shaped. Home broadband allows multiple users and devices to share a single account. As mobile plans move towards unlimited usage, and if multi-user plans create incentives for smartphones to remain on the mobile network all the time, and if indoor reception is not an issue, then more users might remain connected to the mobile network all the time. 


An Ericsson study found that 5G customers on unlimited-usage plans reduced their reliance on Wi-Fi. In markets such as the United States, Taiwan, Switzerland, Finland and South Korea, where a higher proportion of 5G users are on unlimited plans, 22 percent have decreased their home Wi-Fi usage, while 14 percent have stopped using Wi-Fi after upgrading to 5G, Ericsson found.


Older data (from 2016) shows the same pattern. A 2018 analysis suggested that unlimited-usage mobile data plans decreased use of Wi-Fi by about eight percent. 


source: Nielsen 


Motivations can change over time. In the 3G era, users switched to Wi-Fi because Wi-Fi was faster than 3G. In the 4G era, when 4G was generally faster than Wi-Fi, the switch to Wi-Fi made sense because it reduced mobile data plan usage. 


The 5G pattern is not so clear, at least not yet. Assuming the financial benefit of switching to Wi-Fi is not present, then speed, signal stability or other advantages could be decisive. 


Tuesday, December 28, 2021

5G Uptake Will be an S Curve

Even if the 5G networks could magically spring up fully-deployed, with no construction obstacles, there would still be a lag between availability and customer acceptance. The reason is that not all customers are early adopters 


Early on, innovators and early adopters drive take rates. For them, the value of better performance is enough to create demand, even in the absence of compelling new use cases or applications. 


source: Researchgate 


Novelty does not create demand for mainstream customers, who need a value proposition oriented around some practical value beyond bragging rights. Mainstream customers must see a solution to some existing problem.


In some cases, that problem might be “predictability of service charges” more than “speed” as such. “No overage charges” is a value people understand. In other cases the lure might be “no additional cost video streaming subscriptions.” In yet other cases the value might be the ability to “use all the features of my new phone.”


The point is that mainstream consumers need tangible benefits, and those benefits might not flow directly from “faster speed” claims. 


The concept of the S curve describes consumer adoption behavior,  product life cycles, suggests how business strategy changes depending on where on any single S curve a product happens to be, and has implications for innovation and start-up strategy as well. 


source: Semantic Scholar 


Some say S curves explain overall market development, customer adoption, product usage by individual customers, sales productivity, developer productivity and sometimes investor interest. 


It often is used to describe adoption rates of new services and technologies, including the notion of non-linear change rates and inflection points in the adoption of consumer products and technologies.


In mathematics, the S curve is a sigmoid function. It is the basis for the Gompertz function which can be used to predict new technology adoption and is related to the Bass Model.


I’ve seen Gompertz used to describe the adoption of internet access, fiber to the home or mobile phone usage. It is often used in economic modeling and management consulting as well. 


The S curve also fits and explains consumer adoption of new technologies.


Content Does Not Monetize Itself: Others in the Value Chain are Necessary

Businesses virtually never take positions that undermine or threaten their own interests. So how does Cloudflare benefit from its new emphas...